
In Situ Measurement of Ferric Iron in Lunar Glasses Using Fe-XAS
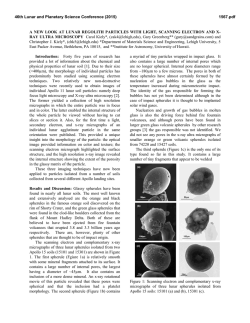
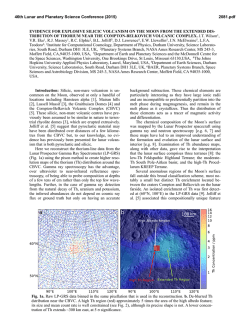
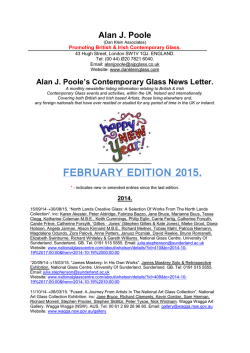
46th Lunar and Planetary Science Conference (2015)
1500.pdf
IN SITU MEASUREMENT OF FERRIC IRON IN LUNAR GLASSES USING FE-XAS: IMPLICATIONS
FOR LUNAR ERUPTION MECHANISMS. M. C. McCanta1, M. D. Dyar2, M. J. Rutherford3, A. Lanzirotti4, and
S. Sutton4. 1Dept. of Earth & Ocean Sciences, Tufts University, Lane Hall, Medford MA 02155 ([email protected]), 2Dept. of Astronomy, Mt. Holyoke College, South Hadley MA 01075, 3Dept. of Earth, Environmental, and Planetary Sciences, Brown University, Providence RI 02912, 4Center for Advanced Radiation
Sources (CARS), The University of Chicago, Chicago, IL 60637, USA.
Introduction: Oxygen is the most abundant element in solids of the solar system, and is surprisingly
variable. Because oxygen is difficult to measure quantitatively through direct methods, it can best be evaluated through analysis of multivalent elements, which
record oxygen potential and are quantified using the
parameter of oxygen fugacity (fO2). The prevailing fO2
of an igneous system constrains phase equilibria and
affects both the crystallization processes of melts and
the composition of the resulting phases. Additionally,
fO2 also exerts control on the partitioning of elements
between the core and silicate portions of terrestrial
planets during planetary differentiation and plays a
role in fluid-driven metasomatism, with potential linkage to atmospheric evolution.
Many existing geoanalytical techniques have been
developed to identify minerals and quantify major,
minor, and trace elements and isotopes at nanoscales
with precision and accuracy. However, interpretable
measurements of redox states at sub-nm and pm scales,
particularly of glasses, have presented formidable analytical challenges. Current glass Fe3+ quantification
methods include wet chemistry and Mössbauer, techniques that require large sample sizes and are performed on bulk material. Synchrotron X-ray absorption spectroscopy (XAS) presents the opportunity to
measure Fe3+ at microscales in situ, thereby allowing
for resolution of potential variations within the sample.
We have developed glass calibration standards to allow for accurate XAS measurements of glasses [1,2].
We present here analyses of lunar glass Fe3+ contents
from both Apollo 15 green glass (A15427) and Apollo
17 orange glass (A74220) samples. The presence of
measureable Fe3+ has important implications for interpreting mechanisms of lunar glass bead eruption as
well as for our understanding of the lunar interior.
Analytical Methods:
Glass standardization. A series of 33 geologicallyrelevant glasses (basalt-rhyolite) was synthesized over
a range of fO2 values (IW-air) to be used as XAS
standards [2]. Fe-XAS analyses were performed on the
quenched glasses at Brookhaven National Lab (BNL),
beamline X26A. Mössbauer analyses of the same
glasses were acquired in the Mineral Spectroscopy Lab
at Mount Holyoke College to determine “true” Fe3+
contents. Multiple methods of data pre-processing and
multivariate techniques were tested to optimize XAS
Fe3+ measurements. Multivariate prediction models
were built from Mössbauer and XAS results using the
open-source machine learning Python library Scikitlearn [3], which was used to train and test partial least
squares (projection to latent structures), Lasso (least
absolute shrinkage and selection operator), and SVR
(support vector regression) models (see [1] for a more
detailed explanation). Our results show that the lasso
provides significantly better results than PLS for this
task. Fe3+ concentrations determined using Mössbauer
result in an accuracy of ±1-3%; those using XAS have
an accuracy rate of ±3% [1,2].
Lunar glass analyses. Lunar glass beads from
Apollo 15 and Apollo 17 were also studied at BNL
beamline X26A under the same conditions as those of
the standards (beam size ~2-5 µm). Major element
compositions of the same locations were analyzed on
the Cameca SX-100 at Brown University. Glass analyses were obtained using a 15 kV acceleration voltage,
10 nA beam current, and a defocused 5-15 µm beam.
Fe3+ contents of lunar glasses were determined using
the lasso model trained on the calibration standards.
Figure 1. Reflected light photomicrographs of analyzed
glass beads. Fe3+ contents are indicated on the image.
Results: Ferric iron was observed in all of the lunar glasses analyzed (Fig. 1). Fe3+ contents ranged
from 2-20%. No differences in Fe3+ contents were observed between the orange and green glasses in the 20
beads analyzed. Fe3+ was low in partially crystalline
glass beads (Figs. 1A,B) and in smaller holohyaline
beads (Fig. 1C). The highest measured Fe3+ was in a
large, holohyaline bead in A74220 (Fig. 1D). In addition, the core and rim of several zoned glass beads
46th Lunar and Planetary Science Conference (2015)
were analyzed in A15427. Fe3+ appears to be zoned
from high core to lower rim, although the difference is
near the limit of analytical accuracy (Fig. 1C).
Discussion: Reports of Fe3+ in lunar materials,
both glasses [4] and minerals [5,6], go back decades.
The lunar interior fO2 however, is ~IW-1 [7,8], a region
where significant Fe3+ is not expected to be present.
However, recent studies indicate the Moon is not as
dry as previously thought [i.e., 9,10]. The presence of
Fe3+ in lunar glasses may well be related to the oxidizing potential of the newly recognized lunar H2O.
The range of Fe3+ contents observed in the glasses
may result from degassing processes during magma
ascent. Previous theories on lunar fire fountain eruptions suggested that graphite in the melt scavenged
oxygen from metal oxides to produce CO gas [11-13]
during ascent from the lunar interior. This occurred as
decreasing pressure stabilized CO over graphite. Production of CO gas therefore resulted in the reduction
of metal oxides. Reduced FeNiCo-metal beads have
been observed in many lunar glass beads [e.g., 14].
It is still possible that some graphitic C was carried
by the ascending picritic magmas; however, recent
experiments show that this is not necessary [15]. With
100’s to 1000 ppm H present, Wetzel et al. [15] find
that CO is dissolved as Fe-carbonyl in a C-saturated
picritic melt at IW-1.0 and pressures up to 1000 MPa.
Because C and H decrease with decreasing P, the first
lunar gas phase would have been formed as Fecarbonyl saturation was exceeded in a rising magma.
Analyses of melt inclusions in orange glass olivine
crystals show decreases in C and S with H trending
toward the low contents in the associated glass beads
[16], confirming this conclusion. It appears an orange
glass magma would produce a CO-rich gas phase deep
in the lunar crust [17]. This gas phase may have originated even deeper based on the volume of the gas bubbles found in several of the melt inclusions [16].
Breakdown of Fe-carbonyl during magma ascent
could also explain formation of Fe-metal beads in picritic glasses [14]. Magma degassing at depth might
have been close to an equilibrium process, despite the
presence of FeNiCo metal beads. Beads trapped in
orange glass olivine crystals are homogeneous
Fe85Ni14Co1 [14], but those in glass show strong zoning to Ni-rich rims [14], indicating an oxidation event
late in the ascent process. Perhaps this degassing oxidized the remaining melt (and metal) as volatile cations coordinated with O in the melt entered the gas,
leaving excess O in the melt [14]. Kinetic degassing of
glass beads after near-surface fragmentation (beadformation) is indicated by different diffusion-loss profiles [9]. If H was lost by H diffusion from an OH or
H2O dissolved species, oxidation would result.
1500.pdf
Later oxidation observed in high-Ni rims of metal
beads in the glasses may also be responsible for Fe3+
contents observed in this study. The lowest Fe3+ contents are recorded in smaller diameter beads (Fig. 1C)
or near bead rims (Figs. 1A-C), while the highest Fe3+
concentration (20%) was measured in the center of a
large, holohyaline glass bead (Fig. 1D). If H loss is
causing oxidation, then the smaller beads and bead
rims, which would be quenched more quickly than the
larger beads or bead interiors, may not be subjected to
significant oxidation. The larger, more slowly cooled
beads would experience greater time for oxidation to
take place, therefore higher Fe3+.
The low Fe3+ observed in the partially crystalline
beads (Figs. 1A-B) may be the result of analytical location. Although these beads cooled more slowly than
the holohyaline samples, the olivines in these beads are
dendritic indicating they are of the most rapidly cooled
crystalline variety [18]. Due to their slower cooling
rate, higher Fe3+ might be expected. However, in both
of the beads studied, XAS analyses were made near
the rim, a region likely to have experienced more rapid
cooling and therefore less oxidation. Further analyses
(i.e., traverses) of different regions in partially crystalline beads are required to better constrain this process.
Future Work: To more fully document the range
of Fe3+ contents present in lunar glasses, additional
XAS measurements are planned for an expanded suite
of samples. These include glasses from all Apollo missions, including volcanic glass beads and magmatic
and agglutanitic glasses. In addition, XAS traverses
are planned to study potential Fe3+ zonation.
Acknowledgments: Research supported by NSF
grants EAR-1219761 and EAR-1219850 and RIS4E,
SEEED, and VORTICES nodes of NASA SSERVI.
References: [1] McCanta M.C. et al. (this volume) LPS
XXXXVI. [2] Dyar M.D. & McCanta M.C. (2014) AGU Fall
Mtg., A4858. [3] Pedregosa F. et al. (2011) J. Machine
Learning Res., 12 , 2825-2830. [4] Dyar M.D. & Consolmagno G.J. (1982) LPS XIII, 193-194. [5] Niebuhr H.H. et al.
(1973) LPS IIII, 971-982. [6] Schürmann K. & Hafner S.S.
(1972) LPS III, 615-621. [7] Sato M. (1976) LPS VII, 13231344. [8] Nicholis M. & Rutherford M.J. [9] Saal A.E. et al.
(2008) Nature, 454, 192-196. [10] McCubbin F.M. et al.
(2010) Am. Mineral., 95, 1141-1150. [11] Sato M. (1979)
LPS X, 311-325. [12] Fogel R.A. & Rutherford M.J. (1995)
Geochim. Cosmochim. Acta, 59, 201-215. [13] Rutherford
M.J. & Papale P. (2009) Geology, 37, 219-222. [14] Weitz
C.M. et al. (1997) Geochim. Cosmochim. Acta, 61, 27652775. [15] Wetzel D.T. et al. (2013) PNAS, doi:
10.1073/pnas.1219266110. [16] Hauri E.H. et al. (2011)
Science, 333, 213-215. [17] Wetzel D.T. et al. (2014) LPS
XXXXV. [18] Heiken G.H. & McKay D.S. (1978) LPS IX,
1933-1943.
© Copyright 2026