
Surface Layer Thermal Inertia Reveals Presence and Depth of
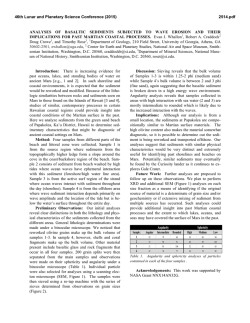
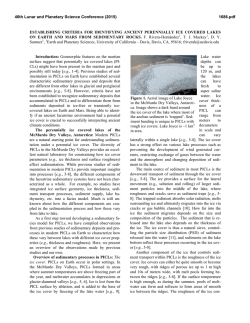
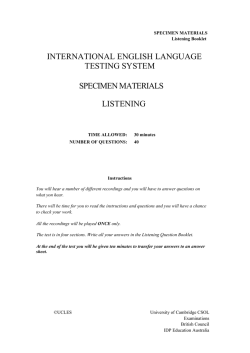
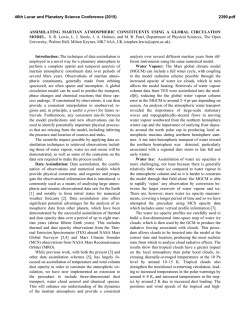
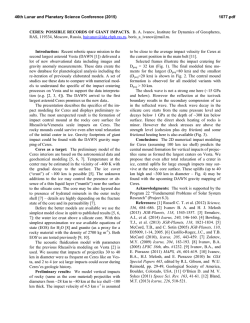
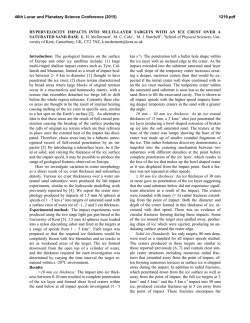
46th Lunar and Planetary Science Conference (2015)
1241.pdf
Surface Layer Thermal Inertia Reveals Presence and Depth of Subsurface Ice. S. R. Baker, Mars Outreach for
North Carolina Students (MONS), Durham Academy High School, Durham, NC 27705 ([email protected])
Introduction: An important part of the search for
current water on Mars is confirming the existence of
subsurface ice. Subsurface water ice on Mars has been
demonstrated by both extensive modeling – gamma ray
and neutron spectroscopy – and direct observation
[1][2]. In theory, the depth of subsurface ice on Mars
may be estimated by evaluating the thermal inertia of
the regolith surface layer, which can be performed
remotely [3]. Thermal inertia is a measure a material’s
thermal responsiveness to changes in temperature and
is defined by the equation:
𝐼≡
𝑘𝜌𝑐 [J m-2 K-1 s-½]
𝑘 = 𝑡ℎ𝑒𝑟𝑚𝑎𝑙 𝑐𝑜𝑛𝑑𝑢𝑐𝑡𝑖𝑣𝑖𝑡𝑦 [W m-1 K-1]
𝜌 = 𝑏𝑢𝑙𝑘 𝑑𝑒𝑛𝑠𝑖𝑡𝑦 [𝑘𝑔 𝑚 -3]
𝑐 = 𝑠𝑝𝑒𝑐𝑖𝑓𝑖𝑐 ℎ𝑒𝑎𝑡 𝑐𝑎𝑝𝑎𝑐𝑖𝑡𝑦 [J kg-1 K-1]
Thermal data from Mars has been collected by
THEMIS (THermal EMission Imaging System), an
instrument on the Mars Odyssey orbiting spacecraft
that measures visual and infrared wavelengths and can
demonstrate diurnal and seasonal heating and cooling
of Martian sediment [4]. Modeling using thermal
inertia data indicates subsurface ice as close as 5 cm
from the surface [3].
Because thermal inertia of ice (2176 J m-2 K-1 s-½) is
significantly greater than the thermal inertia of
sediment (250 J m-2 K-1 s-½) [5], Bandfield
hypothesized that ice just a few centimeters below the
surface would cause the surface layer of sediment to
resist changes in temperature more than sediment with
deeper or no subsurface ice [3]. In order to test this
theory, an experiment was conducted under controlled
conditions to determine whether the thermal inertia
measured at the surface is affected by the presence and
depth of subsurface ice.
Analytical Approach: To test the effect of
subsurface ice on the thermal inertia of surface
sediment, three different models were created: a
control model with no ice, a model with a near-surface
ice table, and a model with a deeper ice table.
Each model was constructed in an insulated
container measuring 25 cm wide by 38 cm long by
33 cm tall. The control model contained 30 cm of
sediment and no ice. The near-surface ice table model
contained 5 cm of sediment on top of 25 cm of crushed
ice, and the deeper ice table model contained 15 cm of
sediment on top of 15 cm of crushed ice.
For each of these three models, the surface
temperature was measured while the surface sediment
was heated and then allowed to cool. The sediment
samples were heated with a lamp that generated 630
watts per square meter, which closely simulates the
590 watts per square meter experienced by Mars’s
surface. An infrared reptile lamp was used because it
emits a wide range of energy, including ultra-violet
light, similar to the range found on Mars. The
temperature
was
measured
using
infrared
thermometers.
The Mars regolith analog used for these
experiments was sediment collected from the Eno
River in Durham, North Carolina, that was sieved and
rinsed to remove observable clay and dust. The
samples were then baked to remove residual water.
The sediment ranged in diameter from 0.5-1mm
(“coarse sand” on the Udden-Wentworth Scale) to 1040mm (“pebble gravel”) because Martian sediment
contains a range of particle sizes.
The experiment was configured according to the
diagram in Figure 1. The temperature of the center of
each sample was measured remotely with an infrared
thermometer prior to the start of the experiment. The
heat lamp was subsequently turned on and temperature
readings were recorded every minute for 30 minutes.
After 30 minutes, the lamp was turned off, and
temperature readings were again recorded every
minute for an additional 30 minutes as the sample
cooled. At the end of both the heating and cooling
phases, the temperature of the sample for each model
reached near-stability with temperatures fluctuating
within approximately 0.5 oC.
For each of the three models, two heating-cooling
cycles were performed, and the average temperature at
each minute was plotted using Excel (Microsoft Excel
for Mac 2011, version 14.2.2).
Figure 1
46th Lunar and Planetary Science Conference (2015)
Results: As shown in the graph in Figure 2, the
temperature measurements for the sediment-only
control very nearly match the measurements for the
deeper ice table model (ie., 15 cm of sediment over
15 cm of ice). Baseline temperature for the control
was 23.2 °C with a maximum temperature of 46.8 °C.
Temperature declined to 24.2 °C when the heat source
was removed. Similarly, the deeper ice table model
had a baseline temperature of 22.5 °C, rose to a
maximum of 44.8 °C, and cooled to 23.7 °C. The data
and graph confirm that the thermal inertia of the
control was nearly identical to that of the deeper ice
table model.
In contrast, the temperature of the near-surface ice
table model rose more slowly, indicating a higher
thermal inertia than the control. The near-surface ice
table model had a baseline temperature of 21.7 °C and
a maximum temperature of only 37.5 °C. Its final
temperature was 13.5 °C.
Figure 2
1241.pdf
Future Works: In the future, a more precise
analogue for Martian regolith could be used instead of
the coarse sand/pebble gravel mixture available for this
experiment. The Martian surface also includes a wider
range of grain sizes from fine dust to larger boulders
that affects the thermal inertia.
For this experiment, the ice table was comprised of
pure water ice chips. However, most of the subsurface
ice on Mars is a mixture of sediment and ice [6]. In the
future, this work could be repeated using varying
mixtures of ice and sediment beneath a layer of
sediment.
The ambient temperature on Mars is, on average,
-46 oC. In contrast, the temperature of the lab in which
the experiment was performed was approximately
+21 oC. Because the ambient temperature has a large
effect on the measured surface temperature, the
experiment could be performed in an extremely cold
environment that better mimics Martian conditions.
Acknowledgements: I would like to thank
Howard Lineberger, Samuel Fuerst, and Charles Payne
for coordinating the MONS (Mars Outreach for North
Carolina Students) program. Thanks to Dr. Jeff
Moersch of the University of Tennessee, who is
conducting similar research to design models to best
interpret THEMIS infrared data.
Discussion: The results demonstrate that thermal
inertia can be used to recognize sub-surface ice, but
only if the ice table is within several centimeters of the
surface. The rise in temperature of the sediment-only
control over the 30 minutes of heating (23.6 °C) was
substantially greater than the rise in temperature for the
near-surface ice table model (15.8 °C). This difference
confirms that water ice within 5 cm of the surface
alters the thermal inertia of the surface layer.
In contrast, in this experiment, water ice at a depth
of 15 cm (deeper ice table model) did not affect the
thermal responsiveness of the surface sediment. The
heating and cooling curves of the control model and
deeper ice table model are nearly identical. There is a
slight separating in the heat curves, but this could be
due to a lack of controlled variables in the
environment.
References:
[1] Schorghofer N., Forget F. History and Anatomy of
Subsurface Ice on Mars. Icarus 220: 1112-1120; 2012.
[2] "Confirmation of Water on Mars". Nasa.gov. 200806-20. Retrieved 12-24-2014.
[3] Bandfield J.L.. High-Resolution Subsurface WaterIce Distributions on Mars. Nature 447: 64-68; 2007.
[4] About THEMIS & the Mars Odyssey Mission
<http://themis.asu.edu/about>. Retrieved on 12-242014.
[5] Schorghofer N.. Fast Numerical Method for
Growth and Retreat of Subsurface Ice on Mars. Icarus
208: 598-607; 2010.
[6] Found it! Ice on Mars.
http://science.nasa.gov/science-news/science-atnasa/2002/28may_marsice/. Retrieved 12-24-2014.


© Copyright 2026