
Global Mapping of Near-Surface Water
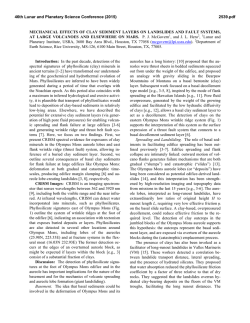
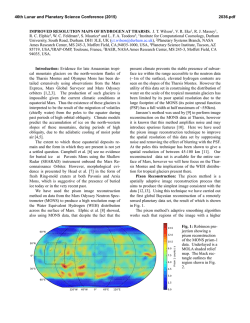
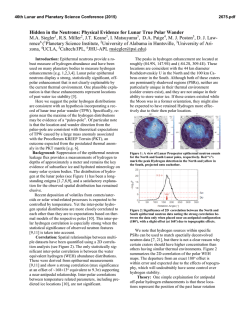
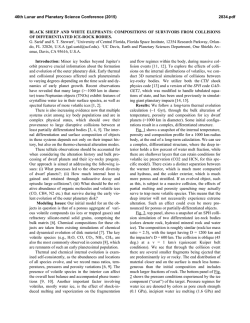
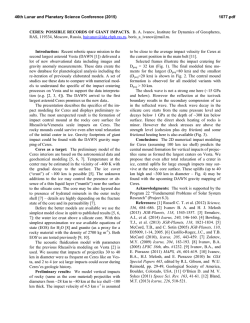
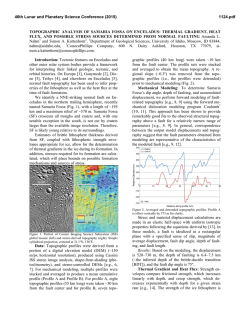
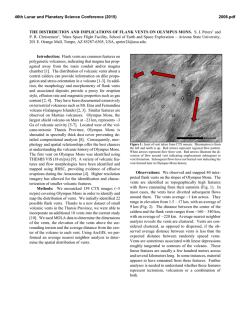
46th Lunar and Planetary Science Conference (2015)
2459.pdf
GLOBAL MAPPING OF NEAR-SURFACE WATER-EQUIVALENT HYDROGEN. Asmin V. Pathare1, William C. Feldman1, Thomas H. Prettyman1, Elizabeth Jensen1, and Sylvestre Maurice2, 1Planetary Science Institute,
Tucson, AZ 85719 ([email protected]), 2IRAP, Université Paul Sabatier, CNRS, Toulouse, France.
Introduction: We report on MDAP-funded efforts
to improve upon global mapping of near-surface waterequivalent hydrogen (WEH). To date, more than 3.5
Mars years of neutron data measured by the Mars Odyssey Neutron Spectrometer (MONS) have been analyzed to develop global maps of hydrogen concentration interpreted using a simple 2D model of the outer
~0.5 meter of Martian crust [1]. A two-layer nearsurface regolith model is assumed that expresses hydrogen concentration in terms of: (1) an upper layer of
weight fraction Wup having (2) thickness D overlying a
(3) semi-infinite lower layer of weight fraction Wdn.
Initial MONS-derived global maps of Wdn and D
assumed constant Wup [2]. More recently, Feldman et
al. [3] self-consistently calculated Wup directly from
MONS data using “cross over” of fast vs. epithermal
neutrons with unity line for large representative regions of interest (ROIs). However, application of this
crossover technique using unweighted sliding 1800-km
diameter ROIs resulted in large areas at low latitudes
with unphysical negative values of Wup [3]. Here, we
recompute Wup using distance-weighted ROIs and linear chi-squared minimization regression (Fig. 2), resulting in just one unphysical negative region (in Valles
Marineris). Figure 2 thus represents the best midlatitude map of Wup to date (note values poleward of
60° will likely require a quadratic instead of linear fit).
For known crossovers, values of Wdn and D can
more accurately be determined via 3D interpolation
(Fig. 1) of Wup-dependent simulated grids of thermal
and epithermal MONS counts along Wdn and D contours (not shown). For example, the “Old” method of
MONS mapping of Wdn [1] in the vicinity of five recent ice-rich mid-latitude craters (Fig. 3) identified by
Byrne et al. [4] yields values of “Old Wdn“ at four
impact sites much lower than the 26% threshold for
excess ice (Table 1). This is problematic, as the relatively rapid sublimation of exposed ice in the craters
implies the presence of discrete clean ice at fractions
well above that of the 26 wt% pore ice maximum [4,5].
Our “New” method of crossover-dependent MONS
mapping, however, results in much higher values of
Wdn (51%-96%) that are consistent with the presence of
excess ice at all five recent impact sites (Table 1).
Further Work: We will also improve spatial
crossover resolution by deconvolving the intrinsic spatial resolution of the MONS sensors. We have recently
successfully applied an improved spatial deconvolution
algorithm to most of the MONS Prism 1 (downwardfacing) sensor data, from which we derive epithermal
Figure 1: 3D plots of Wdn (top) and burial depth D
(bottom) interpolated from irregular grid for “S21” soil
composition [6] and Wup = 1%. Additional Wdn and D
plots also generated for Wup = 2/3/4 % (not shown).
neutron fluxes. This will significantly improve the resolution of the epithermal neutron counting rates needed
for determination of Wup by up to a factor of 2. Subsequent deconvolution of Prism 2 (forward-facing) and
Prism 4 (backward-facing) will likewise improve the
resolution of the thermal neutron mapping needed for
definition of Wdn and D once our revised global mapping of Wup is completed. Ultimately, our objective is
to continue the progress made with weighted fitting,
3D interpolation, and spatial deconvolution techniques
that include fast and thermal neutron counting rates to
produce more accurate Wup-dependent global maps of
Wdn and D at higher spatial resolution.
References: [1] Maurice S. et al. (2011) JGR, 116,
E11008. [2] Feldman W.C. et al. (2004) JGR, 109,
E09006. [3] Feldman W.C. et al. (2011) JGR, 116,
E11009. [4] Byrne S. et al. (2009) Science, 325, 16741676. [5] Dundas C.M. et al. (2014) JGR, 119, 109127. [6] Diez B. et al. (2008) Icarus, 196, 409-421.
[7] Mellon M.T. et al. (2004) Icarus, 169, 324-340.
46th Lunar and Planetary Science Conference (2015)
Figure 2: Map of Wup = crossover points from the linear chi-squared minimization regressions between
WEHD0(fast) and WEHD0(epi) data in inverse distance-squared weighted regions of interest spaced
every two degrees of latitude and longitude. The dynamic range spans 0-6, so the purple (in Valles
Marineris) actually corresponds to unphysical negative values, and the red to highly positive values.
Figure 3: Taken from Byrne et al. [4]. Locations of five recent ice-rich impacts (“Site 1-5”) and
Viking Lander 2 (“VL2”). Color bar represents expected ice depths modeled by Mellon et al. [7].
Contours are MONS-derived burial depths (g/cm2) from Feldman et al. [2].
Table 1: Adapted from Byrne et al. [4]. “Old” [3] and “New” (this abstract) MONS-derived values of Wup,
Wdn, and D at five recent impact sites shown in Fig. 3. The short-lived presence of ice [4] implies discrete layer
of excess ice greater than pore space limit (Wdn = 26 wt%) that is predicted at each site by “New” (but not
“Old”) MONS methodology. The “New” MONS-derived D values are also a somewhat better fit to ice depths
modeled by Mellon et al. [7] assuming a nominal soil density of 1.5 g/cm3.
2459.pdf

![Download the PDF [178 KB]](http://s2.esdocs.com/store/data/000499344_1-7f4373c1afe39f332b14a8d11d1a7c7f-250x500.png)
© Copyright 2026