
Download Full Report - OCBC Investment Research
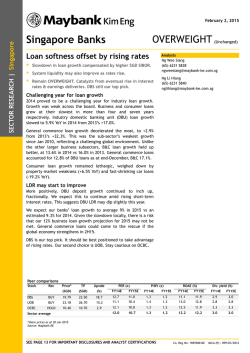
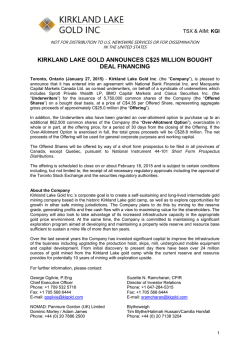
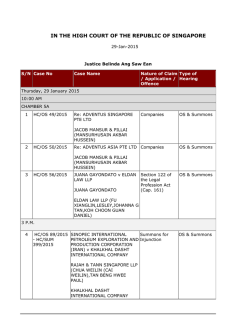
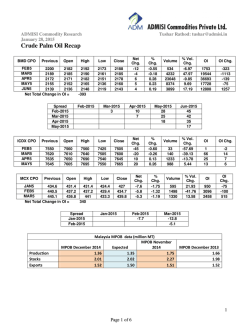
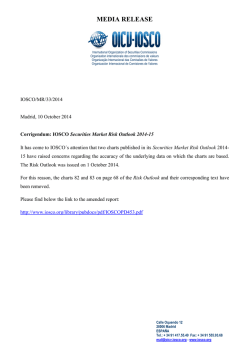
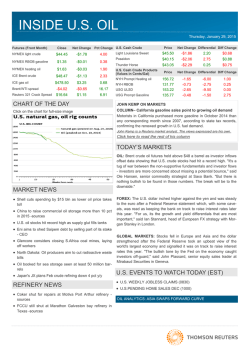
Singapore | Food Products Asia Pacific Equity Research GOLDEN AGRI-RESOURCES | SELL MARKET CAP: USD 4.0B 2 Feb 2015 Company Update AVG DAILY TURNOVER: USD 12M STILL A SELL ON STRENGTH SELL (maintain) Fair value S$0.440 add: 12m dividend forecast S$0.010 versus: Current price S$0.420 Rebound likely temporary More near-term downside risks SELL above S$0.45 12m total return forecast Hit 52-week low of S$0.41 Golden Agri-Resources’ (GAR) share price recently hit a fresh 52-week low of S$0.41 (on 22 and 23 Jan), no doubt weighed by the recent pullback in CPO prices. As warned in our 14 Dec 2014 report, we believe that the stock could slip to S$0.40 before stabilizing. Although the stock did make a rebound shortly thereafter to S$0.435, we believe that the worst may not be over. Crude prices could see another leg down For one, the persistent weakness in crude oil prices could continue to weigh on CPO prices, given the bio-diesel link (which has since broken down as it is even more unprofitable to process CPO or other vegetable oils into bio-diesel). While crude prices are now hovering between US$45 and US$48/barrel, some market watchers are not ruling out another leg down for crude; some speculate that prices could tumble to US$30/barrel, while others expect the weakness in crude prices to be fairly prolonged (the expectation of a rebound in crude has been pushed back towards end-2015 instead of mid-2015)1. Analysts Carey Wong (Lead) ● +65 6531 9808 [email protected] Wong Teck Ching (Andy) CFA ● +65 6531 9817 [email protected] Key information Market cap. (m) S$5,392 / USD3,987 Avg daily turnover (m) S$16 / USD12 Avg daily vol. (m) 31.1 52-wk range (S$) 0.41 - 0.615 Free float (%) 50.0 Shares o/s. (m) 12,837.6 Exchange SGX BBRG ticker GGR SP Reuters ticker GAGR.SI SGX code GICS Sector Sluggish demand likely in winter months Secondly, the demand for CPO is also expected to decline in the winter months; this as palm oil will solidify at much higher temperatures as compared to other vegetable oils. Thirdly, the prices of competing vegetable oils like soy and corn are still on the soft side, further reducing the substitution effect. Last but not least, the expected growth in demand could be slower than expected, after the cut in global economic growth expected for 2015, especially in China2. 7% E5H Consumer Staples GICS Industry Food Products Massingham Ltd36.5% Top shareholder Relative total return 1m 3m 12m Company (%) -8 -17 -18 STI-adjusted (%) -9 -22 -33 Price performance chart Maintain SELL on strength Although GAR’s share price is currently hovering around our unchanged fair value of S$0.44 (based on 13.5x FY15 EPS, supported by a strengthening USD), we do foresee more near-term downside risk. As such, we maintain our SELL rating on the stock, especially above S$0.45. 1 http://finance.yahoo.com/news/oil-etfs-investment-banks-cut192021071.html 2 http://www.bloomberg.com/news/articles/2015-01-13/world-bank-cutsglobal-growth-outlook-with-u-s-lone-bright-spot Sources: Bloomberg, OIR estimates Key financial highlights Year Ended 31 Dec (US$m) Industry-relative metrics FY12 FY13 FY14F FY15F 6,051.7 6,585.0 7,293.8 7,612.4 785.2 662.3 541.7 632.4 49.3 36.9 0.0 0.0 Core Net Profit 404.3 318.4 224.2 316.8 EPS (US cents) 3.2 2.4 1.7 2.5 na na 2.0 2.7 Price/NTA (x) 0.5 0.5 0.5 0.5 EV/EBITDA (x) 7.0 9.8 11.8 9.6 15.2 25.8 24.6 20.4 3.9 2.8 2.0 2.8 Revenue EBITDA Bio-asset Revaluation Cons. EPS (US cents) Net gearing (%) ROIC (%) Note: Industry universe defined as companies under identical GICS classification listed on the same exchange. Sources: Bloomberg, OIR estimates Please refer to important disclosures at the back of this document. MCI (P) 004/06/2014 SELL (maintain) OCBC Investment Research Singapore Equities Exhibit 1: Crude and CPO Price Trends Source: Bloomberg, OIR Exhibit 2: Correlation of 0.85 with CPO Prices Source: Bloomberg, OIR 2 OCBC Investment Research Singapore Equities Company financial highlights Income statement Year Ended 31 Dec (US$m) FY12 FY13 FY14F FY15F 6,051.7 785.2 -115.8 49.3 677.8 -66.7 -24.2 611.8 409.6 404.3 6,585.0 662.3 -134.0 36.9 528.4 -89.3 0.0 430.0 311.3 318.4 7,293.8 541.7 -177.0 0.0 364.7 -90.1 0.0 303.6 224.2 224.2 7,612.4 632.4 -171.9 0.0 460.6 -76.4 0.0 429.2 316.8 316.8 Balance sheet Year Ended 31 Dec (US$m) FY12 FY13 FY14F FY15F Cash Other Current Assets Fixed Assets Total Assets Current Liabilities less Debt Debt Other Long Term Llabilities Total Liabilities Shareholders Equity Total Equity and Liabilities 559.5 1,862.3 2,007.5 13,286.1 868.7 1,854.5 1,944.7 4,667.9 8,526.6 13,286.1 327.5 2,211.0 2,351.0 14,148.2 824.5 2,580.8 1,939.6 5,344.8 8,720.6 14,148.2 389.6 2,331.6 2,174.0 14,324.1 862.9 2,570.0 1,955.6 5,388.5 8,850.8 14,324.1 340.3 2,341.6 2,002.1 14,162.9 888.4 2,188.0 1,955.6 5,032.0 9,043.0 14,162.9 Cash flow statement Year Ended 31 Dec (US$m) FY12 FY13 FY14F FY15F 766.4 -115.5 342.6 -370.5 -909.8 299.3 797.3 878.5 311.3 559.5 628.0 -286.6 18.3 -477.0 -852.2 0.0 744.0 612.1 -221.7 327.5 520.7 233.1 677.2 -400.0 -478.3 0.0 -10.8 -136.8 62.1 389.6 627.4 358.9 910.0 -350.0 -482.4 0.0 -382.0 -476.9 -49.3 340.3 Key rates & ratios FY12 FY13 FY14F FY15F EPS (US cents) Core EPS (US cents) Core PER (x) Price/NTA (x) EV/EBITDA (x) Dividend yield (%) ROIC (%) ROE (%) Net gearing (%) PE to growth (x) 3.2 3.1 10.4 0.5 7.0 2.8 3.9 4.8 15.2 -0.3 2.4 2.5 13.2 0.5 9.8 2.6 2.8 3.6 25.8 -0.6 1.7 1.7 18.8 0.5 11.8 1.7 2.0 2.5 24.6 -0.6 2.5 2.5 13.3 0.5 9.6 2.3 2.8 3.5 20.4 0.3 Revenue EBITDA Depreciation & Amortisation Bio-asset Revaluation Operating Profit Net Interest Exceptionals Pre-tax Profit Net Profit Core Net Profit Operating Profit Working Capital Changes Net cash from Operations Capex Investing Cash Flow Change in Equity Net Change in Debt Financing Cash Flow Net Cash Flow Ending Cash Balance Sources: Company, OIR forecasts Company financial highlights OCBC Investment Research Singapore Equities SHAREHOLDING DECLARATION: The analyst/analysts who wrote this report holds/hold NIL shares in the above security. DISCLAIMER FOR RESEARCH REPORT This report is solely for information and general circulation only and may not be published, circulated, reproduced or distributed in whole or in part to any other person without our written consent. This report should not be construed as an offer or solicitation for the subscription, purchase or sale of the securities mentioned herein. Whilst we have taken all reasonable care to ensure that the information contained in this publication is not untrue or misleading at the time of publication, we cannot guarantee its accuracy or completeness, and you should not act on it without first independently verifying its contents. Any opinion or estimate contained in this report is subject to change without notice. We have not given any consideration to and we have not made any investigation of the investment objectives, financial situation or particular needs of the recipient or any class of persons, and accordingly, no warranty whatsoever is given and no liability whatsoever is accepted for any loss arising whether directly or indirectly as a result of the recipient or any class of persons acting on such information or opinion or estimate. You may wish to seek advice from a financial adviser regarding the suitability of the securities mentioned herein, taking into consideration your investment objectives, financial situation or particular needs, before making a commitment to invest in the securities. OCBC Investment Research Pte Ltd, OCBC Securities Pte Ltd and their respective connected and associated corporations together with their respective directors and officers may have or take positions in the securities mentioned in this report and may also perform or seek to perform broking and other investment or securities related services for the corporations whose securities are mentioned in this report as well as other parties generally. Privileged / confidential information may be contained in this document. If you are not the addressee indicated in this document (or responsible for delivery of this message to such person), you may not copy or deliver this message to anyone. Opinions, conclusions and other information in this document that do not relate to the official business of OCBC Investment Research Pte Ltd, OCBC Securities Pte Ltd and their respective connected and associated corporations shall not be understood as neither given nor endorsed. RATINGS AND RECOMMENDATIONS: - OCBC Investment Research’s (OIR) technical comments and recommendations are short-term and trading oriented. - OIR’s fundamental views and ratings (Buy, Hold, Sell) are medium-term calls within a 12-month investment horizon. - As a guide, OIR’s BUY rating indicates a total return in excess of 10% based on the current price; a HOLD rating indicates total returns within +10% and -5%; a SELL rating indicates total returns less than -5%. Co.Reg.no.: 198301152E Carmen Lee Head of Research For OCBC Investment Research Pte Ltd Published by OCBC Investment Research Pte Ltd Published by OCBC Investment Research Pte Ltd Important disclosures


© Copyright 2026