
Numerical programming in C
Numerical programming in C
Mervyn Roy
January 28, 2015
1
Introduction
In this workshop you will gain experience in writing C code to solve numerical
problems. You will develop simple numerical algorithms and learn about
numerical convergence, accuracy and stability.
1.1
Algorithms
To investigate physical problems we develop mathematical models and then
attempt to solve the equations. Often this cannot be done analytically and
instead we must use a computer. But how do we use a computer programme
to solve a mathematical problem? First we must develop an algorithm: a
set of instructions the computer can follow to perform the numerical task
we are interested in. Next we need to develop a programme to implement
the algorithm. Importantly, we must then test our programme, and finally
we can run the programme to generate the results we need.
A good piece of advice when writing a new piece of code from scratch is to
start from the basics. Break the algorithm into steps then programme and
test each step in turn. The smaller the piece of code involved, the easier it
is to find problems. Making the code compile is the first and easiest step.
It is then more difficult (and important) to check the numerical accuracy of
the code. Although it may compile and run, is the code actually doing what
you want it to? It is important to be absolutely confident that your code is
working as you would expect before using it to generate new results.
1
1.2
Existing software
There are many existing numerical software packages that can help when
solving numerical problems computationally. These range from low level
subroutines and functions, like the blas and lapack linear algebra routines,
to sophisticated software packages such as MatLab, Maple or IDL that come
with canned routines for solving standard problems. Most of these packages
are excellent and their use can make life much easier. However, you should
never use these routines just as a ’black box’. One rule of thumb is that the
more sophisticated a package, the more cautious you should be of using it
without at least some understanding of the underlying numerical methods
that it employs.
1.3
Further reading
This workshop introduces numerical methods, but this is an enormous field
and, even in the areas covered here, we will barely scratch the surface. For
further information look at the excellent Numerical Recipes in C by Press,
Teukolsky, Vetterling and Flannery. This book covers important numerical
techniques in a broad range of subjects and also has a comprehensive list of
references.
2
Numerical integration
Imagine we want to find the definite integral
b
A=
f (x)dx.
(1)
a
Perhaps the integral cannot be performed analytically, or perhaps f (x) is
some numerical data stored in a table. Then we will need to calculate A
using a computer programme.
First, we need an algorithm. A is just the area under the curve f (x) from
x = a to x = b. To find the area, we could draw f (x) on graph paper and
count the squares underneath the curve. Here we will develop a computer
programme which will essentially do this for us. The key to the method is
to split up the unknown area A into smaller sections of area that we can
calculate.
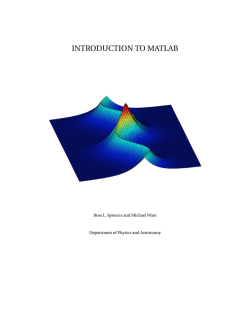
One way to do this is illustrated in Fig. 1. Here, the area A is split into
trapeziums. In Fig. 1 we divide the range of the integral (a ≤ x ≤ b) into
2
f2
f3
f1
f0
A1
A2
A3
h
x0=a
x1=a+h
x2=a+2h
x3=b
Figure 1: Trapezium rule algorithm on a uniform grid.
3 equal sections. If we know the value of f (x) at each of the points x0 = a,
x1 = a + h, x2 = a + 2h and x3 = b we can then calculate the area of each
trapezium section, for example A1 = 0.5h(f0 + f1 ), and sum the areas of all
of the trapeziums to get an approximation to the integral, A.
1
1
1
h(f0 + f1 ) + h(f1 + f2 ) + h(f2 + f3 )
2
2
2
1
= h (f0 + f3 ) + f1 + f2 .
(2)
2
A ≈ A1 + A2 + A3 =
Obviously, A1 + A2 + A3 is not a very accurate estimate for A, but the
approximation can easily be improved by splitting the range of the integral
into smaller sections. The trapezium rule algorithm works by approximating
the function f (x) to first order within each small range, h. For example,
close to x = a,
f (a + δ) = f (a) + δ
df
dx
+
a
δ 2 d2 f
2 dx2
+ ···,
(3)
a
where 0 ≤ δ < h. As the range is split into smaller sections, h becomes
smaller and the second order (and other higher order) corrections become
less important. From Eqs. (2) and (3) it is clear that the trapezium rule
is accurate to within a constant multiplied by h3 f . In mathematical text
books this is usually denoted by 0(h3 f ).
There are many higher order algorithms for numerical integration but, to
paraphrase ref. [1], ’higher order does not necessarily mean higher accuracy’. The trapezium rule is usually good for most purposes, but another
important algorithm is Simpson’s rule which, through a lucky cancellation
of higher order terms, is accurate to 0(h5 f (4) ). We should also briefly mention open integration formulae. The trapezium rule is a closed formula: it
explicitly includes the end points f (a) and f (b) from Eq. 2. It is also possible to develop algorithms which do not include these points and this can
3
be advantageous in some situations. For example if f (a) is a singular point.
See ref. [1] for more information.
To develop a general trapezium rule algorithm to calculate A first split the
range b − a into N equal sections so x0 = a, x1 = a + h, · · · , xN −1 = b where
h = (b − a)/(N − 1). Then
b
f (x)dx = h
A=
a
= h
1
(f0 + fN −1 ) + f1 + f2 + · · · + fN −2 + 0(h2 )
2
N −2
1
(fo + fN −1 ) +
fi .
2
i=1
(4)
This is easily coded with a single for loop in a C programme.
2.0.1
Task: calculate
π
1
2xdx using the trapezium rule
• First code the algorithm. Split it into steps then programme and test
each step separately. First define the number of steps N. Then calculate
the step size, h=(pi-1.0)/(N-1.0).
• Use a for loop to count over the N points. For each point calculate
the required value of x and f=2.0*x. An example section of code to
calculate and print values of x from 0 to (N − 1)h is
for (i=0;i<N;i++){
x=h*i;
printf("%e\n",x);
}
• Output x and f to a file and plot the results (see the appendix on
plotting with gnuplot) to check that the code is working.
• Sum each of the values of f with the appropriate weighting to calculate
A. An example section of code to calculate the sum of all the integers
between 1 and N − 1 is
A=0;
for (i=1;i<N;i++){
A=A+i;
}
printf("Sum = %e\n",A);
The important line is A=A+i: each time around the loop the new value
of A is set to be equal to the old value of A plus the current value of i.
So, the first time around the loop the old value of A is 0 and the new
value is then set to be 0+1 = 1. The second time around the loop the
4
old value of A is now 1, the value of i is 2 and so the new value of A
is set to be 1+2 = 3.
• The trapezium rule should be exact for this integral, independent of
the number of points. Check that this is the case.
2.0.2
Task: calculate
3π/4
π/3 sin(x)dx
and examine the convergence
3π/4
• Modify the code to calculate π/3 sin(x)dx. First generate and plot x
and f=sin(x) between π/3 and 3π/4.
• Calculate and plot the integral as a function of the step size h (or,
alternatively as a function of the number of points, N ). Compare the
numerical result to the analytical result and see how the numerical
result converges to the exact value as h → 0 (or N → ∞).
2.0.3
Task: calculate
4
10−4
ln(x) sin(exp(−x))dx
The first few tasks simulate the type of testing procedure you should go
through with any new piece of code. Once the code has been tested you can
then be more confident in applying it to unknown cases.
4
• Investigate the convergence of 10
−4 ln(x) sin(exp(−x))dx as a function
of the number of points in the integral.
2.1
Nonlinear grids
The problem with the function in the previous task is that it varies rapidly
near to the origin and slowly everywhere else. A small step size is needed
to get accurate values to the integrand but, away from the origin, the small
steps are unnecessary and by calculating them we are wasting computer
time. One solution is to break up the range of the integral and use different
uniform step sizes in each range. Another solution is to use a continuously
varying step size. This type of grid is often useful in physical problems
where the length scale varies continuously. For example, exponential grids
are often used in atomic physics problems to deal with the rapid variation
of the potential near to the nucleus.
5
2.1.1
Task: generalise the trapezium rule to non-uniform step
size
• Generalise the trapezium rule algorithm to the case of non-uniform
step size. For each step you will need to calculate the area of the
associated trapezium (A1 , A2 and A3 from Fig. 1) and then sum the
areas to get the final result. First, keep the step size as h and test the
new version of the code against the previous version.
• Generate an appropriate non-uniform grid. An example section of
code to do this is
xmult=...;
x=1.e-4/xmult;
for (i=0;i<N;i++){
x=x*xmult;
if (i>0) h=x-xold; /* h is the step size */
xold=x;
}
• Compare the convergence of the new algorithm with the uniform step
size algorithm by plotting the result for the integral as a function of
N . What other types of non-uniform grid could you use?
3
Series
Computers are fantastic tools for performing simple numerical tasks again
and again. This means that sequences and series can be very easy to evaluate
using a computer programme.
3.1
3.1.1
Power series
Task: evaluate the Maclaurin series for exp(x)
• Use a single loop to evaluate the Maclaurin series for exp(x) with nmax
terms in the expansion and for a given value of x. nb. you can calculate
the factorial with a similar code fragment to that used in task 2.1.1
and you can sum up the series in a similar way to the example in task
2.0.1.
Hint: Think about the largest number you can represent as an integer and try
calculating a range of factorials as both integers and doubles. Can you explain what
you see?
6
• Calculate and plot the Maclaurin series result for e10 and e−10 as a
function of the number of terms in the series. What is the smallest
fractional difference you can obtain between the exact and series values? What limits this difference, and why is the result different for e10
and e−10 ?
3.2
Fourier series
As another example let us examine the Fourier sine series for f (x) = 1 with
0 < x < l. This is
∞
nπx
,
(5)
f (x) =
bn sin
l
n=1
where
bn =
4/(nπ)
0
if n is odd,
otherwise.
(6)
As usual, to calculate f (x) we first need an algorithm. Imagine that we
would like to calculate f (x) for a particular value of x (say x = 2). Once we
have chosen a value of x we must evaluate the sum in Eq. 5 but, as before,
we cannot compute an infinite number of terms. Instead we have to cut
off the series at some maximum number of terms (nmax ) and later we will
use our computer program to see how the series converges as the number of
terms increases. To calculate
nmax
f (x) =
bn sin
n=1
nπx
l
(7)
we can use a fragment of code that looks something like the following:
x = 2.0;
f = 0.0;
for (n=1; n<=nmax; n++) {
bn = ...;
f = f + bn * sin(n*pi*x/L);
}
On the first line we tell the computer what value of x we are interested in
(x=2.0). Then, for each different value of n we calculate bn using the result
from Eq. 6. The next line sums up each term in the series. This uses exactly
the same method as in task 2.0.1: the new value of f equals the old value
of f plus bn sin(nπx/l).
To produce a plot of f (x) against x we need to calculate the series for
a range of different x values, and we can do this easily in our computer
7
program with another loop. If we want to plot a graph with ixmax points
between some minimum (xmin) and maximum (xmax), x-values we must
calculate the Fourier series (as above) at each of the ixmax points. This can
be done with the following code fragment:
for (ix=0; ix<ixmax; ix++){
x = ...
f = 0.0;
for (n=1; n<=nmax; n++) {
bn = ...;
f = f + bn * sin(n*pi*x/L);
}
printf("%e\t%e\n",x,f);
}
3.2.1
Task: Fourier series of a square wave
• Code the algorithm to calculate the Fourier series of the square wave.
As usual, test each part of the code as you write it. Investigate the
appropriate number of x points ixmax that you will need to generate smooth curves. Then plot the Fourier series between −l and 3l.
Explain the shape of the waves that you see.
• Examine the convergence of the series then investigate (and plot) the
Gibbs oscillations as a function of nmax.
3.2.2
Task: Fourier series of more complex functions
• Calculate the Fourier sine series for f (x) = 1/(2 − e−x ) for 0 ≤ x < π.
In this case we do not know the analytical result for bn . Instead we
must calculate it numerically from bn = (2/π) 0π f (t) sin(nt)dt and
this can be done with the code produced in task 2.0.1. Think about
the most efficient way to do this. You will need three loops: one
loop over x, one loop over n and one extra loop over t to perform the
integral to evaluate bn . But, because bn does not depend on x, it would
be very inefficient to simply nest the t loop inside the existing code:
we only need to calculate each bn once, not ixmax times. One solution
is to calculate and store each bn in an array variable at the start of
the code, before the loop over x. Think of another efficient way to
rearrange the loops. Programme one method and compare the Fourier
series result for f (x) to the exact function. n.b. remember that array
variables are defined by, for example, double b[10]. This will reserve
8
space for 10 double precision numbers which can be accessed by b[0],
b[1], etc.
4
Finding the roots of an equation
Often we may want to solve an equation f (x) = 0 where an exact analytical
solution is not possible. We could try to approximate the solutions, or
we could attempt to solve the equation graphically or numerically with a
computer programme.
The way that most numerical equation solvers work is as follows: first we
guess a value for the root, say x = x1. Then we use some information about
the function or its derivatives at x = x1 to generate a new, (hopefully)
better, guess for the root at x = x2 . We can then repeat this procedure
and move iteratively toward the real root (x = x0 ) until, after N iterations,
we decide our guess x = xN ≈ x0 is ’good enough’. i.e. when some set
convergence condition is reached, either on the value of the function or on
the uncertainty in the position of the root. This idea of moving toward
some goal through successive iterations is a very common one in numerical
methods - essentially because it is very easy to code.
To start most root finding algorithms we must first bracket the root: if f (x)
is continuous and f (a) and f (b) have opposite signs then there must be at
least one root in the interval (a, b), and we say that the root is bracketed by
a and b (see Fig. 2).
f(x)
a
xo
b
x
Figure 2: Bracketing a root. The root at x0 is in the interval (a, b). The vertical dotted
line shows the new limit of the interval at (a + b)/2 which will be imposed at the next
iteration of the bisection method.
9
4.1
Bisection method
Here, we will investigate the bisection method. This is a simple and extremely robust method for finding roots in 1D. In fact, once a root is correctly bracketed, the bisection method cannot fail. It works like this: the
root is bracketed with a lower limit xl = a and an upper limit xu = b. We
know the root lies somewhere between these two bounds, so our initial guess
for the root, x0 , is x1 = (xl + xu )/2 with an error of ±(xl − xu )/2. At each
successive iteration we refine our guess for the root by reducing the size of
the interval in which we know the root must lie. We bisect the interval and
test the value of the function at (xu + xl )/2. If the function has the same
sign as the function at xl then the lower limit is updated and we know the
root now lies between (xu + xl )/2 and xu . If the function has the same sign
as the value of the function at the upper limit (this is the case in Fig. 2) then
the upper limit must be updated and we know that xl < x0 < (xu + xl )/2.
There are a few special cases where you may have to take care. The most
obvious is at a repeated root - or indeed any double root where, although
the interval (a, b) may contain a root, there is not necessarily a sign change
in f (x) between x = a and x = b. Also, if there are many roots between a
and b the bisection method will only find one of them and, interestingly, if
there is a singularity but no roots in the initial interval the bisection method
will converge to the point of the singularity.
The bisection method is usually quite good in 1D (given an appropriate
initial interval in which to search). However, in more than one dimension
things get much more complicated very quickly. The simplest algorithm
which can work is the Newton-Raphson method, where both the function
and its derivative at the initial guess for a root are used to generate the
next guess. There are also many other advanced methods. See ref. [1] and
references therein for more details.
4.1.1
Task: Code the algorithm
• Write the code to implement the bisection method given an initial
interval (a, b). You will need to loop over iterations, bisecting the
interval at each iteration until some convergence criteria is reached.
Think about how to implement this stopping condition. You will also
need to think about how to orient the search - how to update the
appropriate bound to the interval at each iteration depending on the
sign of the function at each of the bounds and at the midpoint.
• Test the code by solving x3 − 7x2 + 14x − 8 = 0 and comparing the
numerical with the analytical solution. Investigate the effect of chang10
ing the initial bounds a and b. What happens if these do not bracket
a root?
• The ground state energy, E, of an electron in a finite square well of
depth V0 is found by solving the transcendental equation
1
ka tan(ka) = (k02 a2 − k 2 a2 ) 2 ,
(8)
where k 2 = 2mE/¯
h2 and k02 = 2mV0 /¯h2 . Use your code to find the
ground state energy in an InAs quantum well in GaAs with effective
mass 0.027, well width 2a = 0.6 nm, and V0 = 0.5 eV. Check your
solution graphically. There is a useful discussion on bracketing the
root in this case in ref. [2].
5
Numerical differentiation
It is common to have to differentiate a data set numerically. If we have a
set of tabulated data fi on a uniform grid xi = ih, where h is the uniform
step size, then an obvious first guess for the numerical derivative is
df
∆fi
fi+1 − fi
xi ≈
=
.
dx
∆xi
h
(9)
This is a forward difference and, although it is a reasonable estimate for the
derivative, it is only accurate to 0(hf ), so the error will reduce very slowly
(linearly) with the step size, h. This is not very satisfactory, especially if
we cannot control the step size in the data - for example if our data set
is pre-generated from some experiment. However, we can do better than
this by thinking about the Taylor series again. Near to xi we can expand
f (xi + h) and f (xi − h) as Taylor series,
f (xi + h) = f (xi ) + h
f (xi − h) = f (xi ) − h
df
dx
df
dx
+
xi
+
xi
h2 d2 f
2 dx2
h2 d2 f
2 dx2
+
xi
−
xi
h3 d3 f
6 dx3
xi
h3 d3 f
6 dx3
xi
+ ···,
+ ···,
(10)
where f (xi +h) = fi+1 and f (xi −h) = fi−1 . Clearly, if we take the difference
between fi+1 and fi−1 the second order term vanishes and we can write a
new (centred difference) approximation to the first derivative,
df
dx
=
xi
fi+1 − fi−1
+ 0(h2 f (3) ).
2h
11
(11)
5.0.2
Task: calculate the first derivative
• ψ(r) = exp(−r/a0 )/ πa30 is the wavefunction of the Hydrogen ground
state, where a0 is the Bohr radius. Write a C-function, pr, to calculate
the Hydrogen 1s probability density (P (r) = 4πr2 ψ 2 ). Calculate P (r)
on a uniform grid and plot it.
• Write the code to calculate the first derivative using the centered difference formula and your probability density function from the previous
task. You will need to supply a step size h, and make two calls to pr.
Plot and examine the first derivative.
• Combine this code with your root finding code from section 4 to calculate the most probable value for the radius of an electron in a Hydrogen
1s orbital. Check that this agrees with the analytical value.
5.0.3
Task: calculate the second derivative
• Derive the classical 3 point formula for the second derivative by eliminating first and third order terms in Eqs. 10. Write some code to
calculate the second difference of P (r) using this formula and a function to evaluate P (r).
• Plot P (r) along with the first and second derivative and explain what
you see.
6
Multi-dimensional numerical integration
Many numerical problems are relatively easy in 1D but tend to get difficult
very quickly in more than one dimension. This is unfortunately the case with
numerical integration. There are two problems that we come up against.
The first and often more serious problem is that the limits of integration in
N dimensions can be a complicated. The second problem is that the number
of function evaluations needed to perform an N dimensional integral tends
to rise as the N th power. So if you need 1000 points in 1D, you will need
106 points in 2D and 1000N points in N -dimensions.
However, if the number of dimensions is small, the cost of evaluating our
function is cheap and, most importantly, the limits run along co-ordinate
axes (or are easily specified in closed form) it is easy to generalise the 1D
integration code in section 2 to deal with N dimensions. For more complicated situations there are many special methods that have been developed,
for example Monte Carlo integration.
12
6.1
2D integrals with the trapezium rule
Before we look at Monte-Carlo integration we will first generalise our trapezium rule integration code to perform a simple 2D integral. Imagine we want
to calculate the volume V under a surface g(x, y),
x2
y2
g(x, y)dydx.
V =
x1
(12)
y1
As before, we can calculate our function on a uniform grid. Then evaluating
y2
y1 g(x, y)dy for each of the x = xi points on our grid between x1 and
x2 is easy. For each separate value of xi we can calculate the area A(xi )
under the curve, g(xi , y), with our standard trapezium rule code. Fig. 3
shows a surface g(x, y) as a function of x and y. So, for example, the line
along x = x2 is essentially a plot of g(x2 , y) as a function of y and the area
under this line is simply A(x2 ). We could calculate and store each of the y
integrals at each xi point, so A(x) = yy12 g(x, y)dy. Then V = xx12 A(x)dx.
And, obviously, this integral can also be calculated using our 1D trapezium
code.
28
24
20
16
12
8
g(x,y)
20
A(x)
15
y2
x1
10
x2
y1
x1
x2
Figure 3: Left: surface g(x, y). For each fixed xi we can calculate A(xi ), the area
under the curve g(xi , y) between y1 and y2 . This is shown in the right hand curve:
y
A(x) = y 2 g(x, y)dx.
1
So to calculate the 2D integral we need to perform a 1D integral over y for
each required value of x on our grid, store the result as an array variable,
then perform another 1D integration over x. In fact, things are simpler than
this. We do not need to explicitly store A(x) at all, we just have to nest the
y integration loop inside the x integration loop.
If xi = ihx , 0 ≤ i < N , yj = jhy , 0 ≤ j < M and f (xi , yj ) = gi,j then, from
the trapezium rule,
V = hx
N −2
1
(A1 + AN −1 ) +
Ai ,
2
i=2
13
(13)
where
1
Ai = hy (gi,1 + gi,M −1 ) +
2
6.1.1
M −2
gi,j .
(14)
j=2
Task: Write the code to calculate V =
y 2 + y)dxdy
π π/2
y exp(−x2
0 1
−
• Modify your code to calculate V using Eqs. 13 and 14. First make
sure you have tested your code on a 2D function that you can integrate
analytically. Then calculate the integral above.
6.2
Monte Carlo integration
Unsurprisingly (given the gambling connotations) the ’Monte Carlo’ method
works with random numbers. If we randomly pick N points at position xi
within a multi-dimensional volume V , then the integral of f (xi ) over the
volume is given by
f2 − f
N
f dV = V f ± V
where
f =
1
N
2
1/2
,
(15)
N −1
f (xi ).
(16)
i=0
Monte Carlo methods are very useful for integrals with complicated
√ boundaries but, because the error in the integral only falls off like 1/ N , it can
be very difficult to obtain high accuracy.
So, how does it work? First, let us look at what happens in 1 dimension.
Eq. 15 becomes
b
b − a N −1
f (x)dx =
f (xi ),
(17)
N i=0
a
and you can see that this is very similar to the trapezium rule result from Eq.
4 without the end point corrections (on a uniform grid, h = (b−a)/(N −1)).
In the Monte Carlo algorithm we randomly select N points between a and
b, weight each point by the value of the function at that point, then sum
the weights to get the approximation to the integral.
The Monte Carlo algorithm comes into its own for higher dimensional integrals, especially those with complicated limits. Fig. 4 shows an example 2D
function g(x, y) which we would like to integrate over the region s. First we
14
1
7
6
5
4
3
2
1
0
Area, A
g(x,y)
0.5
1
s
-0.5
Region, s
0.5
0
0.5
0
-1
-0.5
0
0.5
1
0
Figure 4: Left: surface g(x, y). Right: region, s, over which we would like to integrate
the function.
pick N random points (xi , yi ) over the area A (in our example this is the
rectangle from −1 < x < 1 and 0 < y < 1). If the point is inside the region
s we weight it by the value of the function g(xi , yi ) at this point. If it is
outside the region s we set its weight to 0. Then our approximation to the
integral is just the sum of the weights multiplied by the area A and divided
by the number of points N .
This method can be explained with the following analogy. Imagine throwing
stones at random into a field of area A in which there is a pond (region s).
To find the area of the pond, simply compare the number of stones, p, that
fall into the pond with the total number of stones N that are thrown. The
area of the pond is then simply Ap/N (and calculating the area of the region
s is equivalent to integrating the function g(x, y) = 1 over this region).
So the key steps of a Monte Carlo integration are simple: 1. generate a
random number. 2. convert that to a position inside a given fixed area or
N -dimensional volume. 3. test if the position is inside the region s of the
integral. 4. weight the point appropriately. To generate a pseudo-random
number you will need to call the C-function rand() which will return an
integer between 0 and the system variable RAND MAX. The pseudo-random
number generator is often seeded with a call to srand(time(0)) and so you
will need to include the <time.h> header file in your code.
6.2.1
Task: Use the Monte Carlo method to calculate
r = x2 + y 2
r≤5 e
−(x2 +y 2 ) dxdy,
• As usual, break your code into steps and test each step independently.
Think about how to choose the area A to maximise the efficiency of
the code - obviously it must include all of s, but be as close to s as
possible so fewer points are wasted. Calculate the Monte Carlo error
15
and show that the numerical result converges to the expected result
as N is increased.
6.2.2
Task: a 3D integral
• This example is taken directly from numerical recipes. We wish to find
the mass of a component of complex shape: the component is a section
cut from a torus defined by the conditions z 2 + ( x2 + y 2 − 3)2 ≤ 1
m2 , x ≥ 1 m, and y ≥ −3 m, and the density is ρ(x, y, z) = (10 + x3/2 )
kg/m3 . Calculate the mass using the Monte Carlo algorithm.
Hint: First think about the extremes of the values of x, y and z that are allowed.
You should be able to work out the bounds on x, y and z and use these to set the
size of the Monte Carlo sampling volume.
7
7.1
Numerical solution of differential equations
Euler integration
The key step to solving a differential equation numerically is to discretise
the equation - to write it as a difference equation on a grid. As an example,
let us investigate the second order differential equation governing the motion
of a particle in 1 dimension,
d2 x
1
= F (v, x, t),
2
dt
m
(18)
where m is the mass of the particle and F (x, v, t) is the force acting on the
particle. We first write our second order differential equation as two coupled
first order differential equations. If v = dx/dt, then
dv
dt
dx
dt
=
1
F (v, x, t)
m
= v,
(19)
is exactly equivalent to Eq. 18. These coupled differential equations are
then easily discretised: to first order, we can use the forward differencing
scheme from section 5 to give,
1
F (vi , xi , ti )
m
= xi + ∆ t vi .
vi+1 = vi + ∆t
(20)
xi+1
(21)
16
This is the Euler integration method and, as we saw in section 5, its accuracy
is strongly dependent on the step size, ∆t . However it is conceptually simple,
and easy to program.
To turn Eqs. 20 and 21 into a numerical scheme we think of them as update
equations. In an initial value problem, we know x0 , v0 and F0 , the values of
the position, velocity and force at t = t0 . But, then, from Eqs. 20 and 21
we can calculate v1 and x1 at time t1 = t0 + ∆t . So, we increment the time
by ∆t and update the velocity and position. At the next time step, we then
know x1 , v1 and F1 so we can use the update equations to generate v2 and
x2 , and so on.
7.1.1
Task: code the Euler method and numerically solve the
equations for a harmonic oscillator
• For harmonic motion, F = −kx − r(v, x). Begin with an undamped
oscillator with r = 0, m = 1 kg, k = 2.5 N/m, and dt = 0.1 s. Start
the particle from x = 0 with an initial velocity and investigate the
motion over a few cycles of oscillation. Compare with the analytical
solution. What is going wrong? How small does dt have to be to give
reasonable agreement between the numerical and analytical solutions?
7.2
Runge-Kutta integration
The problem with the Euler method is that it is only accurate to first order
and if ∆t is large, the method is unstable. In each of the coupled difference
equations (Eq. 20 and Eq. 21), we have ignored terms proportional to
∆2t . If these are not negligible, our difference equations are not equivalent
to the second order differential equation (Eq. 18), and this means we are
getting the physics wrong. For example, in Eq. 21 we are missing a term
proportional to ∆2t d2 x/dt2 which is equivalent to adding an additional nonphysical acceleration to our particle. This sort of problem is particularly
significant in cases where the general solution contains both an exponentially
decaying and an exponentially growing part. In physical problems we usually
want the part of the solution that decays with time. But, any numerical error
will start to mix in a small proportion of the exponentially growing solution
and, after a long enough time, this erroneous part to the solution will come
to dominate our numerical result.
However, the good news is that we can easily do better than the Euler
method by using the centred difference approximation from section 5. Then,
17
our update equations become
vi+1 = vi−1 + 2∆t
xi+1
1
F (vi , xi , ti )
m
= xi−1 + 2∆t vi .
(22)
(23)
This is a second order scheme with error 0(∆3t ) called the midpoint or second
order Runge-Kutta method. In this scheme we calculate the position and
velocity at time steps 2∆t , and we use some additional information, the
position at velocity at an intermediate step ∆t , to improve the accuracy
of our update equations. So, how does this work numerically? We start
with the initial conditions, vi−1 = v0 and xi−1 = x0 at ti−1 = t0 . Then we
make an estimate of the position and velocity at the intermediate time step:
vi = vi−1 + ∆t Fi−1 /m and xi = xi−1 + ∆t vi−1 . Finally, these estimates are
used to generate the updated position and velocity at t0 + 2∆t using Eqs.
22, and 23. Because this method works on a time step of 2∆t , in text books
you will often see a slightly different notation: a full time step of ∆ = 2∆t
and an intermediate time step of ∆/2 = ∆t . It is also relatively easy to use
the Taylor series (Eq. 3) to generate higher order Runge-Kutta schemes and
fourth order Runge-Kutta is often used for physical problems.
7.2.1
Task: code the midpoint method and investigate the undamped oscillator in task 7.1.1
• Start with 2∆t = 0.1. How large can you make 2∆t before the results
start to become unphysical?
7.2.2
Task: investigate a damped driven oscillator
• Include some frictional force r = βv n in the equation of motion and
drive the oscillator with a forcing function A sin(ωt). Start the oscillator from rest away from x = 0 and investigate the transient and steady
state parts of the motion. Plot curves to demonstrate the key features
of the motion for different values of ω and β.
7.2.3
Task: Lissajous figures
• Plot the position against velocity for a damped driven oscillator. Investigate the motion for different values of β and A, and for different
initial conditions. Explain what you see.
18
8
Partial differential equations
One way to solve a partial differential equation numerically is to discretise
it and rewrite it as a finite difference equation. We can do this easily on
a regular grid using the Taylor expansion again. For example, take the
Laplace equation for the electric potential with no sources of charge,
∇2 v = 0,
(24)
∂2v
∂2v
+
= 0.
∂x2
dy 2
(25)
or, in 2 dimensions,
To discretise this equation on a uniform grid first Taylor expand vi,j =
v(x, y). If vi+1,j = v(x + h, y), vi−1,j = v(x − h, y), vi,j+1 = v(x, y + h), and
vi,j−1 = v(x, y − h), then
vi+1,j
= vi,j + h
∂v
h2 ∂ 2 v
h3 ∂ 3 v
+
+
+ ···,
∂x
2 ∂x2
6 ∂x3
(26)
vi−1,j
= vi,j − h
∂v
h2 ∂ 2 v
h3 ∂ 3 v
+
−
+ ···,
2
∂x
2 ∂x
6 ∂x3
(27)
vi,j+1 = vi,j + h
∂v h2 ∂ 2 v h3 ∂ 3 v
+
+
+ ···
∂y
2 ∂y 2
6 ∂y 3
(28)
vi,j−1 = vi,j − h
∂v h2 ∂ 2 v h3 ∂ 3 v
+
−
+ ···,
∂y
2 ∂y 2
6 ∂y 3
(29)
If we sum Eqs. 26, 27, 28 and 29 we find,
vi+1,j + vi−1,j + vi,j+1 + vi,j−1 = 4vi,j + h2
∂2v
∂2v
+
∂x2 ∂y 2
+ 0(h4 f (4) ), (30)
and, because ∇2 v = 0, we have
vi,j =
1
(vi+1,j + vi−1,j + vi,j+1 + vi,j−1 ) .
4
(31)
This is the finite difference version of the Laplace equation (Eq. 25) on a
uniform grid with hx = hy . You should also be able to derive the equivalent
finite difference equation if hx = hy .
We can solve this equation using Jacobi’s method. Although this is slow
and has been superseded by many other faster methods it is a good place
to start. In Jacobi’s method we start our solution off from some arbitrary
initial state and let it relax toward the actual solution iteratively.
19
First define a uniform grid, xi = ih, yj = jh, with i = 0 · · · N − 1, and
j = 0 · · · N − 1. Fix the values of the potential at the edge of the grid
according to the physical boundary conditions of the problem then relax
the solution over a number of iterations. At each successive iteration the
potential at grid point i, j is set to be equal to to the average of the potential
on the surrounding grid points at the previous iteration. So, for iteration
n + 1,
1 n
n+1
n
n
n
vi,j
=
v
+ vi−1,j
+ vi,j+1
+ vi,j−1
.
(32)
4 i+1,j
As n → ∞ the changes to vi,j become negligible and vi,j converges to the
true solution of the finite difference Laplace equation, Eq. 31.
A small tweak to Jacobi’s method gives the Gauss-Sidel method which is
even easier to code. In Gauss-Sidel we use the updated values of the potential
on the right hand side of Eq. 32 as soon as they become available. This
avoids the need to store the values of the potential at both the n and the
n + 1 iterations.
So, how would we go about following this procedure computationally? First
define the grid as a 2D array (double v[N][N]) then set the boundary
elements of the array accordingly. Next, loop over iterations, n, until some
stopping criteria is reached (you must decide when the solution is ’good
enough’). For each iteration, loop over all the i and j elements of the 2D
array updating v[i][j] according to Eq. 31.
In physical problems, there are two common types of boundary condition.
In the first type, or Dirichlet boundary condition, the values of the solution
vi,j are fixed at the boundaries. This is the type of boundary condition
we will deal with here. Alternatively, when Neumann boundary conditions
are imposed, the values of the derivative of the solution are fixed at each
boundary.
L
L
v=0
2
L
v=2
v=0
v=0
1.5
1
0.5
v=sin(πx/L)
0
0
0
L
0
0
L
0
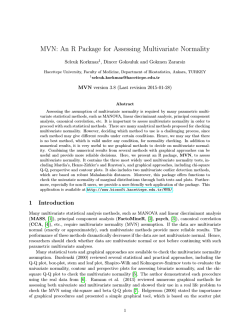
0
L
Figure 5: Solution to Laplace equation in 2D for an example system. Left: arrangement
of gates. Centre: Grey-scale map of the calculated potential v(x, y) on a 100×100 grid.
Right: equipotential lines.
20
8.0.4
Task: write a Gauss-Sidel code to solve the Laplace equation in 2D with Dirichlet boundary conditions
• Think about the stopping criterion and how to decide when your solution is acceptable.
8.0.5
Task: calculate the potential in a 2D gated system
• Use the following boundary conditions: v(0, y) = 0, v(L, y) = 0,
v(x, L) = 0, v(x, 0) = 2 sin(πx/L): the system is grounded on 3 edges
and the potential on the bottom gate is set to vary sinusoidally. Calculate the potential on a few different N × N grids (eq. 10 × 10, 50 × 50,
and 100 × 100). Demonstrate that the number of iterations needed to
converge the solution varies as N 2 . (This slow convergence is one of
the reasons that Gauss-Sidel is no longer used for realistic problems, although a minor change - over relaxation with Chebyshev acceleration
- makes the Gauss-Sidel scheme competitive for small scale calculations). Examine your converged 2D solutions, v(x, y), with gnuplot.
• Solve the Laplace equation analytically for the above case. Compare
your numerical and analytical solutions. How would you modify your
code to improve the agreement?
• Investigate a more complex geometry of gates. Produce some figures
to show the key features of the potential. An example with a square
terminal of fixed potential in the middle of the system is shown in Fig.
5.
A
Plotting data with gnuplot
Your code will be used to generate data and you will often need to analyse
this. For example, you may wish to calculate, output and plot a graph of
some function φ(x) as a function of x. There are many ways to accomplish
this (for example by using R or IDL) but one relatively easy way is to use
a plotting package called gnuplot. This is widely used free software that is
available for both Windows and Linux.
A.1
Simple plots
You will need to format the data you wish to plot as an ascii or text file
containing columns of numbers separated by tabs (\t) or by spaces. Once
21
in ascii format your data can be plotted by a whole range of packages, for
example you could import your data into Microsoft Origin or even Excel on
CFS (although Excel plots look very poor in publications). On the University’s spectre system gnuplot will do the job of plotting your data. gnuplot
can be used to generate sophisticated publication quality graphs, but its
main advantage is that it makes it extremely easy to produce quick and
simple plots which will help you to analyse data as you go along.
To run gnuplot, open a terminal window, change directory to the place where
your data files are stored, then simply type ’gnuplot’ at the command line.
This will give you the gnuplot command line prompt (gnuplot> ). Now,
imagine that your ascii data file (data.txt) contains three columns, first x,
then f (x), then φ(x). To plot φ(x) against x you simply need to type
gnuplot> plot ’data.txt’ using 1:3 with line
This plots the data in file ’data.txt’ using columns 1 and 3 with a line.
gnuplot understands some abreviations so, for example ’with line’ can be
replaced by ’w l’ and ’using’ by ’us’. To plot with points just use ’w p’
instead of ’w l’ and to plot column 1 against column 2 simply replace ’1:3’
with ’1:2’. To overlay two curves on top of each other the syntax is also
simple. For example
gnuplot> plot ’data.txt’ us 1:2 w l, ’data.txt’ us 1:3 w l
plots two lines on the same graph, f (x) (column 2) against x (column 1)
and φ(x) (column 3) against x.
gnuplot can also perform operations on the data in the columns, for example
gnuplot> plot ’data.txt’ us (\$1*\$1):(\$2/3.0) w l
would plot f (x)/3 against x2 . You might also want to change the x range
(xra) or y range (yra) of a plot. The syntax is simple, for example,
set xra[0:10]
will set the x range of the plot from 0 to 10.
gnuplot can perform many more sophisticated operations like curve fitting
or surface and contour plots. It is fairly intuitive software and it comes with
a comprehensive help. To access the help type ’ ?’ at the command prompt
or look on-line for one of the many gnuplot tutorials or reference manuals.
22
A.2
Functions
gnuplot will generate and plot standard and user defined functions. This
can be very useful if you want to compare your data to a function, or if you
just wish to quickly look at the behaviour of a given function. The syntax
to define a function is simple. For example,
gnuplot> f(x)=sin(x)
gnuplot> g(x,y)=exp(0.1*(x**2+y**2))
f (x) and g(x, y) can then be plotted in 1D or 2D,
gnuplot> plot f(x)
gnuplot> splot g(x,y)
To change the number of points gnuplot uses to plot a function in 1D you
will need to change the ’samples’ variable. For example ’set samples 50’ will
tell gnuplot to use 50 points in the x direction. The splot command above is
short for ’surface plot’ and is a nice way to represent 2D data. You can use a
variety of styles, for example the ’w pm3d’ style gives filled shaded surfaces
and the ’set view map’ will give a top down view that is often useful. To
change the number of points in the y direction when plotting a function in
2D you will need to set the ’isosamples’ variable.
gnuplot> set samples 50 ; set isosamples 50
gnuplot> set view map; set pm3d
gnuplot> splot g(x,y) w pm3d
A.3
Plotting 2D data
As well as plotting surfaces for functions, gnuplot can also be used to visualise a 2D data set. For surface plots, gnuplot expects at least 3 columns.
For example, a column containing x, a column containing y, and a third
column containing the result, g(x, y), for that particular x and y. The best
way to organise the data is in blocks: the first block should contain a specific
value of x and all the values of y and g(x, y) at that particular value of x.
Next, gnuplot will expect a blank line to separate blocks. Then, the next
block should contain the next value of x and all the values of y and g(x, y)
in the data set at that particular x. And so on. For example, a 2D data set
with g(x, y) = exp(xy), 0 ≤ x < 2 and 0 ≤ y < 3 with just 2 points in x and
3 points in y would look like:
0.000000e+00
0.000000e+00
0.000000e+00
1.000000e+00
23
1.000000e+00
1.000000e+00
0.000000e+00
2.000000e+00
1.000000e+00
1.000000e+00
1.000000e+00
1.000000e+00
0.000000e+00
1.000000e+00
2.000000e+00
1.000000e+00
2.718282e+00
7.389056e+00
When the data is in this format all of the various gnuplot surface options
like pm3d can be used.
A.4
gnuplot printing
By default, gnuplot is set to plot to the ’X11 terminal’, or maybe the ’wxt’
or ’qt’ terminals (all refer to the screen). You can change the terminal to
many different types (type ’ ? set term’ to get a complete list). Perhaps the
most useful types for generating hard copies are the postscript or png types.
Postscript is used by most journals for publication quality plots, but png
might also be useful for inserting into PowerPoint.
To create a postscript file of a plot of column 1 vs 3 in ’data.txt’, type
gnuplot> set term post
gnuplot> set out ’plot.ps’
gnuplot> plot ’data.txt’ us 1:3 w l
This will write the postscript output to a file called ’plot.ps’. After you type
’set term post’ gnuplot will display a list of the default postscript options.
You can change these. For example, type ’set term post color’ to generate
colour output rather than the default monochrome. Try ’help set term post’
for information on the different postscript options that are available.
On spectre you can view postscript files with a viewer called ’gv’, or with the
General Image Manipulation Programme (GIMP). To view the file plot.ps
simply type ’gv plot.ps’ at the command line.
A.4.1
Conversion to pdf
You can easily convert postscript output to other formats. For example, to
convert plot.ps to a pdf file simply type ’epstopdf plot.ps’ at the command
line.
24
A.4.2
Publication quality plots
In gnuplot there are many different options available for enhancing the look
and style of your plots.
Try googling, or searching the gnuplot help for information on axis labels,
the key and plot styles.
References
[1] Numerical Recipes in C, W. H. Press, S. A. Teukolsky, W. T. Vetterling
and B. P. Flannery, 2nd. Ed. Cambridge University Press.
[2] Quantum Mechanics A. I. M. Rae, 5th. Ed., Taylor & Francis.
25


© Copyright 2026