
Urbas Grupo Financiero SA UBS
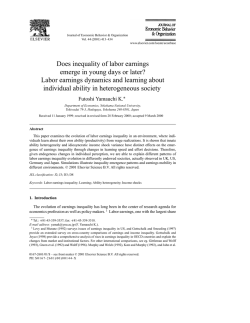
Page 1 of 1
Quantitative Equity Report | Release Date: 05 February 2015 | Reporting Currency: EUR | Trading Currency: EUR
Urbas Grupo Financiero SA UBS
Last Close
Quantitative Fair Value Estimate
Market Cap (Mil)
Sector
Industry
0.02
0.03
35.3
u Real Estate
Real Estate Services
Urbas Grupo Financiero S.A is a Spain-based company mainly
engaged in the real estate sector. Its activities include the
acquisition, development and sale of land and properties,
mainly in the regions of Guadalajara and Almeria.
Quantitative Scores
Country of Domicile
ESP Spain
Price Versus Quantitative Fair Value
2011
2012
2013
2014
2015
2016
Sales/Share
Forecast Range
Forcasted Price
Dividend
Split
10
8
Scores
Momentum:
—
Standard Deviation: 128.63
All Rel Sector Rel Country
Quantitative Moat
None
Valuation
Undervalued
Quantitative Uncertainty Extreme
Financial Health
Moderate
53
77
20
11
29
91
8
5
6
41
92
8
6
Quantitative Fair Value Estimate
4
Total Return
0.01
52-Wk
0.04
0.01
5-Yr
0.15
2
UBS
ESP
u
Undervalued
Fairly Valued
Overvalued
Valuation
Sector
Median
Country
Median
—
—
—
2.3
2.3
—
1.5
2.8
0.95
14.5
19.2
15.4
16.9
3.29
1.1
4.3
0.93
18.4
13.1
10.5
16.7
2.77
1.4
1.2
Current 5-Yr Avg
Sector
Median
Country
Median
8.4
3.6
1,659.2
8.9
2.3
268.7
Current 5-Yr Avg
Price/Quant Fair Value
Price/Earnings
Forward P/E
Price/Cash Flow
Price/Free Cash Flow
Dividend Yield %
Price/Book
Price/Sales
0.66
—
—
2.3
2.3
—
—
7.2
Profitability
Return on Equity %
Return on Assets %
Revenue/Employee (K)
—
-25.6
433.0
—
-21.3
—
Score
100
Quantitative Moat
80
60
40
20
0
2008
2009
2010
2011
2012
2013
2014
Financial Health
Current 5-Yr Avg
Distance to Default
Solvency Score
Assets/Equity
Long-Term Debt/Equity
2015
Sector
Median
Country
Median
0.6
556.7
2.1
0.5
0.6
807.0
2.6
0.4
0.2
—
-2.3
0.0
—
—
8.6
0.1
1-Year
3-Year
5-Year
10-Year
-11.9
—
—
—
63.3
-37.0
-29.9
—
—
—
-19.4
-3.6
-32.4
—
—
—
-34.2
-34.2
—
—
—
—
—
-32.0
Growth Per Share
Revenue %
Operating Income %
Earnings %
Dividends %
Book Value %
Stock Total Return %
-58.9
-44.8
-43.5
-60.9
92.3
76.9
-40.0
-36.3
13.3
11.2
—
-0.4
2.3
—
-0.3
1.4
—
-1.4
6.3
—
-1.3
6.0
—
-1.4
7.2
Total Return %
+/– Market (Morningstar World
Index)
Dividend Yield %
Price/Earnings
Price/Revenue
Undervalued
Fairly Valued
Overvalued
Monthly Volume (Million Shares)
Liquidity: High
248
Financials (Fiscal Year in K)
Revenue
% Change
2009
2010
2011
2012
2013
TTM
51,302
6.6
19,726
-61.5
5,514
-72.0
7,717
40.0
6,796
-11.9
5,196
-23.5
-22,615
—
-33,878
-42,324
—
-45,017
-18,067
—
-29,916
-30,386
—
-38,563
-27,128
—
-31,396
-21,986
—
-24,397
Operating Income
% Change
Net Income
48,869
-9
48,860
95.2
6,753
-398
6,355
32.2
2,301
-15
2,286
41.5
3,822
—
3,822
49.5
14,478
—
14,478
213.0
16,337
—
16,338
314.4
Operating Cash Flow
Capital Spending
Free Cash Flow
% Sales
-0.15
—
0.22
-0.12
—
0.01
-0.05
—
0.00
-0.05
—
0.00
-0.02
—
0.01
-0.01
—
0.01
EPS
% Change
Free Cash Flow/Share
—
0.14
859
—
0.02
859
—
0.03
1,719
—
-0.02
2,074
—
-0.02
—
—
-0.02
2,074
Dividends/Share
Book Value/Share
Shares Outstanding (Mil)
-69.2
-12.6
-66.0
0.19
4.6
-159.3
-19.7
-228.2
0.09
37.8
-206.5
-15.8
-542.6
0.03
6.7
-1,029.4
-28.2
-499.7
0.06
—
—
-30.2
-462.0
0.07
—
—
-25.6
-469.5
0.05
—
Profitability
Return on Equity %
Return on Assets %
Net Margin %
Asset Turnover
Financial Leverage
38.3
-44.1
4,138
37.9
-214.6
3,043
69.2
-327.7
1,733
29.9
-393.8
29
-56.3
-399.2
218
-100.9
-423.1
2,247
Gross Margin %
Operating Margin %
Long-Term Debt
50,554
24.4
5,963
12.0
23,017
5.3
-15,525
9.2
-38,484
8.4
-42,673
6.6
Semi-Annual Revenue & EPS
Revenue (K)
Mar
Jun
2014
— 2,990.0
2013
— 4,590.0
2012
— 6,943.0
2011
— 1,885.0
Earnings Per Share
2014
—
0.00
2013
—
-0.01
2012
—
-0.01
2011
—
-0.02
Total Equity
Fixed Asset Turns
Revenue Growth Year On Year %
Sep
—
—
—
—
Dec
—
2,206.0
7,717.0
3,366.0
Total
—
6,796.0
7,717.0
5,514.0
—
—
—
—
—
-0.01
-0.03
-0.03
—
-0.02
-0.05
-0.05
268.3
129.3
-12.8
-72.8
2010
-83.4
2011
-33.9
-59.9
2012
©2015 Morningstar. All Rights Reserved. Unless otherwise provided in a separate agreement, you may use this report only in the country in which its original distributor is based. Data as originally reported. The information
contained herein is not represented or warranted to be accurate, correct, complete, or timely. This report is for information purposes only, and should not be considered a solicitation to buy or sell any security. Redistribution
is prohibited without written permission. To order reprints, call +1 312-696-6100. To license the research, call +1 312-696-6869.
2013
-71.4
-34.9
2014
®
ß


© Copyright 2026