
Evaluation of air pollution tolerance indices of four ornamental
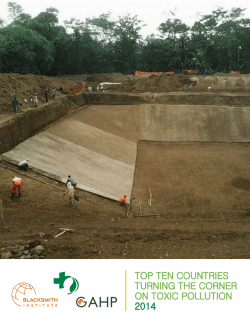
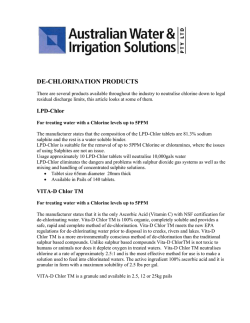
International Journal of Environmental Monitoring and Analysis
2015; 3(1): 22-27
Published online January 30, 2015 (http://www.sciencepublishinggroup.com/j/ijema)
doi: 10.11648/j.ijema.20150301.14
ISSN: 2328-7659 (Print); ISSN: 2328-7667 (Online)
Evaluation of air pollution tolerance indices of four
ornamental plants arranged along roadsides in Abidjan
(Côte d'Ivoire)
Zamblé Fidèle Tra Bi1, Djédoux Maxime Angaman2, *, Yao Sadaiou Sabas Barima3,
Bini Kouamé Dongui3
1
UFR Sciences et Gestion de l'Environnement, Université Nangui Abrogoua, Abidjan, Côte d'Ivoire
UFR Agroforesterie, Université Jean Lorougnon Guédé, Daloa, Côte d'Ivoire
3
UFR Environnement, Université Jean Lorougnon Guédé, Daloa, Côte d'Ivoire
2
Email address:
[email protected] (D. M. Angaman)
To cite this article:
Zamblé Fidèle Tra Bi, Djédoux Maxime Angaman, Yao Sadaiou Sabas Barima, Bini Kouamé Dongui. Evaluation of Air Pollution
Tolerance Indices of Four Ornamental Plants Arranged Along Roadsides in Abidjan (Côte d'Ivoire). International Journal of
Environmental Monitoring and Analysis. Vol. 3, No. 1, 2015, pp. 22-27. doi: 10.11648/j.ijema.20150301.14
Abstract: The development of urbanization and industrialization contributes to ambient air pollution of the city of Abidjan.
Air pollution can affect plants morphology and physiology. Plants can absorb gaseous and particulates pollutants through
leaves, they tend to show some symptoms according to their level of sensitivity after exposure to the air pollution. In order to
evaluate the susceptibility level of plants to air pollutants, four biochemical and physiological parameters, namely; ascorbic
acid, chlorophyll, relative water content and leaf extract pH were determined and computed together in a formulation of air
pollution tolerance indices (APTI) of Ficus benjamina, Jatropha integerrima, Cassia surattensis and Barleria prionitis
arranged along main roads (MR) as well as in parks (P) as control in Abidjan. APTI values for overall species are ranged
between 9.78 to 17.15 in P and from 9.76 to 16.91 in MR. The highest APTI is observed in Ficus benjamina and lowest in
Cassia surattensis. Ficus benjamina was categorized as intermediate tolerant specie; and Jatropha integerrima, Barleria
prionitis were categorized as intermediate sensitive species contrary to Cassia surattensis which was sensitive specie. Thus,
tropical urban air quality evaluation is possible by using plants APTI.
Keywords: Air Pollution, Air Pollution Tolerance Index, Main Roads, Côte d'Ivoire
1. Introduction
The rapid urbanization and growing industrialization in
the world during the last decades led to increasing levels of
air pollution [1] dwindling urban air quality [2] .
Plants play an important role in monitoring and
maintaining the ecological balance by their involvement in
the cycling of nutrients and gases like carbon dioxide and
oxygen [3]. However, air pollutants like gases and
particulate matters cause environmental stress in plants
which can change their leaf structure and physiology [4,5,6].
Air pollutants can alter the leaf epidermis [7] and affect
stomatal conductance [8].
The physiological and biochemical responses of plants to
air pollution can be understood by analyzing the factors
determining resistance and susceptibility [9]. Plants
sensitivity and tolerance to air pollutants varie with change in
leaf extract pH, relative water content, ascorbic acid content
and total chlorophyll content [10]. Ascorbate was known as
an antioxidant molecule able to detoxify air pollutants [11]
and it is also able to control cell expansion and cell division
[12,13]. Chlorophyll is essential for the vital process of
photosynthesis in green plants. Changes in leaf chlorophyll
can serve as relative indicators of environmental quality [14].
The importance of pH in mediating physiological responses to
stress was another reason in including it in air pollution
tolerance index component [15].
Single parameter may not provide a clear explanation of
the pollution-inducted changes, [16] used these four
parameters for identifying tolerance levels of plant species
International Journal of Environmental Monitoring and Analysis 2015; 3(1): 22-27
like Artocarpus sp., Eucalyptus sp., Citrus lemon,
Azadirachta indica, Rosa indica, Aegle marmelos and
Mangifera indica. To the term of their works Mangifera
indica showed a tolerance to air pollution while Artocarpus
sp was identified as a sensitive specie. Sensitive plant
species are suggested as bio-indicators [17].
Based on plant susceptibility in atmospheric pollution
context, this study is based on the hypothesis according to
which the physiological and biochemical parameters of the
leaves of Ficus benjamina, Jatropha integerrima, Cassia
surattensis and Barleria prionitis can be used for
biomonitoring of air quality. To test this hypothesis, this
study has for objective to determine tolerance or sensitivity
of four plants species quoted above in urban habitats with a
contrasting environmental quality. We will oppose main
roads with high traffic activity (considered like polluted sites)
to the parks (considered like less polluted sites). This typical
classification has already been achieved by [2,1].
23
two replicates). The distance between two pots was 1 m and
between two replicates in the same rows was 1 m.
2.4. Leaf Sampling
The mature leave samples were collected in July 2013 at
the end of the long rainy season during 2 days. Samples were
collected in early morning and brought to laboratory in
polythene bag kept in the liquid nitrogen box. In the
laboratory, samples were preserved in a refrigerator for
further biochemical analyses. The leaves were carried out
from a height of 1 to 2 m from the ground level.
2.5. Relative Water Content (RWC)
With the method as described by [18], leaf relative water
content was determined and calculated with the formula:
RWC = [ (FW ̶ DW / TW ̶ DW) ] x 100
(1)
FW = fresh weight,
2. Materials and Methods
DW = dry weight and
2.1. Study Area
TW = turgid weight.
The city of Abidjan – the economic capital of Ivory Coast
– was selected as study. Abidjan is situated on the south-east
of the country in the Gulf of Guinea (5°00’- 5°30 N, 3°50’4°10’W). The city has a tropical climate with a long rainy
season from May through July, a small rainy season
(September-November) and two dry seasons in between.
The city has main industries of the Ivory Coast and an
automobile park constituted in majority of secondhand
vehicles. Its firms are specialized in various domains of
which the oil products and its derivatives, textile and the
agroalimentary. Traffic density and industrial smokestacks
could be potential sources of pollution.
The city of Abidjan also contains several parks of which a
national park, a botanical garden and a floristic center. In
these green areas, the human influence is relatively weak
and activities of pollution are most controlled relatively to
the industrial areas and road traffic.
Fresh weight was obtained by weighing fresh leaves. The
leaves were then immersed in water overnight, blotted dry
and weighed to get turgid weight. Now the leaves were dried
in an oven at 70˚C and reweighed to obtain dry weight.
2.6. Total Chlorophyll Content (TCH)
This was done according to the method described by [19].
3 g of fresh leaves were blended and then extracted with 10
ml of 80% acetone and left for 15 min. The liquid portion
was decanted into another tube and centrifuged at 2500 rpm
for 3 min. The supernatant was then collected and the
absorbance was then taken at 646.6 nm and 663.6 nm using a
spectrophotometer. Calculations were made using the
formula below:
Chlorophyll a (mg/g) = 12.25 (A663.6) – 2.55 (A646.6)
Chlorophyll b (mg/g) = 20.31 (A646.6) – 4.91 (A663.6)
2.2. Preparation of Experimental Plant Samples
We used four plant species which were usually used as
ornamental and roadside plants, Ficus benjamina, Jatropha
integerrima, Cassia surattensis and Barleria prionitis. All
tree species were obtained and grown in a garden of the city.
All plants were grown in 30 cm diameter, 27 cm height
plastic pots. The Medium was a mixture of compost and soil.
The plants were grown for three months until reaching
140-180 cm.
2.3. Experimental Set Up
The experimental pots were placed in the vicinity of main
roads (4 sites) of Abidjan highways and in parks (2 sites)
during three months. Within main roads the pots were
arranged in three rows separated about two meters between
the rows. Each row was consisted of height pots (four pots in
TCH (mg/g) = 17.76 (A646.6) + 7.34 (A663.6)
(2)
2.7. Ascorbic Acid Content (AA)
Ascorbic acid content of the samples were determined by
using tritimetric method described by [20]. 5 g of the sample
was weighed into an extraction tube and 100 ml of
EDTA/TCA (2:1, v/v) were added. The homogenate was
shaken during 30 min and centrifuged at 3000 rpm for 20
min. The supernatant was transferred into a flask and 20 ml
was pipetted into a volumetric flask and 1% starch indicator
was added and titrated with 20% CuSO4.
2.8. Leaf Extract pH
For pH estimation 5g of the fresh leaves was
homogenized in 10 ml deionised water. The extract was
24
Zamblé Fidèle Tra Bi et al.: Evaluation of Air Pollution Tolerance Indices of Four Ornamental Plants
Arranged Along Roadsides in Abidjan (Côte d'Ivoire)
filtered and the pH was determined after calibrating pH
meter with buffer solution of pH 4 and pH 9 [21].
2.9. Air Pollution Tolerance Index (APTI) Determination
The air pollution tolerance indices were determined
following the method of [22]. The formula of APTI is given
as
APTI =[A(T+P)+R]/10
(3)
A = Ascorbic acid content (mg/g),
R = relative water content of leaf (%).
On the basis of APTI values, plants were categorized into
three groups [22].
i) Sensitive species: APTI <10 ; ii) Intermediate species:
APTI among 10-16 ; iii) Tolerant species: APTI >17
2.10. Statistical Analysis
We used STATISTICA 7.1 software, to make correlation
between biochemical parameters and also with APTI values,
and find linear regression.
T = total chlorophyll content (mg/g),
3. Results and Discussion
P = pH of leaf extract and
Table 1. Means of relative water content (RWC), leaf extract pH, total chlorophyll (TCH) and acid ascorbic (AA) of four plant species in two land uses
Land use classes
RWC (%)
pH
TCH (mg/g)
AA (mg/g)
Barleria prionitis
P (control) MR
70
77.9
8.05
7.37
1.03
0.67
4.8
6.4
Cassia surattensis
P (control)
MR
63.61
66.99
5.49
5.33
1.61
0.8
5
4.8
The air pollution tolerance indices (APTI) were
determined for 4 plant species (Ficus benjamina, Jatropha
integerrima, Cassia surattensis and Barleria prionitis) in 2
land use classes (parks and main roads). All biochemical
parameters analyzed for the APTI played an important role
to determine species tolerance or sensitivity to the
atmospheric stress.
According to table 1, the average leaf relative water
content (RWC) varied from 63.61 % to 90 % in P and from
66.99 % to 80.09 % in main roads (MR). In polluted sites
(MR), the RWC values were the highest in F. benjamina
and the lowest in C.surattensis. Reduction in relative water
content of plant species is due to impact of pollutants on
transpiration rate in leaves [23]. It has been reported that air
pollutants increase cell permeability [24], which cause loss
of water and dissolved nutrients, resulting in early
senescence of leaves [25]. According to [26], RWC ranged
between 58 % to 73 % in intermediately tolerant species and
51.3 % to 84 % in sensitive plant species.
The pH of leaf extract, oscillated between 5.33 (C.
surattensis) to 7.53 (F. benjamina) at polluted sites and from
5.49 (C. surattensis) to 8.05 (B. prionitis) in less polluted
sites (P). Thus [27], reported that in the presence of an
acidic pollutant, the leaf pH is lowered and the decline is
greater in sensitive than that in tolerant plant. High pH may
increase the efficiency of conversion from hexose sugar to
ascorbic acid, a natural antioxidant [3]. The pH ranged
between 4.4 and 8.8 lies in both intermediately tolerant and
sensitive plant species [26].
Total chlorophyll content ranged from 0.8 mg/g (C.
surattensis) to 1.04 mg/g (J. integerrima) in MR and from
1.03 mg/g (B. prionitis) to 1.61 mg/g (C. surattensis) in P. A
study conducted by [28] suggested that the chlorophyll level
in plants decreases under pollution stress. According to [26],
Jatroffa integerrina
P (control)
MR
77.65
70.2
7.21
6.52
1.07
1.04
6.8
8.33
Ficus benjamina
P (control)
MR
90
80.09
7.79
7.53
1.47
0.91
8.8
10.56
the plants having Chlorophyll content between 4 to 16 mg/g
are categorized as intermediately tolerant plant species.
Ascorbic acid content of species varied between 4.8 to
10.56 mg/g in MR and between 4.8 to 8.8 mg/g in P.
Ascorbic acid content in polluted area is highest in F.
benjamina and lowest in B. prionitis.
A great correlation between ascorbic acid content and
resistance to pollution exist in plants [32]. Resistant plants
contain high amount of ascorbic acid, while sensitive plants
possess a low level.
The ascorbic acid is natural detoxicant, which may
prevent the damaging effect of air pollutants in plant tissues
[29] and high amount of this substance favors pollution
tolerance in plants [30,31]. Level of this acid declines on
pollutant exposure [30]. The ascorbic acid content ranged
between 7.52 to 11.05 mg/g in intermediately tolerant
species and 1.61 to 8.23 mg/g among the sensitive plant
species [26] .
Figure 1. Comparison of air pollution tolerance Index (APTI) of four plants
in land use classes.
International Journal of Environmental Monitoring and Analysis 2015; 3(1): 22-27
The APTI values (Fig.1) obtained for different plants
ranges from 9.76 to 17.15 at Polluted sites and oscillate from
9.78 to 16.91 in unpolluted sites. Air pollution tolerance
index values were found to be greater in Ficus benjamina
and least in Cassia surattensis.
The correlation matrix given in table 2 shows the
association of the four biochemical parameters among
themselves and also with the dependent parameter APTI
whereas the figure 2 shows the linear regression plots
individual variables with APTI. It is observed that a high
positive correlation exists between APTI and relative water
25
content (r = 0.81 ; p < 0.05) as well as ascorbic acid content
(r = 0.92 ; p < 0.01).
Correlations between APTI and pH (r = 0.67 ; p > 0.05) as
total chlorophyll content (r = 0.35 ; p > 0.05) were not
significant. Strong correlation (r = 0.79 ; p < 0.05) is
observed between relative water content and ascorbic acid
content contrary to other parameters. The results show that
the ascorbic acid content and the relative water content are
the most significant and determinant factors of the leaves to
the tolerance of the different species.
Table 2. Correlation matrix of biochemical variables and APTI of analyzed samples
RWC
1
RWC
Chlorophyll
pH
Ascorbic acid
APTI
Chlorophyll
-0.33
1
pH
0.51
-0.64
1
Ascorbic acid
0.79*
-0.33
0.43
1
APTI
0.81*
0.35
0.67
0.92**
1
*: Significantly different at p < 0.05. **: Significantly different at p < 0.01.
Figure 2. Correlation between biochemical parameters(ascorbic acid, chlorophyll, pH, relative water content) and APTI
4. Conclusions
The present study allowed to estimate air quality of the
city of Abidjan from biochemical parameters (chlorophyll,
ascorbic acid, pH and relative content in water) measured in
four plant species. All parameters allowed to assess plants
physiology response to atmospheric pollution. Their
combination permitted to determine the APTI of the
different plants studied and reveal the intermediate tolerance
of Ficus benjamina, the intermediate sensitivity of Jatropha
integerrima and Barleria prionitis and the sensitivity of
Cassia surattensis to atmospheric pollution. Besides the
positive correlation between ascorbic acid content, relative
26
Zamblé Fidèle Tra Bi et al.: Evaluation of Air Pollution Tolerance Indices of Four Ornamental Plants
Arranged Along Roadsides in Abidjan (Côte d'Ivoire)
water content and APTI proved to be significant showing
their importance in plants in stress environment.
This study showed that it is possible to achieve a
bioindication of air quality from biochemical parameters of
leaves in African tropical environment.
Acknowledgements
This work was support by grants of International
Foundation for Science (IFS) and Ivorian institution
“Programme d’Appui Stratégique à la Recherche
Scientifique” (PASRES) to the second author. The third
author is a beneficiary of a mobility grant from the Belgian
Federal Science Policy Office (BELSPO) co-funded by the
Marie Curie Actions from the European Commission. We
also thanks the city council of “District Autonome
d'Abidjan” for their assistance in achieving field data.
References
[1]
[2]
F. Kardel, K. Wuyts, M. Babanezhad, U. W. A Vitharana, T.
Wuytack, G. Potters and R. Samson, “Assessing urban habitat
quality based on specific leaf area and stomatal
characteristics of Plantago lanceolata L”. Environmental
Pollution, 2010, v. 158, p.788-794.
B. L. W. K. Balasooriya, R. Samson, F. Mbikwa, W.A.U.
Vitharana, P. Boeckx and M. Van Meirvenne,
“Bio-monitoring of urban habitat quality by anatomical and
chemical leaf characteristics”. Environmental and
Experimental Botany, 2009, v. 65, p. 386-394.
[3]
F.J. Escobedo, J.E. Wagner and D.J. Nowak, “Analyzing the
cost effectiveness of Santiago, Chile’s policy of using urban
forests to improve air quality”. 2008, Journal of
Environmental Management, v. 86, p. 148-157.
[4]
M. Rajput and M. Agrawal, “Bio-monitoring of air pollution
in a seasonally dry tropical suburban area using wheat
transplants”. Environmental Monitoring and Assessment,
2005, v. 101, p. 39-53.
[5]
G. Klump, C. M. Furlan and M. Domingos, “Response of
stress indicators and growth parameters of tibouchina pulchra
logn. Exposed to air and soil pollution near the industrial
complex of cubatao, Brazil”. Sci. Total Environ, 2000, v. 246,
p. 79-91.
[6]
[7]
[8]
Y. S. S. Barima, D. M. Angaman, K. P. N'Gouran, N.A. Koffi,
F. Kardel, C. De Cannière and R. Samson, “Assessing
atmospheric particulate matter distribution based on
saturation isothermal remanent magnetization of herbaceous
and tree leaves in a tropical urban environment”. Science of
the Total Environment, 2014, v. 471, p. 975-982.
I. Gostin, “Air pollution effects on the leaf structure of some
Fabaceae Species”. Not. Bot. Hort. Agrobot. Cluj, 2009, v. 37
(2), p. 57-63.
A. Verma and S. Singh, “Biochemical and ultrastructural
changes in plant foliage exposed to auto-pollution”.
Environmental Monitoring and Assessment, 2006, v. 120, p.
585-602.
[9]
S.M. Seyyednejad, K. Majdian, H. Koochak and M.
Nikneland, “Air pollution Tolerance Indices of some plants
around Industrial Zone in South of Iran”. Asian Journal of
biological Sciences, 2011, v. 4 (3), p. 300-305.
[10] A. Chouhan, S. Iqbal, R.S. Maheswari, A. Bafna, “Study of
air pollution index of plants growing in Pithampur Industrial
area sector 1, 2 and 3”. Res. J.Recent. sci, 2012, v. 1, p.
172-177.
[11] N. Smirnoff, “The function and metabolism ascorbic acid in
plants”. Ann Bot, 1996, v. 78, p. 661-669.
[12] F. A. Loewus, “Biosynthesis and metabolism of ascorbic acid
in plants and an analogs of ascorbic acid in fungi”.
Phytochemistry, 1999, v. 52, p. 193-210.
[13] Conklin, “Identification of ascorbic acid-deficient
Arabidopsis thaliana mutants”. Genetics, 2000, v. 154, p.
847-856.
[14] G.A. Carter and A.K. Knapp, “Leaf optical properties in
higher plants: linking spectral characteristics to stress and
chlorophyll concentration”. Am J Bot, 2001, v. 88, p.
677-684.
[15] W. Hartung, J. W. Radin and D.L. Hendrix, “Absisic acid
movement into the apoplastic solution of water stressed
cotton leaves”. Plant Physiol, 1988, v. 86, p. 908-913.
[16] K. Mohammed, K. Rashmi and W.R. Pramod, “Studies on air
pollution tolerance of selected plants in Allahabad city,
India”. E3. J. Environ. Res. Manage, 2011, v. 2 (3), p. 42-46.
[17] K.S. Arun, “India’s urban growth and environmental
concern”. J. Environ. Res. Develop, 2008, v. 1 (1), p. 73-78.
[18] Y.J. Lui and H. Ding, “Variation in air pollution tolerance
index of plants near a steel factory, Impication for landscape
plants species selection for industrial areas”, WSEAS Trans.
On Environ. and Develop, 2008, v. 4, p. 24-32.
[19] R.J. Porra, “The chequered history of the development and
use of simultaneous equations for the accurate determination
of chlorophylls a and b”. Photosynth Res, 2002, v. 73, p.
149-156.
[20] M.Z. Barakat, S.K. Shehab, N. Darwish and E.I. Zahermy,
“Ascorbic Acid from plants”. Anal. Biochem, 1973, v. 53, p.
225-245.
[21] P.O. Agbaire, “Air Pollution Tolerance Indices (APTI) of
some plants around Erhoike- Kokori oil exploration in Delta
state, Nigeria”. J. Applied Sci. Environ.Manage, 2009, v. 4
(6), p. 366- 368.
[22] S.K. Singh and Rao D.N, “Evaluation of plants for their
tolerance for their tolerance to air pollution, In : proceedings
symbosium on Air pollution control, Indian association of
Air pollution control, New Delhi, India, 1983, V. 1, p.
218-224.
[23] A. Swami, D. Bhatt and P.C. Joshi, “Effects of automobile
pollution on sal (Shorea robusta) and rohini (Mallotus
phillipinensis) at Asarori, Dehradun”. Himalayan Journal of
Environment and Zoology, 2004, v. 18 (1), p. 57-61.
[24] T. Keller, “The electrical conductivity of Norway spruce
needle diffusate as affected by air pollutants”. Tree Physiol,
1986, v. 1, p. 85-94.
International Journal of Environmental Monitoring and Analysis 2015; 3(1): 22-27
[25] G. Masuch, H. Kicinski, A. Kettrup and K.S. Boss, “Single
and combined effects of continuous and discontinuous O3
and SO2 emission on Norway spruce needle: Histochemical
and cytological changes”. Intl. J. Env. Anal. Chem, 1988, v.
32, p. 213-241.
[26] P.S. Lakshmi, K.L. Sravanti and N. Srinivas, “Air pollution
tolerance index of various plant species growing in industrial
areas”. The Ecoscan, 2008, v. 2 (2), p. 203-206.
[27] F. Scholz and S. Reck, “Effects of acids on forest trees as
measured by titration in vitro, inheritance of buffering
capacity in Picea abies”. Water, Air and Soil Pollut, 1977, v. 8,
p. 41-45.
[28] D.J. Speeding and W.J. Thomas, “Effect of sulphur dioxide
on the metabolism of glycollic acid by barley (Hardeum
vulgare) leaves”. Aust. J. Biol. Sci, 1973, v. 6, p. 281-286.
27
[29] S.K. Singh, D.N. Rao, M. Agrawal, J. Pandey and D.
Narayan, “Air pollution tolerance index of plant”. J Environ
Mgmt, 1991, v. 32, p. 45-55.
[30] T. Keller and H. Schwager, “Air pollution and ascorbic acid”.
Eur. J. Forestry Pathol, 1977, v. 7, p. 338-350.
[31] E.H. Lee, J.A. Jersey, C. Gifford and J. Bennett, “Differential
ozone tolerance in soybean and snapbeans: analysis of
ascorbic acid in O3 susceptible and O3 resistant cultivars by
high performance liquid chromatography”. Env. Expl. Bot,
1984, v. 24, p. 331-341.
[32] S.R.K. Varshney and C.K. Varshney, “Effect of SO2 on
ascorbic acid in crop plants”. Env. Pollut, 1984, v. 35, p.
285-290.


© Copyright 2026