
Personal Independence Payment adhoc statistics - New
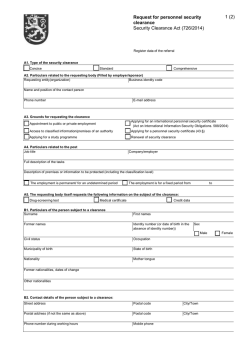
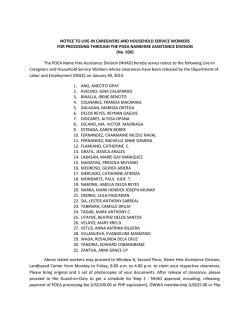
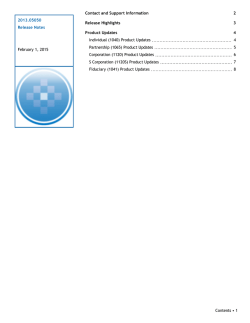
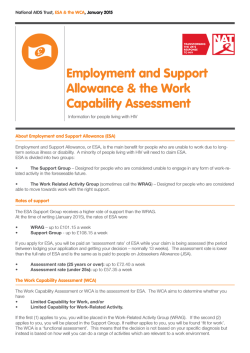
Personal Independence Payment: Statistical Ad Hoc New Claims – Registrations, Assessment Provider Referrals and Returns, Clearances and Outstanding Claims (Great Britain) January 2015 Personal Independence Payment: Statistical Ad Hoc Contents Background............................................................................................................... 3 Method....................................................................................................................... 4 Results....................................................................................................................... 5 PIP New Claims (Normal Rules) – Registration, Assessment Provider Referrals and Returns and Total Clearances ................................................... 5 PIP New Claims (Normal Rules) – Outstanding Claims ................................... 9 PIP New Claims (Special Rules) – Registrations and Clearances ................. 11 Contact Points for Further Information ................................................................ 15 Report title Background This information is being published today to provide data into the public domain that will enable sharing of information, and add value to discussions that are due to take place, at the Work and Pensions Select Committee on the 28th January 2015. This release therefore provides equality of access to information that may be used in the Work and Pensions Select Committee hearing. These data should be seen as provisional and may be subject to revision. Some of the figures given in this ad hoc may be published in due course as part of the Department’s quarterly release of Personal Independence Payment official statistics1. From 8th April 2013 DWP started to replace Disability Living Allowance (DLA) for people aged 16-64, with Personal Independence Payment (PIP). On 8th April 2013, PIP was introduced as a controlled start, for new claims from people living in a limited geographic area in the North West and part of the North East of England. On 10th June 2013, PIP was introduced for new claims for the remaining parts of Great Britain. From 28th October 2013, DWP started to invite DLA claimants living in certain areas to claim PIP. 1 https://www.gov.uk/government/publications/personal-independence-payment-releasestrategy 3 Personal Independence Payment: Statistical Ad Hoc Method The data within this publication has been sourced from PIP Computer System claimant records. The statistics have been developed using guidelines set out by the UK Statistics Authority, and as new statistics undergoing evaluation they have accordingly been badged as being experimental statistics. As the data available for PIP evolves over time, the methodology used and definitions may develop also. Therefore these data should be seen as provisional and may be subject to revision. The data used to produce the statistics represent PIP new claims that have been claimed during the period 8th April 2013 to 25th January 2015, within Great Britain. Monthly totals represent the calendar month. ‘Special Rules’ are claims made under special rules for terminally ill people. All other claims are defined as ‘Normal Rules’. More detailed methodology is provided within the footnotes that accompany the data tables and charts. 4 Personal Independence Payment: Statistical Ad Hoc Results PIP New Claims (Normal Rules) – Registration, Assessment Provider Referrals and Returns and Total Clearances The below table/figure 1 show that between 8th April 2013 and 31st December 2014 over 523,000 new claims (normal rules) have been referred to the assessment providers, with nearly 388,000 having been returned (74%). As at 31st December 2014, a total of 625,000 new claims (normal rules) had been registered. The gap of around 100,000 claims between the number of registrations and referrals to the assessment providers exists because; some claims have either been received recently and are still with the claimant for completion and return of Part 2 information and evidence; or the claimant may have chosen to withdraw their claim; or the department has disallowed the claim before it was referred to the assessment providers (due to failure of basic eligibility criteria or non return of the Part 2 information within the time limit). Although the number of referrals to the assessment providers has remained broadly constant at around 30,000 per month, the number of returns from the assessment providers has increased each month, with over 52,000 being returned per month since October 2014. By the end of December 2014, DWP had cleared a total of 441,900 new claims (normal rules). The number of clearances are higher than the number of claims returned from the assessment providers, as clearance figures also include claims that have been withdrawn and claims disallowed prior to the claim being referred to the assessment providers. Clearances have been increasing each month and between January 2014 and December 2014 the number new claims (normal rules) processed has increased by four times from around 14,000 to 60,000 per month. Of the total new claims (normal rules) clearances between April 2013 and December 2014; nearly 216,000 (49%) were awarded PIP; around 64,000 (14%) were disallowed pre-referral to the assessment providers (due to failure of basic eligibility criteria or non return of the Part 2 information within the time limit); 143,000 (32%) were disallowed post-referral to the assessment providers (due to the claimant not scoring enough points at the assessment to be awarded the benefit, or the claimant failing to attend the assessment without good reason) and; just over 19,000 (4%) of claims were withdrawn by the claimant. 5 Personal Independence Payment: Statistical Ad Hoc Table 1: PIP New Claims (Normal Rules) – Registrations, Assessment Provider Referrals, Assessment Provider Returns and Total Clearances (April 2013 – December 2014) New Claims Normal Rules Clearances of which; Disallowed Disallowed preTotal referral to the post-referral to Withdrawn by Clearances AP the AP the claimant Registrations Referrals to the AP Returns from the AP 3,000 4,800 23,000 34,200 30,600 33,700 35,500 32,600 21,700 37,900 36,000 36,800 32,600 32,400 32,900 35,000 31,900 37,300 36,200 32,200 24,800 200 1,900 3,100 14,700 23,900 25,700 37,500 30,400 30,100 28,800 28,700 34,500 32,500 28,200 28,600 28,900 27,100 32,900 28,800 29,200 27,500 300 200 1,100 1,800 2,600 6,500 7,500 10,500 11,400 12,300 14,700 20,200 18,700 26,200 28,600 30,300 37,300 52,000 52,500 53,300 100 300 1,100 2,700 3,700 6,700 12,200 11,900 13,900 10,800 13,800 15,300 15,800 35,300 33,600 50,300 41,200 54,700 60,200 58,100 100 1,100 1,300 1,700 3,000 2,400 1,900 100 100 100 200 12,900 4,900 6,000 7,000 6,800 6,600 7,300 0 200 500 700 1,800 4,500 4,300 4,100 3,300 4,200 4,900 4,900 10,500 11,000 16,500 13,400 18,200 21,000 19,700 200 600 600 800 800 800 700 1,200 1,000 1,000 1,000 1,000 1,400 1,300 1,400 1,500 1,500 1,400 1,300 100 300 600 1,000 2,400 4,000 4,500 6,700 6,400 8,600 9,300 9,700 10,600 16,400 26,500 19,400 28,200 31,300 29,800 624,900 523,200 387,900 441,900 63,600 143,400 19,300 215,600 Apr-13 May-13 Jun-13 Jul-13 Aug-13 Sep-13 Oct-13 Nov-13 Dec-13 Jan-14 Feb-14 Mar-14 Apr-14 May-14 Jun-14 Jul-14 Aug-14 Sep-14 Oct-14 Nov-14 Dec-14 Total Awarded Source: PIP Computer System claimant records Notes to table 1: 1. Figures have been rounded to the nearest 100. Components may not sum to totals due to rounding. 2. Figures are for normal rules (i.e. non special rules for the terminally ill) new claims only. The status of claims as 'normal rules' is shown as at the point of registration/referral/return/clearance, in accordance with the measure. The measures capture the volumes within the month the event occurred (e.g. referral volumes represent the month of referral was made). 3. Registrations include all claimants who have completed the initial PIP claim process, either by phone or, in exceptional circumstances, via a paper form. 4. Referrals to the assessment providers (AP) include all claims that have been referred regardless of whether a Part 2 form/evidence has been received for the claim or not. 5. Returns from the assessment providers (AP) include all referred claims that have been returned to DWP for a decision following the assessment, as well as claims that have been disallowed by the DWP prior to a successful assessment (e.g. for failure to attend) and claims withdrawn by the claimant prior to the assessment. 6. Total clearances include Decisions (comprising Awards and Disallowances) and Withdrawals and reflect outcomes prior to any reconsideration and appeal action. 7. The number of clearances are higher than the number of claims returned from the assessment providers, as clearance figures also include claims that have been withdrawn and claims disallowed prior to the claim being referred to the assessment providers. 8. Disallowed pre-referral to the assessment providers (AP) includes claims that have been disallowed due to failure of basic eligibility criteria or non-return of the Part 2 form within the time limit and have not been marked as requiring additional support. Note, between Jan 14 - May 14 an IT issue within the PIP computer system caused a fall in the number of disallowances prereferral to the assessment providers. Likewise, the resolution of the issue in June 14 caused a large increase in the number of disallowances pre-referral to the assessment providers in that month. 9. Disallowed post-referral to the assessment providers (AP) includes claims that have been disallowed following the assessment due to the claimant not scoring enough points at the assessment to be awarded the benefit, or the claimant failing to attend the assessment without good reason. 10. Withdrawn by the claimant includes all claims that have been withdrawn by the claimant prior to a decision being made. This can take place at any point in the claimant journey following registration of a claim. 11. Awarded means the Department have made a decision to award the claim. 12. '-' Less than 50 claims in this category. 13. Great Britain only. 6 Personal Independence Payment: Statistical Ad Hoc Figure 1: PIP New Claims (Normal Rules) - Assessment Provider Referrals and Assessment Provider Returns (January 2014 – December 2014) PIP New Claims (Normal Rules) - AP Referrals and AP Returns Referrals to the AP Returns from the AP 60,000 Number of claims 50,000 40,000 30,000 20,000 10,000 0 Dec-14 Nov-14 Oct-14 Sep-14 Aug-14 Jul-14 Jun-14 May-14 Apr-14 Mar-14 Feb-14 Jan-14 Month of event The below table/figure 2 show that the average (median) PIP new claims (normal rules) clearance time between referral to and return of claims from the assessment providers peaked in June/July 2014 at 30 weeks, but has been reducing since, to 14 weeks for cases returned between 1st January and 25th January 2015. Table 2: PIP New Claims (Normal Rules) - Average (Median) Assessment Provider Clearance Time in Weeks (January 2014 – 25th January 2015) New Claim s Norm al Rules Average (M edian) Assessm ent Provider Clearance T im e (W eeks) Jan-14 Feb-14 M ar-14 Apr-14 M ay-14 Jun-14 Jul-14 Aug-14 Sep-14 O ct-14 Nov-14 Dec-14 Jan-15 18 17 20 21 27 30 30 27 25 22 23 18 14 Source: PIP Computer System claimant records 7 Personal Independence Payment: Statistical Ad Hoc Notes to table 2: 1. Figures have been rounded to the nearest whole number of weeks. 2. Figures are for normal rules (i.e. non special rules for the terminally ill) new claims only. The status of claims as 'normal rules' is shown as at the point of referral. 3. Figures represent the average clearance time of claims cleared by the assessment providers (AP) within that calendar month. This includes all claims that have been referred regardless of whether a Part 2 form/evidence has been received for the claim or not. Data for January 2015 is a partial month, showing data available as at 25th January 2015. 4. Clearance Time is measured as the average time between referral to the assessment providers and the return of the assessment provider’s recommendation to DWP. This is a proxy for the length of time the claimant has waited for an assessment, because data on the dates that assessments took place is not held by DWP. 5. Note that if the claimant is disallowed for failure to attend without good reason, or the claimant withdraws their claim, then the Clearance Time is measured as the time between referral to the assessment providers and the disallowance decision date or withdrawal date for these claims. 6. Great Britain only. Figure 2: PIP New Claims (Normal Rules) - Average (Median) Assessment Provider Clearance Time in Weeks (January 2014 – 25th January 2015) PIP New Claims (Normal Rules) - Average (Median) Assessment Provider Clearance Time Average (Median) Assessment Provider Clearance Time (Weeks) 35 30 Weeks 25 20 15 10 5 0 Jan-15 Dec-14 Nov-14 Oct-14 Sep-14 Aug-14 Jul-14 Jun-14 May-14 Apr-14 Mar-14 Feb-14 Jan-14 Month of Assessm ent Provider Return 8 Personal Independence Payment: Statistical Ad Hoc PIP New Claims (Normal Rules) – Outstanding Claims The below table/figure 3 show that as at 25th January 2015, just over 110,000 new claims (normal rules), that had been referred to the assessment providers, were outstanding with either the assessment providers or DWP. The number of new claims (normal rules) outstanding with the assessment providers was around 98,000 as at 25th January 2015. The number of new claims (normal rules) outstanding with DWP for a decision was just over 12,000 as at 25th January 2015. Table 3 also provides information on the percentage of claims referred to the assessment providers that are still outstanding. As at 25th January 2015, 20% of referrals to the assessment providers were still outstanding (with 9% outstanding over 16 weeks). Table 3: PIP Outstanding New Claims (Normal Rules), with the Assessment Provider or DWP (April 2013 – 25th January 2015) New Claims Normal Rules Outstanding with AP Outstanding with DWP Apr-13 May-13 Jun-13 Jul-13 Aug-13 Sep-13 Oct-13 Nov-13 Dec-13 Jan-14 Feb-14 Mar-14 Apr-14 May-14 Jun-14 Jul-14 Aug-14 Sep-14 Oct-14 Nov-14 Dec-14 Jan-15 100 1,600 3,700 15,600 29,700 41,900 63,100 78,900 92,700 106,300 122,000 139,100 152,200 162,100 167,900 172,400 174,300 175,200 158,500 141,000 119,100 97,900 200 300 800 1,400 2,200 3,900 3,900 5,900 5,800 7,000 7,900 11,600 13,800 18,100 19,200 7,600 10,600 13,900 12,500 13,500 12,100 Total Outstanding 200 1,800 4,000 16,300 31,100 44,000 66,900 82,900 98,500 112,100 129,000 147,000 163,800 175,900 186,000 191,600 181,900 185,800 172,500 153,500 132,600 110,100 Total outstanding over Total outstanding as a 16 weeks as a % of AP % of AP referrals referrals (given in table 1) (given in table 1) 97% 89% 78% 83% 71% 63% 63% 60% 59% 57% 57% 57% 56% 55% 53% 51% 45% 42% 37% 31% 25% 20% 0% 0% 0% 0% 0% 1% 4% 9% 13% 15% 22% 24% 24% 25% 26% 27% 23% 21% 18% 14% 11% 9% Source: PIP Computer System claimant records Notes to table 3: 1. Figures have been rounded to the nearest 100. Components may not sum to totals due to rounding. 2. Figures represent the number of outstanding claims as on the last day of each calendar month, with the exception of January 2015 which is the latest data as at 25th January 2015. This is measured from the point of the referral to the assessment providers (AP). It does not include claims that have not yet been referred to the assessment providers OR claims that have been referred to the assessment providers but where the claimant is yet to provide Part 2 form/evidence to the Department. 9 Personal Independence Payment: Statistical Ad Hoc 3. Figures are for normal rules (i.e. non special rules for the terminally ill) new claims only. Normal rules' status is based on the claims status on the date of referral to the assessment providers. 4. Outstanding claims are those claims that have been referred to the assessment providers but have not yet reached a clearance point (i.e. either a decision to award or disallow the claim has not been made, or the claim has not been withdrawn by the claimant). 5. The January 2015 figures in the ‘Total outstanding as a % of the AP referrals’ and ‘Total outstanding over 16 weeks as a % of the AP referrals’ have been calculated by dividing the total number of claims outstanding by the number of referrals to the th assessment providers (AP) between April 2013 and 25 January 2015. 5. '-' Less than 50 claims in this category. 6. Great Britain only. Figure 3: PIP Outstanding New Claims (Normal Rules), with the Assessment Provider or DWP (April 2013 – 25th January 2015) Note to figure 3 – the red line at 120,000 outstanding claims between January 2014 and January 2015 represents the equivalent of 16 weeks of worth of average intake (7,500 per week) 10 Personal Independence Payment: Statistical Ad Hoc PIP New Claims (Special Rules) – Registrations and Clearances The below table/figure 4 show that between 8th April 2013 and 31st December 2014, just over 27,000 new claims (special rules) had been registered and 32,000 new claims (special rules) had been cleared. There are more special rules clearances than registrations as some claims transition from normal rules to special rules during the claimant journey and hence may not be special rules at the point of registration but are by the point of clearance. Claims can also transition from special rules to normal rules during the claimant journey but this is less prevalent. The number of registrations and clearances for special rules new claims per month is stable at between 1,500 and 2,000 claims. This can be seen in figure 4. Of the total clearance between April 2013 and December 2014, the majority (96%) were awarded PIP, with only a small number of claims either being withdrawn by the claimant or disallowed pre- or post-referral to the assessment providers. Table 4: PIP New Claims (Special Rules) – Registrations and Clearances (April 2013 – December 2014) N ew C laim s Special R ules R egistrations Apr-13 M ay-13 Jun-13 Jul-13 Aug-13 Sep-13 O ct-13 N ov-13 D ec-13 Jan-14 Feb-14 M ar-14 Apr-14 M ay-14 Jun-14 Jul-14 Aug-14 Sep-14 O ct-14 N ov-14 D ec-14 T o tal C learances of w hich; D isallowed preD isallow ed T otal referral to the post-referral to W ithdraw n by C learances AP the AP the claim ant Awarded 200 200 900 1,500 1,300 1,300 1,500 1,400 1,200 1,500 1,300 1,600 1,400 1,400 1,500 1,600 1,400 1,700 1,700 1,500 1,400 200 300 1,200 1,400 1,600 1,700 1,900 1,600 1,800 1,900 1,900 1,900 1,700 1,900 2,000 1,700 1,900 2,000 1,700 1,600 0 0 0 0 0 - 0 0 0 - 100 100 100 100 100 100 100 100 100 100 100 100 - 200 300 1,100 1,400 1,500 1,600 1,800 1,500 1,700 1,900 1,800 1,800 1,700 1,800 1,800 1,700 1,800 1,900 1,700 1,600 27,300 32,000 - 300 1,000 30,700 Source: PIP Computer System claimant records 11 Personal Independence Payment: Statistical Ad Hoc Notes to table 4: 1. Figures have been rounded to the nearest 100. Components may not sum to totals due to rounding. 2. Figures are for special rules (i.e. for the terminally ill) new claims only. The status of claims as 'special rules' is shown as at the point of registration/clearance, in accordance with the measure. The measures capture the volumes within the month the event occurred (e.g. registration volumes represent the month of registration was made). 3. Registrations include all claimants who have completed the initial PIP claim process, either by phone or, in exceptional circumstances, via a paper form. 4. Clearances include Decisions (comprising Awards and Disallowances) and Withdrawals and reflect outcomes prior to any reconsideration and appeal action. 5. Disallowed pre-referral to the assessment providers (AP) includes claims that have been disallowed due to failure of basic eligibility criteria. 6. Disallowed post-referral to the assessment providers (AP) includes claims that have been disallowed following the assessment due to not scoring enough points at the assessment stage. 7. Withdrawn by the claimant includes all claims that have been withdrawn by the claimant prior to a decision being made. This can take place at any point in the claimant journey following registration of a claim. 8. Awarded means the Department have made a decision to award the claim. 9. There are more special rules clearances than registrations as some claims transition from normal rules to special rules during the claimant journey and hence may not be special rules at the point of registration but are by the point of clearance. Claims can also transition from special rules to normal rules during the claimant journey, but this is less prevalent. 10. '-' Less than 50 claims in this category. 11. Great Britain only. Figure 4: PIP New Claims (Special Rules) – Registrations and Clearances (April 2013 – December 2014) PIP New Claims (Special Rules) - Registrations and Clearances Registrations Total Clearances 2,500 Number of claims 2,000 1,500 1,000 500 0 Dec-14 Nov-14 Oct-14 Sep-14 Aug-14 Jul-14 Jun-14 May-14 Apr-14 Mar-14 Feb-14 Jan-14 Dec-13 Nov-13 Oct-13 Sep-13 Aug-13 Jul-13 Jun-13 May-13 Apr-13 Month of event 12 Personal Independence Payment: Statistical Ad Hoc The below table/figure 5 show that the average (median) PIP new claims (special rules) end to end clearance time fell from 11 working days in January 2014 to 6 working days in October 2014, and is now at an average of 7 working days for cases cleared between 1st January and 25th January 2015. Table 5: PIP New Claims (Special Rules) - Average (Median) End to End Clearance Time in Working Days (January 2014 – 25th January 2015) N e w C la im s S p e c ia l R u le s A ve ra g e (M e d ia n ) C le a ra n c e T im e (W o rk ing D a ys ) J a n -1 4 F e b -1 4 M a r-1 4 A p r-1 4 M a y-1 4 J u n -1 4 J u l-1 4 A u g -1 4 S e p -1 4 O c t-1 4 N o v-1 4 D e c -1 4 J a n -1 5 11 10 9 9 8 7 7 7 7 6 7 7 7 Source: PIP Computer System claimant records Notes to table 5: 1. Figures are presented in working days, i.e. Monday to Friday. 2. Figures are for special rules (i.e. for the terminally ill) new claims only. The status of claims as 'special rules' is shown as at the point of clearance. 3. Figures represent the average end to end clearance time of claims cleared within that calendar month. Data for January 2015 is a partial month, showing data available as at 25th January 2015. 4. Clearance Time is measured as the average time between the date of registration of the claim (or the date of transition if the claim moves from being a normal rules claim to special rules claim during the claimant journey) and the date a decision is made by DWP. It does not include claims that have been withdrawn by the claimant or claims that have been disallowed by DWP prereferral to the assessment providers (e.g. for failure of basic eligibility criteria). 5. Great Britain only. 13 Personal Independence Payment: Statistical Ad Hoc Figure 5: PIP New Claims (Special Rules) - Average (Median) End to End Clearance Time in Working Days (January 2014 – 25th January 2015) PIP New Claims (Special Rules) - Average (Median) End to End Clearance Time Average (Median) Clearance Time (Working Days) 12 Working Days 10 8 6 4 2 0 Jan-15 Dec-14 Nov-14 Oct-14 Sep-14 Aug-14 Jul-14 Jun-14 May-14 Apr-14 Mar-14 Feb-14 Jan-14 Month of Clearance 14 Personal Independence Payment: Statistical Ad Hoc Contact Points for Further Information Press enquiries should be directed to the Department for Work and Pensions press office: Media Enquiries: 0203 267 5129 Out of hours: 0203 267 5144 Website: https://www.gov.uk/ Follow us on Twitter: www.twitter.com/dwppressoffice This report was produced by; Joanne Dalzell ([email protected]) Richard Waterman ([email protected]) Department for Work and Pensions January 2015 15


© Copyright 2026