
PDF (3 MB) - Molecular Metabolism
Accepted Manuscript
Therapeutic effects of adropin on glucose tolerance and substrate utilization in dietinduced obese mice with insulin resistance
Su Gao, Ryan P. McMillan, Qingzhang Zhu, Gary D. Lopaschuk, Matthew W. Hulver,
Dr. Andrew A. Butler
PII:
S2212-8778(15)00006-X
DOI:
10.1016/j.molmet.2015.01.005
Reference:
MOLMET 208
To appear in:
Molecular Metabolism
Received Date: 8 December 2014
Revised Date:
6 January 2015
Accepted Date: 9 January 2015
Please cite this article as: Gao S, McMillan RP, Zhu Q, Lopaschuk GD, Hulver MW, Butler AA,
Therapeutic effects of adropin on glucose tolerance and substrate utilization in diet-induced obese mice
with insulin resistance, Molecular Metabolism (2015), doi: 10.1016/j.molmet.2015.01.005.
This is a PDF file of an unedited manuscript that has been accepted for publication. As a service to
our customers we are providing this early version of the manuscript. The manuscript will undergo
copyediting, typesetting, and review of the resulting proof before it is published in its final form. Please
note that during the production process errors may be discovered which could affect the content, and all
legal disclaimers that apply to the journal pertain.
ACCEPTED MANUSCRIPT
Adropin34-76
Glucose
Insulin
IR
Notch
pAkt
PIP
IRS1
PI-3K
3
pAS160
RI
PT
Fa#y Acids GLUT4
Cd36
SC
Improved
mitochondrial
function
?
M
AN
U
Hes1
β-oxidation
?
Glycogen
NAD+
CoA
acetyl-CoA NADH
PDH
EP
Pdk4
TE
D
Pgc-1α
Glucose
oxidation
Pyruvate
oxidation
(Mitochondria)
AC
C
(Nucleus)
GLUT4
Skeletal muscle cell
ACCEPTED MANUSCRIPT
RI
PT
Therapeutic effects of adropin on glucose tolerance and substrate utilization in diet-induced obese
mice with insulin resistance
M
AN
U
SC
Su Gao1, Ryan P. McMillan2, Qingzhang Zhu1, Gary D. Lopaschuk4, Matthew W. Hulver2 and Andrew A. Butler1,3
Running title: Adropin therapy alleviates glucose intolerance.
Department of Metabolism and Aging, Scripps Research Institute, Jupiter, FL, USA.
TE
D
1
2
Department of Human Nutrition, Foods and Exercise; Virginia Polytechnic Institute and State University,
Blacksburg VA, USA
3
Department of Pharmacological & Physiological Science, Saint Louis University School of Medicine, Saint
Louis, MO, USA
Department of Pediatrics, Mazankowski Alberta Heart Institute, University of Alberta, Edmonton, AB, Canada
AC
C
EP
4
Address all correspondence to Dr. Andrew A. Butler:
Pharmacological & Physiological Science
Saint Louis University School of Medicine
1402 S Grand Blvd
St Louis, MO 63104
ph: 314-977-6425
fax: 314-977-6410
Email: [email protected]
ACCEPTED MANUSCRIPT
Adropin therapy alleviates glucose intolerance
ABSTRACT
Objective
The peptide hormone adropin regulates fuel selection preferences in skeletal muscle under fed and fasted
RI
PT
conditions. Here, we investigated whether adropin treatment can ameliorate the dysregulation of fuel substrate
metabolism, and improve aspects of glucose homeostasis in diet-induced obesity (DIO) with insulin resistance.
Methods
DIO C57BL/6 mice maintained on a 60% kcal fat diet received five intraperitoneal (i.p.) injections of the bioactive
SC
peptide adropin34-76 (450nmole/kg/i.p.). Following treatment, glucose tolerance and whole body insulin sensitivity
were assessed and indirect calorimetry was employed to analyze whole body substrate oxidation preferences.
M
AN
U
Biochemical assays performed in skeletal muscle samples analyzed insulin signaling action and substrate
oxidation.
Results
Adropin treatment improved glucose tolerance, enhanced insulin action and augmented metabolic flexibility
towards glucose utilization. In muscle, adropin treatment increased insulin-induced Akt phosphorylation and cellsurface expression of GLUT4 suggesting sensitization of insulin signaling pathways. Reduced incomplete fatty
TE
D
acid oxidation and increased CoA/acetyl-CoA ratio suggested improved mitochondrial function. The underlying
mechanisms appear to involve suppressions of carnitine palmitoyltransferase-1B (CPT-1B) and CD36, two key
enzymes in fatty acid utilization. Adropin treatment activated pyruvate dehydrogenase (PDH), a rate-limiting
enzyme in glucose oxidation, and downregulated PDH kinase-4 (PDK-4) that inhibits PDH. Along with these
EP
changes, adropin treatment downregulated peroxisome proliferator-activated receptor-gamma coactivator-1α that
regulates expression of Cpt1b, Cd36 and Pdk4.
AC
C
Conclusions
Adropin treatment of DIO mice enhances glucose tolerance, ameliorates insulin resistance and promotes
preferential use of carbohydrate over fat in fuel selection. Skeletal muscle is a key organ in mediating adropin’s
whole-body effects, sensitizing insulin signaling pathways and altering fuel selection preference to favor glucose
while suppressing fat oxidation.
2
ACCEPTED MANUSCRIPT
Adropin therapy alleviates glucose intolerance
Key words
Adropin;
Glucose metabolism;
RI
PT
Fatty acid metabolism;
Insulin action;
Metabolic flexibility;
AC
C
EP
TE
D
M
AN
U
SC
Mitochondrial function.
3
ACCEPTED MANUSCRIPT
Adropin therapy alleviates glucose intolerance
1.0
INTRODUCTION
Adropin is a small peptide that has been linked to metabolic homeostasis and cardiovascular function [1-4]. High
RI
PT
levels of expression of the Energy Homeostasis Associated (Enho) gene encoding adropin have been observed in
the central nervous system, although widespread expressions in peripheral tissues such liver, cardiac and skeletal
muscle, and endothelium have also been reported [4-6]. Adropin was originally proposed to be a secreted factor,
with residues 1-33 encoding a secretory signal peptide [4].
A more recent study suggests that adropin is
SC
predominantly a membrane-bound protein that interacts with the notch signaling pathway to modulate intercellular
communications [5]. While the source and mechanism of release remains controversial, adropin immunoreactivity
M
AN
U
has nevertheless been reported by several laboratories to be present in plasma and sera of mouse, nonhuman
primate and human [3, 7-23]. Studies in mice suggest that the gene expression and the circulating levels of adropin
are affected by dietary macronutrients and energy balance states [3, 4, 20, 24, 25].
The rapid regulation of adropin levels by nutritional and energy states points to potential roles for adropin in
TE
D
metabolic homeostasis. Indeed, early studies showed that transgenic overexpression of adropin or treatment using
the putative secreted domain (adropin34-76) improved glucose clearance, reduced fasting insulin and reversed
dyslipidemia and the fatty liver phenotype in diet-induced obese C57BL/6 (DIO) mice [4]. In addition, our group
observed evidence of insulin resistance in the adropin knockout mice [20]. Furthermore, we recently proposed that
EP
adropin regulates the preference for fuel selection in skeletal muscle in the feeding and fasting cycle [3]. We
AC
C
posited that increased release of adropin, such as in the fed state, activates pyruvate dehydrogenase (PDH)
complex to increase glucose oxidation [3]. In parallel, adropin reduces muscle fatty acid oxidation (FAO) by
inhibiting carnitine palmitoyltransferase-1B (CPT1B) [3], a key enzyme that transports fatty acids into muscle
mitochondria for β-oxidation [26].
Dysregulation of glucose and fatty acid metabolism is a metabolic signature in the diet-induced obese (DIO) state
[27]. In the DIO condition, glucose utilization is diminished and fatty acids are the predominant fuel source in
muscle [27]. One mechanism explaining altered fuel selection preference involves the excessive FAO that inhibits
4
ACCEPTED MANUSCRIPT
Adropin therapy alleviates glucose intolerance
pyruvate and glucose oxidation by Randle cycle mechanism [28-31]. A growing body of evidence suggests that
limiting excessive FAO in muscle plays a role in maintaining glucose homeostasis in DIO rodents [30-32]. As our
data suggest that adropin is a physiological regulator of the oxidation of glucose and fatty acid, we speculated that
RI
PT
adropin treatment would exert therapeutic roles in ameliorating the dysregulated fuel metabolism and glucose
intolerance in DIO state. Indeed, recent evidence indicates that high-fat feeding results in muscle mitochondrial
fatty acid overload and excessive β-oxidation, which has been proposed to contribute to the development of insulin
SC
resistance in DIO mice [30]. Furthermore, it has been suggested that inhibition of muscle FAO can alleviate insulin
resistance in DIO mice [32]. Taking these observations together, we hypothesized that adropin treatment would
M
AN
U
enhance insulin actions in muscle of DIO mice. The current study investigated whether adropin treatment would
impact substrate utilization, improve glucose homeostasis and ameliorate insulin resistance in the diet-induced
obesity.
MATERIALS AND METHODS
2.1
Animal studies
TE
D
2.0
Mouse experiments were approved by the Institutional Animal Care and Use Committees of the Scripps Research
Institute (Jupiter, Florida). Male, lean or DIO C57BL/6 mice were purchased from the Jackson Laboratory (Bar
EP
Harbor, ME). Lean mice were maintained on low-fat diets (10-14% kcal fat). DIO mice were maintained on high
fat diet (60% kcal fat) (Research Diets, New Brunswick, NJ). Mice were monitored daily after shipment until body
AC
C
weight became stabilized. Mice subjected to experimental procedures were 24-week old. Body composition was
determined using a NMR spectroscopy analyzer (Bruker Minispec).
2.2
Adropin treatment
Adropin34-76 was provided by Ipsen (Paris, France) or purchased from ChinaPeptides (Shanghai, China). The
peptide was dissolved in 0.1% bovine serum albumin, and administered by intraperitoneal (i.p.) injection.
2.3 Glucose and insulin tolerance tests
5
ACCEPTED MANUSCRIPT
Adropin therapy alleviates glucose intolerance
The animal handling and injection protocols used for glucose tolerance test (GTT) (glucose, 2mg/g fat-free mass)
and insulin tolerance test (ITT) (Humulin, Eli Lilly, IN; insulin, 0.5mU/g body weight) are shown in Fig. 1. Blood
glucose levels were monitored using OneTouch Blood Glucose Meters (LifeScan Europe, Switzerland) at the times
RI
PT
indicated. Serum insulin levels were measured using an Ultrasensitive Mouse Insulin ELISA kit (Crystal Chem,
Downers Grove, IL).
2.4
Whole body metabolic assessment
SC
Oxygen consumption (VO2), carbon dioxide production (VCO2) and respiratory exchange ratio (RER; VCO2/VO2)
were measured using a comprehensive laboratory animal monitoring system (CLAMS; Columbus Instruments,
M
AN
U
Columbus, OH). Heat production (kcal/h/mouse) was calculated using the formula: (3.815+1.232*RER)* VO2.
The proportions of heat derived from carbohydrate and fat oxidation were estimated based on heat production and
RER [33].
2.5
Western blotting analysis
TE
D
Standard immunoprecipitation and immunoblotting procedures were performed according to the protocols detailed
by Cell Signaling Technology (Danvers, MA) and Invitrogen (Carlsbad, CA), respectively. The antibodies to
detect phospho-Akt (S473), Akt, phospho-AS160 (T642), insulin receptor substrate 1 (IRS1), phospho-Tyrosine
EP
(pY), phospho-c Jun N-terminal kinase (JNK) (T183/Y185), p85 subunit of PI-3 kinase, JNK, phospho-inhibitor
kappa B kinase (IKK) α/β (S176/180 ), IKKβ, pyruvate dehydrogenase (PDH) E1α subunit, GLUT4, Na-K ATPase,
AC
C
glyceraldehyde 3-phosphate dehydrogenase (GAPDH) and conformation-specific anti-Rabbit IgG were from Cell
Signaling Technology (Danvers, MA). The PTEN and SIRT3 antibodies are from Santa Cruz Biotechnology
(Dallas, Texas). The anti-PDK2 Ab is from Abcam (Cambridge, MA). The AS160 Ab was from both Cell
Signaling Technology and Millipore (Billerica, MA). The CD36 Ab was from Novus Biologicals (Littleton, CO).
The anti-PDH-E1α (pSer232) Ab was from Millipore. The antibodies to detect PGC-1α, PDK4, and acetylatedLysine (Ac-K) were described previously [3]. GAPDH was used as the loading control in whole cell lysate
analysis. Densitometry was performed with the Scion image software (Frederick, MD).
6
ACCEPTED MANUSCRIPT
Adropin therapy alleviates glucose intolerance
2.6 Subcellular fractionation
To measure GLUT4 and CD36 protein contents in the cell surface, muscle tissues were subject to the subcellular
fractionation procedures that were detailed in [34]. In brief, fragments of the quadriceps muscle were minced and
RI
PT
homogenized in 2 volumes of STE buffer [0.32M sucrose, 20mM Tris-HCL (pH 7.4), 2mM EDTA] with protease
and phosphatase inhibitors (Roche Life Science, Indianapolis, IN). The homogenates were centrifuged at 1,000g,
and the pellet was suspended in Triton buffer [1% Triton X-100, 20mM Tris-HCL (pH7.4), 150mM NaCl, 200mM
SC
EDTA] with protease and phosphatase inhibitors (Roche Life Science, Indianapolis, IN). The suspension was
centrifuged at 15,000g to separate the nuclear fraction. The supernatant was centrifuged at 100,000g (Beckman
M
AN
U
Coulter Optima Ultracentrifuge) to obtain the pellet, which was suspended in the STE buffer plus 1% Nonidet P40, and centrifuged at 100,000g to obtain the membrane fraction. All procedures were performed at 4°C. The
GLUT4 and CD36 protein were then detected with the respective antibodies, with Na-K ATPase serving as the
loading control of cell surface (plasma membrane) fraction [32].
2.7 Fatty acid oxidation
TE
D
FAO was measured using whole muscle homogenates as described before [3, 35]. [U-14C] palmitic acid was used
as the substrate. Skeletal muscle samples were homogenized in the buffer containing 0.25M Sucrose, 1mM EDTA,
0.01M Tris-HCL (pH 7.4), and 2mM ATP. The reaction was initiated by adding a reaction mixture containing the
EP
[U-14C] palmitic acid into the muscle homogenate. The reaction was incubated in a trapping device at 37°C for 1h
before 70% perchloric acid was added to trap CO2 production. The trapping mixture was further incubated under
AC
C
room temperature for 1h before NaOH was added. A portion of the mixture containing the trapped CO2 was used
for scintillation counting. The acidified portion that constitutes the acid soluble metabolites (ASM) was collected,
and incubated overnight under 4°C. Following the overnight incubation, the ASM was centrifuged at 15,000g, and
the supernatant was used for scintillation counting. The 14CO2 production from the labeled palmitate indicates
complete oxidation, and the production of 14C-labeled ASM indicates incomplete oxidation.
2.8 CPT1 activity assay
7
ACCEPTED MANUSCRIPT
Adropin therapy alleviates glucose intolerance
CPT-1 activity was measured using freshly prepared mitochondria as described previously [3, 36]. In brief, the
muscle samples were homogenized in buffer B (250mM Sucrose, 10mM Tris-HCl (pH 7.4) and 1mM EDTA). The
muscle homogenate was centrifuged at 600g, and the resultant supernatant was centrifuged at 12,000g. The pellet
RI
PT
was suspended in buffer B, centrifuged at 8,000g, washed, and finally re-suspended in buffer B. The suspension
was enriched in mitochondria, and was used for the CPT-1 activity assay. The reaction was initiated by adding the
mitochondria sample to the assay mixture containing L-[14C-Me] carnitine and palmitoyl-CoA as substrates. The
SC
reaction was incubated at 30°C for 5 min, and terminated by the addition of 1.2N HCl. Extractions of the product
of the reaction, palmitoyl-14C-carnitine, were conducted by adding water-saturated butanol. The mixture was
M
AN
U
centrifuged at 1,000g, and the upper phase was removed, mixed with H2O, and centrifuged at 2,000g. A portion of
the upper phase was then used for scintillation counting.
2.9
Pyruvate dehydrogenase (PDH) activity assay
The mice were euthanized within two hours after the last injection, and the muscle tissues were freeze-clamped
and flash-frozen in liquid nitrogen. The PDH activity from whole muscle lysate was measured by use of
TE
D
colorimetric microplate assay kit from Mitosciences (Eugene, OR) [37], following the manufacturer’s protocol. In
brief, PDH proteins from whole cellular lysate were immunocaptured on a microplate. A reaction mixture
containing pyruvate and NAD+ is then added to the plate. The readout is the rate of production of NADH, which
EP
was further coupled to the reduction of a reporter dye to yield a colored reaction product. The formation of the
colored product was then monitored on a spectrophotometer, and the PDH activity was calculated by use of the
AC
C
rate of the change in optical density. Preliminary study showed a 50% decrease in the native PDH activity in the
fasted muscle extract, which validates the assay. In addition, the PDH activity levels in the current study are in the
similar range as in another report using the same kit [37].
3.0 Glycogen and triacylglycerol assay
8
ACCEPTED MANUSCRIPT
Adropin therapy alleviates glucose intolerance
Glycogen and triacylglycerol were measured by use of the Glycogen Assay Kit from Abcam (Cambridge, MA)
and the Triglyceride Colorimetric Assay Kit from Cayman (Ann Arbor, MI), respectively, following the
RI
PT
manufacturer’s protocols.
3.1 Real-time PCR
The extraction of the total RNA from muscle samples was performed by use of the RNeasy Mini Kit from Qiagen
(Valencia, CA). cDNA was synthesized using the high capacity cDNA reverse transcription kit from Applied
SC
Biosystems (Carlsbad, CA). PCR was conducted using a 7900 Fast Real-time PCR system, following the
instructions from the TaqMan Gene Expression Assays (Applied Biosystems). The message levels of Gapdh were
3.2
M
AN
U
used as the loading control.
Metabolic profiling
Metabolomics analysis of the muscle samples was performed by Metabolon (Durham, NC). The levels of long-
3.3
Statistical analysis
TE
D
chain acyl-CoA, ceramide and malonyl-CoA were measured as reported before [32].
All data are presented as mean ± SEM. Unless otherwise noted, Student t-test or ANOVA followed by multiple
statistically significant.
3.1
RESULTS
AC
C
3.
EP
comparison tests (Neuman-Keuls) was used to evaluate the statistical significance. A value of P<0.05 is defined as
Adropin treatment improved glucose tolerance in DIO mice.
To confirm that adropin34-76 therapy improves glucose tolerance, we adhered to the treatment protocol that was
shown previously to improve glucose tolerance [4]. We administered five intraperitoneal (i.p.) injections of
adropin34-76 (450nmole/kg/i.p.) to DIO mice over 2-3 days; control DIO and lean mice were treated with the
vehicle (Fig. 1A). Injections of adropin34-76 at this dose and duration did not alter body weight (Fig. 2A), thus
excluding potential effects of weight change on glucose tolerance. In the experiment examining glucose tolerance,
9
ACCEPTED MANUSCRIPT
Adropin therapy alleviates glucose intolerance
the mice were fasted overnight, and a bolus intraperitoneal injection of glucose was administered at 1h after the
last injection of adropin34-76 (Fig. 1A). Blood glucose levels were then monitored in the following 90 minutes. The
vehicle-treated DIO mice were glucose intolerant compared to the lean mice, and adropin treatment significantly
RI
PT
improved glucose tolerance in DIO mice (Fig. 2B). Serum insulin levels were also measured 90 minutes postglucose injection, with adropin-treated DIO mice exhibiting levels that were lower relative to the vehicle-treated
DIO mice (Fig. 2C). We next assessed whether adropin treatment would improve whole body insulin action by
SC
performing insulin tolerance test (ITT) in mice fasted for 6h (Fig. 1B). DIO mice treated with adropin exhibited
lower blood glucose levels, while the effect of insulin to lower blood glucose was enhanced relative to DIO
M
AN
U
controls (Fig. 2D). Collectively, these data suggest that treating DIO mice with the adropin34-76 peptide was
effective at enhancing glucose tolerance and alleviating whole-body insulin resistance.
3.2
Adropin treatment enhanced glucose oxidation and metabolic flexibility.
Our previous results suggest that adropin is involved in the physiological control of fuel selection [3]. In the
current study, we conducted indirect calorimetry to assess whether adropin treatment, associating with the
TE
D
enhancement of glucose and insulin tolerance, would impact fuel utilization in DIO mice. The protocol used for
this experiment was similar to that used to investigate glucose tolerance (Fig. 1A). The acclimated DIO mice
the mice.
EP
received five injections of adropin34-76, and then a bolus of a mixture consisting of insulin and glucose was given to
Prior to the insulin/glucose challenge, adropin injections induced a subtle but significant increase in the RER (Fig.
AC
C
3A, “pre-INS/GLU”), suggesting preferential oxidation of carbohydrate over fat. The injection of insulin/glucose
induced increases in RER in both the vehicle and the adropin-treated mice, and the increase (“delta”) was more
pronounced in the adropin-pretreated mice than in the vehicle-pretreated controls (Fig. 3A, “post-INS/GLU”).
Total energy expenditure indicated by heat production was not affected by adropin treatment (Fig. 3B, “preINS/GLU”). When the individual levels of substrate oxidation were calculated, adropin-treated mice showed a
trend (P=0.07) of an increase in glucose oxidation and a decrease (P=0.1) in fatty acid oxidation (Fig. 3C and 3D,
“pre-INS/GLU”). Injection of the insulin/glucose mixture induced increases in glucose oxidation level in both the
10
ACCEPTED MANUSCRIPT
Adropin therapy alleviates glucose intolerance
vehicle- and adropin-treated mice, and the adropin-pretreated mice exhibited a greater response (to insulin/glucose)
than the vehicle-pretreated animals (Fig. 3C). In parallel with the enhanced shift towards glucose oxidation, the
decline in fatty acid oxidation following insulin/glucose injection was also enhanced by adropin34-76 treatment (Fig.
RI
PT
3D, “post-INS/GLU”). Taken together, the data suggest that adropin therapy enhances glucose oxidation and
ameliorates metabolic inflexibility of utilizing glucose in obese and insulin resistant mice.
3.3
Adropin treatment enhanced insulin signaling pathways in muscle.
SC
We next investigated whether adropin34-76 treatment would improve insulin signaling actions in skeletal muscle.
The mice were treated employing a protocol similar to that used for the ITT test (Fig. 1B). DIO and the lean
M
AN
U
control mice received five injections of adropin or its vehicle, and a bolus of insulin or saline was given to the
mice. Akt is a key component in insulin intracellular signaling pathways; most studies support an important role
for Akt in insulin-stimulated glucose uptake in muscle [38-40]. In our studies, the insulin-induced increase in Akt
phosphorylation, an indicator of kinase activity, was blunted in the muscle of DIO mice, as compared to the lean
mice (Fig. 4A) [41]. DIO mice treated with adropin exhibited an augmented response relative to DIO mice treated
TE
D
with the vehicle, suggesting an enhanced insulin signaling through Akt (Fig. 4A). Increased phosphorylation of
Akt substrate 160 (AS160) mediates the effect of Akt on insulin-stimulated glucose uptake [42, 43]. Consistent
with previous data [44], insulin-stimulated AS160 phosphorylation (Thr642) was reduced in DIO muscle (Fig 4B).
EP
Adropin treatment partially restored the response to insulin injection (Fig. 4B). The GLUT4 transporter lies
downstream of AS160 action, and is recruited to cell surface following insulin stimulation [45]. In the current
AC
C
study, adropin treatment enhanced insulin-induced cell surface expression of GLUT4 without altering the whole
cell level (Fig. 4C). As the recruitment of GLUT4 to cell surface plays an essential role in mediating insulinstimulated glucose uptake [45], our results suggest adropin treatment has the potential to promote insulin-induced
glucose uptake in muscle.
We also assessed the responses of Akt upstream components including insulin receptor substrate-1 (IRS1) and
phosphatidylinositide-3 kinase (PI3K) [46]. In lean mice, insulin potently induced tyrosine phosphorylation of
IRS1, and increased the level of IRS1-associated p85 subunit of PI3K (Fig. S1A) [41, 47]. Compared to lean
11
ACCEPTED MANUSCRIPT
Adropin therapy alleviates glucose intolerance
muscle, these increases were diminished in muscle of DIO mice (Fig. S1A) [41, 47]. Unexpectedly, adropin pretreatment did not restore the diminished responses of IRS1 and PI3K despite that it enhanced Akt signaling actions
(Fig. S1A and Fig. 4A). These data show that adropin treatment selectively enhanced the distal insulin signaling
in
DIO
mouse
muscle.
PI3K
action
induces
Akt
phosphorylation
through
RI
PT
pathways
producing
phosphatidylinositol-3,4,5-trisphosphate (PIP3), and PIP3 is dephosphorylated by phosphatase and tensin
homologue (PTEN) leading to inhibition of Akt signaling [48]. In our studies, the protein and message levels of
SC
PTEN in muscle of DIO mice were downregulated by adropin treatment (Fig. S1B), which could lead to elevation
of PIP3 level and promote Akt phosphorylation in response to insulin challenge.
M
AN
U
AMP-activated protein kinase (AMPK) can phosphorylate AS160 independent of Akt, contributing to insulinindependent glucose uptake in skeletal muscle [44]. We measured the phosphorylation levels of AMPK and acetylCoA carboxylase (ACC), surrogate makers of AMPK activity, and found no significant changes in these levels
following adropin treatment (Fig. S1C). This suggests that AMPK is not involved in adropin’s metabolic effects in
muscle of DIO mice, consistent with our previous observations [3].
Adropin treatment reduced incomplete fatty acid oxidation (FAO).
TE
D
3.4
Prolonged high fat diet feeding has been shown to cause mitochondrial fatty acid overload in muscle, resulting in
the buildup of incomplete oxidation products [30]. Confirming this argument, our data demonstrated elevated
EP
levels of acid soluble metabolites (ASM) in muscle lysates, which indicates the accumulation of incomplete FAO
products (Fig. 5A). Adropin34-76 treatment reduced the increased ASM level (Fig. 5A), suggesting that adropin
AC
C
action curtailed incomplete FAO promoted by high-fat diet feeding. Concomitantly, there were no changes in the
level of CO2 production in response to adropin injection (Fig. 5B), indicating that complete FAO was not affected
(by adropin). The overall FAO level was also calculated, which showed a decrease following adropin treatment as
compared with the vehicle-treated DIO mice (Fig. 5C).
Similar to what was previously observed in lean mice [3], adropin treatment reduced CPT1 activity (Fig. 5D) and
Cpt1b expression (Fig. 5E) in the muscle of DIO mice. The excessive mitochondrial uptake of fatty acid and the
subsequent β-oxidation can lead to sequestration of free CoA into acetyl-CoA (the end product of β-oxidation),
12
ACCEPTED MANUSCRIPT
Adropin therapy alleviates glucose intolerance
which in turn reduces the CoA/acetyl-CoA ratio [30, 49]. In our studies, adropin treatment increased the
CoA/acetyl-CoA ratio in DIO muscle (Fig. 5F), which would be accounted for by the inhibitory effect of adropin
3.5
RI
PT
treatment on CPT-1-mediated mitochondrial fatty acid uptake.
Adropin treatment increased glucose utilization in skeletal muscle of DIO mice.
In lean mice, an increase in adropin levels upon feeding activates pyruvate dehydrogenase (PDH), a rate-limiting
enzyme in the glucose oxidation pathway [3, 50]. Consistent with previous reports [51], DIO mice exhibited
SC
reduced native PDH activity (Fig. 6A). Importantly, adropin34-76 treatment restored the native PDH activity to the
levels observed in lean controls without changing total activity (Fig. 6A).
M
AN
U
Reversible phosphorylation is a critical mechanism underlying the regulation of PDH activity, with
phosphorylation of specific serine residues in the E1α subunit inhibiting the enzymatic activity [49]. Consistent
with the results of PDH activity assay, adropin treatment decreased the phosphorylation level of a key serine
residue (Ser232) of the E1α subunit (Fig. 6B). In addition to phosphorylation, acetylation adds another layer of
regulation of PDH activity [37]. Recent evidence demonstrates that in muscle, hyperacetylation of PDH E1α is
TE
D
associated with inhibition of PDH activity [37]. We therefore measured the acetylation level of PDH E1α, and
observed a decrease following adropin treatment (Fig. 6B). It is expected that this hypoacetylation would
contribute to the adropin-induced activation of PDH. SIRT3 is a primary NAD+ dependent deacetylase in the
EP
mitochondrion [52], and the E1α subunit of PDH is a substrate of SIRT3 [37]. We then investigated whether
adropin treatment would impact SIRT3, thus leading to the altered acetylation level of PDH E1α subunit. The
AC
C
expression of SIRT3 protein is regulated by diet signals, and the level in muscle is reduced by high-fat diet feeding
(Fig. S2A) [53]. Following adropin treatment, the reduced level of SIRT3 protein in DIO mice was not affected
(Fig. S2A), which indicates that adropin may affect SIRT3 activity through mechanisms other than altering protein
abundance.
In muscle, PDK-4 is a major PDK isoform that phosphorylates the serine residues of the E1α subunit to suppress
PDH activity [49, 54]. Altered gene expression is a common mechanism regulating PDK-4 activity [51, 55]. Our
results first confirmed the previous finding of the increased PDK4 protein in DIO muscle [51], and further showed
13
ACCEPTED MANUSCRIPT
Adropin therapy alleviates glucose intolerance
that adropin treatment reduced the levels of PDK4 message and protein (Fig. 6C). In parallel with downregulating
PDK-4 expression, adropin treatment did not affect the protein level of PDK-2 (Fig. 6C) that is another isoform
expressed in muscle [56]. Thus, adropin action appears to selectively impact PDK-4 expression in DIO mouse
RI
PT
muscle, which is consistent with adropin’s isoform-selective effect on PDK that is previously observed in lean
mice [3].
Elevated levels of pyruvate oxidation can inhibit FAO at the level of CPT-1, which is in part due to the increased
SC
production of pyruvate-derived malonyl-CoA [29]. Following adropin treatment, malonyl-CoA level in DIO
muscle was not altered (Fig. S2), suggesting that adropin-induced FAO is not secondary to PDH activation.
M
AN
U
We next investigated whether adropin treatment affects non-oxidative glucose disposal pathways including
glycolysis and glycogen synthesis. Metabolic profiling analysis demonstrated that the levels of 2-phosphoglycerate
(an intermediate in glycolysis) and lactate (end product of glycolysis) were increased following adropin treatment
(supplementary data, Table 1), which indicates adropin treatment may increase glycolytic flux. Furthermore,
adropin treatment partially restored glycogen level in DIO muscle to that observed in the lean mice (Fig. S3). In
TE
D
addition, adropin-treated mice also had increased levels of mannose and fructose in muscle (supplementary data,
Table 1), which may originate from the increased utilization of sucrose contained in the high-fat diet. Taken
together, our data suggest that adropin actions increases glucose flux in DIO muscle through both oxidative and
3.6
EP
non-oxidative pathways.
Adropin treatment reduced PGC-1α in DIO muscle.
AC
C
The transcriptional co-activator PGC-1α regulates the expression of genes involved in oxidative metabolism [57],
and appears to be involved in the adropin-mediated physiological control of fuel selection [3]. DIO mice treated
with adropin34-76 exhibited reduced message and protein levels of PGC-1α (Fig. 7), which may account for the
suppressions of Cpt1b and Pdk4 that are downstream targets of PGC-1α [58-61]. We previously reported that
adropin-induced changes in PGC-1α did not alter mitochondrial content and oxidative capacity [3]. Here, we
presented similar results in muscle of DIO mice. Citrate synthase activity, a marker of mitochondrial content [62],
expression of mitochondrial transcription factor A (mtTfa) that is proportional to mtDNA copy number [63], and
14
ACCEPTED MANUSCRIPT
Adropin therapy alleviates glucose intolerance
mitochondrial oxygen consumption indicating oxidative capacity were not altered by adropin treatment (Fig. S4A,
S4B and S4C).
Adropin treatment did not increase levels of fatty acid intermediates in muscle.
RI
PT
3.7
Suppressing CPT-1 activity might cause intracellular accumulation of lipids that could also affect insulin
sensitivity [64]. The levels of long-chain acyl-CoA’s, ceramide and triacylglycerol were all increased in DIO
muscle compared to lean mice; however, adropin34-76 treatment did not affect their levels (Fig. 8A). Diacylglycerol
SC
levels were also not altered by adropin treatment (fold change: adropin/vehicle =1.01, P>0.05).
Inhibition of CPT-1B can induce compensatory suppression of CD36 [32] that is a major fatty acid transporter in
M
AN
U
muscle [65]. Indeed, the mRNA and whole cellular protein levels of Cd36 were decreased by adropin treatment
(Fig.8D). These data demonstrate that adropin actions down regulated Cd36 gene expression. In parallel with the
downregulation of expression, the CD36 protein level in the cell surface was also decreased by adropin treatment,
which indicates that adropin treatment may reduce muscle fatty acid uptake. It further follows that the potential
activity by adropin treatment.
TE
D
reduced fatty acid uptake prevents the increases in intramuscular lipid levels resulting from the inhibition of CPT-1
Cd36-deficient mice exhibit increased level of plasma free fatty acids [65]. In spite of the reduced levels of CD36
in muscle, adropin treatment did not affect the plasma levels of fatty acid (fold change, adropin/vehicle: ranging
EP
from 1.00 to 1.15, P>0.05). Interestingly, we found that the hepatic malonyl-CoA level in adropin-treated DIO
exhibited a strong trend towards decrease (nmole/g; adr.: 1.4±0.1 vs. veh.: 2.5±0.7). As malonyl-CoA is an
AC
C
allosteric inhibitor of CPT-1 [29], and liver is another key organ metabolizing fatty acids, adropin treatment might
activate hepatic FAO, thus leading to an increase in fatty acid clearance from blood.
3.8
Adropin treatment did not alter phosphorylation of JNK and IKK kinase.
Mitochondrial fatty acid overload may produce oxidative stress that impairs insulin signaling actions by activating
c-Jun NH2 terminal kinase (JNK) and inhibitor kappa B kinase (IKK) [30, 66, 67]. The JNK/IKK kinases inhibit
insulin-induced tyrosine phosphorylation of insulin receptor substrates (IRS) [68]. In our studies, we measured the
15
ACCEPTED MANUSCRIPT
Adropin therapy alleviates glucose intolerance
phosphorylation levels, surrogate markers of the enzymatic activity [69], of these two kinases. Adropin treatment
did not affect the phosphorylation levels, as compared with the vehicle-treated DIO mice, which suggests that
adropin actions did not impact the activity of JNK or IKK (Fig. S5). These results are consistent with the finding
3.9
RI
PT
(Fig. S1A) that adropin treatment did not restore the response of IRS1 phosphorylation upon insulin challenge.
Adropin treatment was associated with increased Notch signaling in skeletal muscle.
A recent report suggested that adropin retained in the plasma membrane modulates Notch1 signaling pathway [5].
SC
We tested this hypothesis by measuring the expression levels of Hair and Enhancer of split (Hes), a prototypical
target gene of Notch signaling [70]. In DIO mice, adropin34-76 treatment increased Hes1 mRNA level in muscle
M
AN
U
(Fig. S6A), indicating stimulation of Notch signaling pathways. We also measured Hes1 mRNA in skeletal muscle
of adropin transgenic overexpression and knockout mice maintained on regular chow diet. The level of Hes1
mRNA was increased in adropin overexpressing transgenic mice (Fig. S6B), and was decreased in the adropin
knockout mice (Fig. S6C). These data are consistent with the previous report showing that overexpression of
adropin in cultured cells upregulates Hes1 mRNA level [5]. Moreover, Hes1 expression in the cerebellum was
TE
D
decreased in adropin knockout mice [5], which is also consistent with our findings. Here, our study using
adropin34-76 treatment indicates that circulating adropin may also interact with Notch signaling pathways in muscle.
DISCUSSION
EP
4.0
AC
C
4.1 Adropin therapy enhanced oxidative glucose disposal while limiting fat oxidation
This report extends our recent findings on adropin’s physiological role of regulating muscle substrate oxidation,
investigating the metabolic actions of adropin treatment in DIO mouse muscle. Adropin34-76 therapy reduced Cpt1b
expression contributing to the inhibition of CPT-1B, and decreased Pdk4 expression contributing to the activation
of PDH, in muscle of DIO mice. Furthermore, adropin treatment decreased Cd36 expression levels, with a
potential consequence of reducing muscle fatty acid uptake. Associated with the reduced expressions of these
proteins is the downregulation of transcriptional co-activator PGC-1α, a transcription co-activator that regulates
16
ACCEPTED MANUSCRIPT
Adropin therapy alleviates glucose intolerance
the expression of Cpt1b, Pdk4 and Cd36 genes [58-60, 71]. Thus, the downregulation of PGC-1α would lead to a
reduction of its transcriptional activity, which could in part account for the suppressed expressions of the target
genes.
RI
PT
The mechanisms underlying adropin-induced downregulation of PGC-1α are elusive. However, one potential
mechanism may involve Notch1 signaling. Hes1, the canonical Notch target, acts as a transcriptional repressor,
and physically binds to the promoter region of PGC-1α, thereby suppressing its expression [72]. In our studies,
SC
associated with repressing PGC-1αexpression, adropin treatment upregulated Hes1 expression. It follows that
adropin action might inhibit PGC-1α expression in DIO muscle through activating Notch1 signaling pathway. How
M
AN
U
adropin alters notch signaling is not clear, while a direct physical interaction between adropin34-76 and the
membrane bound proteins that constitute the notch signaling pathway has likewise not been established. Future
studies determining whether adropin physically interacts with the notch signaling network and how this interaction
alters signaling are clearly needed.
TE
D
In our previous report, adropin’s actions induce hyperacetylation of PGC-1α protein (inhibiting the transcriptional
activity) without altering its expression; a response that may involve downregulation of SIRT1 protein [3]. In the
current study, SIRT1 protein levels in DIO mice were too low to be reliably detected. This finding is consistent
with the results of a previous study reporting that high-fat diet markedly reduces SIRT1 expression in muscle [73].
EP
We nevertheless attempted measurements of nuclear SIRT deacetylase activity in DIO mice, finding no changes in
response to adropin treatment (in AFU/min/µg protein; vehicle-treated: 2.4±0.29, adropin-treated: 2.2±0.47). Thus,
AC
C
in skeletal muscle of DIO mice, SIRT1 does not seem to be involved in adropin’s action on PGC-1α. One
interpretation for the lack of change in SIRT1 level is that basal levels of SIRT1 in DIO muscle are already very
low, with no further reductions either elicited or detected in response to adropin treatment.
Adropin34-76 treatment increased PDH activity in the muscle of DIO mice. Here, we discuss several mechanisms
underlying this effect supported by our data. First, adropin’s effect on PDK-4 expression is expected to play a role
in the activation of PDH. Adropin treatment, likely through downregulating PGC-1α, decreased PDK4 expression
17
ACCEPTED MANUSCRIPT
Adropin therapy alleviates glucose intolerance
which would then reduce its enzymatic activity. Moreover, adropin treatment increased the CoA/acetyl-CoA ratio,
which allosterically inhibits PDK4 activity [3, 29, 74]. Together, the reduced PDK4 activity decreases the
phosphorylation levels of the E1α subunit, increasing PDH activity. In addition, acetylation of E1α subunit is
RI
PT
negatively associated with PDH enzymatic activity [37]. The decreased acetylation of the E1a subunit by
adropin34-76 thus provides another mechanism underlying the activation of PDH. Finally, the increase in the ratio of
CoA/acetyl-CoA (by adropin treatment) would directly promote PDH activity and pyruvate oxidation [3, 29].
SC
4.2 Adropin therapy improved mitochondrial function
A recent report proposed that mitochondrial fatty acid overload contributes to the development of diet-induced
M
AN
U
glucose intolerance and insulin resistance [30]. High-fat diet feeding augments muscle mitochondrial fatty acid
uptake, resulting in an increased load of βoxidative pathway [30, 31]. In the presence of this overload, several
adaptive metabolic responses were initiated, including upregulations of the capacity of β-oxidation and
tricarboxylic acid (TCA) cycle [75]. These adaptive responses support an increased flux through β-oxidation
TE
D
pathway. However, the excessive β-oxidation can exceed the TCA cycle capacity, resulting in the accumulation of
incompletely oxidized fatty acid intermediates [30, 31]. In mitochondria, the elevation of incomplete FAO fosters a
metabolic environment that favors sequestration of free CoA into acetyl-CoA [30, 31], which ultimately results in
a reduction of CoA/acetyl-CoA ratio. The decrease in CoA/acetyl-CoA has marked impacts on mitochondrial
EP
function, with one effect, as mentioned above, being the inhibition of PDH activity [30]. Here, our data
demonstrated that adropin treatment reduced the elevated level of incomplete FAO in DIO muscle, which is likely
AC
C
a combined effect of the downregulation of CD36 and the reduction of CPT-1 activity. In turn, the resulting
decrease in incomplete β-oxidation would augment the CoA/acetyl-CoA ratio, which would then attenuate the
impairment of mitochondrial function of substrate oxidation associated with excessive β−oxidation.
Adropin therapy may also have regulated the ratio of NAD+ to NADH, which we speculate to provide an additional
mechanism underlying the observed activation of PDH. Excessive β-oxidation in the DIO condition tends to
reduce the ratio of NAD+ to NADH in mitochondria, which would promote activation of PDK4 and inhibit PDH
18
ACCEPTED MANUSCRIPT
Adropin therapy alleviates glucose intolerance
[30, 76]. Moreover, a reduction in NAD+ would also restrict SIRT3 activity, thus impacting the acetylation levels
of mitochondrial proteins including the PDH E1α subunit [37]. By reducing CPT-1B activity in muscle, adropin
treatment has the potential to reverse the above effects that are associated with the excessive β-oxidation, thereby
RI
PT
promoting PDH activity.
Thus, our data support the hypothesis [30, 32] that limiting muscle mitochondrial fatty acid overload may be an
effective strategy to ameliorate mitochondrial dysfunction with respect to substrate oxidation. Indeed, a growing
SC
body of evidence is in line with our finding that the inhibition of CPT-1 activity can boost the diminished PDH
activity under DIO condition. For example, treatment of DIO mice with the CPT-1B-selective inhibitor oxfenicine
M
AN
U
activates PDH in muscle [32]. In addition to the pharmacological intervention, raising the level of malonyl-CoA, a
physiological inhibitor of CPT-1, has also been employed to inhibit CPT-1 activity and elevate the PDH activity or
glucose oxidation. The malonyl-CoA decarboxylase (MCD) knockout mice that have an increased malonyl-CoA
level exhibited a preferential oxidation of glucose over fatty acid [30]. In human skeletal muscle cells, silencing
TE
D
MCD (resulting in an increase in malonyl-CoA level) augments cellular glucose oxidation level [77].
As PDH plays the gate-keeping role in glucose oxidation pathway, the activation of PDH in muscle underlies the
increased whole body carbohydrate oxidation following adropin treatment. Furthermore, consistent with a previous
report [32], the increase in glucose oxidation in muscle can greatly enhance whole body glucose tolerance. The
EP
notion that PDH activity state per se impacts glucose homeostasis is supported by several findings. The
oxfenicine-treated DIO mice exhibited an improvement of glucose tolerance, which is in part due to the activation
AC
C
of muscle PDH [32]. Pdk4-deficient mice exhibit increased PDH activity and glucose oxidation in muscle, and
have enhanced glucose tolerance [78]. Moreover, treatment of hyperglycemic Zucker fatty rats with PDK isoformselective inhibitors reduces blood glucose levels [78]. Finally, reduced PDH activity in muscle-specific carnitine
acetyltransferase knockout mice compromises glucose tolerance [79]. In contrast, carnitine supplementation
alleviates inhibition of PDH activity in the insulin resistant state, and improves glucose homeostasis [79].
4.3 Adropin therapy enhanced insulin actions via a non-canonical pathway
19
ACCEPTED MANUSCRIPT
Adropin therapy alleviates glucose intolerance
Adropin34-76 therapy enhanced muscle insulin signaling actions, an effect that would also be expected to
significantly contribute to the improved glucose tolerance. Treatment of DIO mice with adropin increased insulinstimulated cell surface GLUT4 expression, indicating a potential increase in muscle glucose uptake upon insulin.
RI
PT
Associated with the enhanced response of GLUT4 are the augmented insulin-induced phosphorylations of Akt and
AS160, two upstream mediators involved in GLUT4 translocation in insulin signaling pathways. Interestingly,
adropin pretreatment did not increase insulin-induced IRS1 phosphorylation and PI-3K recruitment to IRS1, the
SC
canonical insulin intracellular signaling pathway [80]. This selective modulation of the distal segment of insulin
signaling pathway is not unprecedented. One study reported amelioration of hyperglycemia associated with the
M
AN
U
enhanced insulin-induced responses of Akt and GLUT4 translocation, without changes in IRS1 phosphorylation
[33]. In our studies, adropin treatment appears to sensitize Akt response to insulin by downregulating PTEN with a
potential increase in the basal level of PIP3. Thus, although PI3K was not effectively recruited upon insulin
stimulation in the adropin-treated DIO mice, the inhibition of PTEN may raise the level of PIP3 above a threshold
required for triggering the insulin-induced Akt phosphorylation and activation. Mechanistically, the Notch
TE
D
signaling might mediate the effect of adropin treatment on PTEN expression. Activation of Notch signaling can
exert an inhibitory effect on Pten expression [81, 82], which is mediated by Hes1 that binds to the regulatory
sequence in the promoter region in Pten gene [81].
EP
The view of improving insulin sensitivity and glucose homeostasis by restricting mitochondrial fatty acid uptake
seems to contradict the traditional idea [83] that promotion of mitochondrial FAO alleviates insulin resistance. The
AC
C
increase in mitochondrial FAO is generally believed to have the ability of lowering the level of cytosolic bioactive
lipid intermediates, thereby enhancing insulin sensitivity [64, 83]. This argument has been supported by the finding
that activation of muscle CPT-1 alleviates insulin resistance in high fat diet-fed animals [83]. In that report, CPT-1
activation increased FAO level, and reduced the amounts of intramuscular lipid intermediates [83]. In contrast, in
the current report, the inhibition of CPT-1 by adropin treatment did not result in the elevation of the cellular
bioactive lipid levels, which seems to be paradoxical to the changes found in the CPT-1 overexpression study [83].
In our studies, adropin treatment reduced whole cellular as well as cell surface Cd36 expression levels, and these
20
ACCEPTED MANUSCRIPT
Adropin therapy alleviates glucose intolerance
changes indicates a potential reduction of muscle fatty acid uptake [32]. We propose that the downregulation of
CD36 would play a key role in preventing the cellular levels of lipid intermediates from rising in response to
adropin treatment. Interestingly, the similar findings have been demonstrated in some other reports employing
RI
PT
inhibition of CPT-1 as an approach to improve glucose homeostasis. Oxfenicine treatment also results in a
downregulation of plasma membrane level of CD36 [32], and MCD silencing in human muscle cells is associated
with a reduced expression of fatty acid transport protein (Fatp) and a decreased palmitate uptake [77]. On the other
SC
hand, the CPT-1 overexpression study [83] also does not contradict the hypothesis that preventing mitochondrial
overload has beneficial effects on glucose tolerance and insulin sensitivity. We speculate that the activation of
M
AN
U
muscle CPT-1 in that study did not elevate mitochondrial fatty acid uptake to a level that β-oxidation exceeds the
capacity of the TCA cycle. As a result, the incomplete oxidation had not been significantly developed, and
consequently, the CoA/acetyl-CoA ratio was maintained, leaving no major effect on the activity of PDH. Indeed,
this prediction is supported by the finding that the levels of the incompletely oxidized fatty acid intermediates were
not significantly increased following the overexpression of CPT-1 [83].
TE
D
Taken together, these results demonstrate that the coordinated actions on metabolic pathways produce different
physiological outcomes from uncoordinated or isolated actions. To further support this argument, the paradoxical
effect of muscle-specific overexpression of PGC-1α on insulin sensitivity provides another example [84]. In this
EP
study, the increased expression of PGC-1α in muscle unexpectedly resulted in insulin resistance [84]. It should be
particularly noted that, in parallel with the increased mitochondrial oxidative capacity, Cd36 levels were also
AC
C
elevated by PGC-1α overexpression [84]. The upregulation of Cd36 would facilitate fatty acid uptake, which may
lead to accumulation of toxic lipid intermediates, and thus the impairment of insulin sensitivity [84]. However,
adropin treatment appears to initiate coordinated actions on fuel-handling proteins, which maintains intramuscular
lipid levels while preserves insulin control of glucose metabolism.
In the current and previous reports, we have focused on the metabolic effects of adropin on skeletal muscle.
Besides muscle, adropin also regulates endothelial function [6]. Notably, adropin treatment induces activation of
endothelial nitric oxide synthase (eNOS) that produces nitric oxide, a critical endogenous vasodilator [6, 85]. In
21
ACCEPTED MANUSCRIPT
Adropin therapy alleviates glucose intolerance
our studies, the observed improvements of glucose and insulin tolerance may stem partly from the potential effect
of adropin on vasodilation in the muscle. The consequent enhancement of blood perfusion can increase glucose
availability, which could augment glucose metabolism.
RI
PT
4.4 Summary
The current study provides a molecular basis for the improvements in glucose homeostasis that are observed with
adropin treatment. Our data suggest that skeletal muscle is a major organ target in mediating these effects,
SC
although actions involving other insulin-target organs are possible and further investigation is clearly warranted.
These data support the notion that adropin may be a promising drug target in developing treatments against diet-
AC
C
EP
TE
D
M
AN
U
induced dysregulation of glucose homeostasis and insulin resistance.
22
ACCEPTED MANUSCRIPT
Adropin therapy alleviates glucose intolerance
Acknowledgements. This work was supported by a Proof of Principle Award from Novo Nordisk’s Diabetes
Innovation Award Program (A.A.B.), the National Institute of Diabetes and Digestive and Kidney Diseases (R01-
and a grant from the Canadian Diabetes Association (to G.D.L.).
RI
PT
DK-078765 to M.W.H), the American Diabetes Association (1-13-CE-16 to M.W.H. and 7-08-RA-16 to A.A.B.)
M
AN
U
SC
Author contributions. S.G. and A.A.B. contributed to the study concept and design, data analysis and
interpretation, and writing of the manuscript. R.P.M. and M.W.H. contributed to the collection of data, data
interpretation, and reviewed the manuscript. Q.Z. and G.D.L. contributed with technical assistance and data
collection and reviewed the manuscript. S.G. and A.A.B. are the guarantors of this work and, as such, had full
access to all the data in the study and take responsibility for the integrity and accuracy of data analysis.
AC
C
EP
TE
D
Conflict of Interest. A.A.B. was supported by a Proof of Principle Award from Novo Nordisk’s Diabetes
Innovation Award Program. No other potential conflicts of interest relevant to this article were reported.
23
ACCEPTED MANUSCRIPT
Adropin therapy alleviates glucose intolerance
References
AC
C
EP
TE
D
M
AN
U
SC
RI
PT
[1] Goetze, J. P., Albrethsen, J. Adropin: a new regulatory peptide in cardiovascular endocrinology.
Regulatory peptides. 2014,190-191:41-2.
[2] Aydin, S. Three new players in energy regulation: preptin, adropin and irisin. Peptides.
2014,56:94-110.
[3] Gao, S., McMillan, R. P., Jacas, J., Zhu, Q., Li, X., Kumar, G. K., et al. Regulation of Substrate
Oxidation Preferences in Muscle by the Peptide Hormone Adropin. Diabetes. 2014.
[4] Kumar, K. G., Trevaskis, J. L., Lam, D. D., Sutton, G. M., Koza, R. A., Chouljenko, V. N., et al.
Identification of adropin as a secreted factor linking dietary macronutrient intake with energy
homeostasis and lipid metabolism. Cell Metab. 2008,8:468-81.
[5] Wong, C.-M., Wang, Y., Lee, J. T. H., Huang, Z., Wu, D., Xu, A., et al. Adropin Is a Brain Membranebound Protein Regulating Physical Activity via the NB-3/Notch Signaling Pathway in Mice. Journal
of Biological Chemistry. 2014,289:25976-86.
[6] Lovren, F., Pan, Y., Quan, A., Singh, K. K., Shukla, P. C., Gupta, M., et al. Adropin is a novel
regulator of endothelial function. Circulation. 2010,122:S185-92.
[7] Yu, H. Y., Zhao, P., Wu, M. C., Liu, J., Yin, W. Serum adropin levels are decreased in patients with
acute myocardial infarction. Regulatory peptides. 2014,190-191:46-9.
[8] Yildirim, B., Celik, O., Aydin, S. Adropin: a key component and potential gatekeeper of metabolic
disturbances in policystic ovarian syndrome. Clinical and experimental obstetrics & gynecology.
2014,41:310-2.
[9] Wu, L., Fang, J., Chen, L., Zhao, Z., Luo, Y., Lin, C., et al. Low serum adropin is associated with
coronary atherosclerosis in type 2 diabetic and non-diabetic patients. Clinical chemistry and
laboratory medicine : CCLM / FESCC. 2014,52:751-8.
[10] St-Onge, M. P., Shechter, A., Shlisky, J., Tam, C. S., Gao, S., Ravussin, E., et al. Fasting plasma
adropin concentrations correlate with fat consumption in human females. Obesity. 2014,22:105663.
[11] Sayin, O., Tokgoz, Y., Arslan, N. Investigation of adropin and leptin levels in pediatric obesityrelated nonalcoholic fatty liver disease. Journal of pediatric endocrinology & metabolism : JPEM.
2014,27:479-84.
[12] Qiu, X., He, J. R., Zhao, M. G., Kuang, Y. S., Xu, S. Q., Zhang, H. Z., et al. Relationship between
human cord blood adropin levels and fetal growth. Peptides. 2014,52:19-22.
[13] Demircelik, B., Cakmak, M., Nazli, Y., Gurel, O. M., Akkaya, N., Cetin, M., et al. Adropin: a new
marker for predicting late saphenous vein graft disease after coronary artery bypass grafting.
Clinical and investigative medicine. Medecine clinique et experimentale. 2014,37:E338.
[14] Aydin, S., Kuloglu, T., Aydin, S., Kalayci, M., Yilmaz, M., Cakmak, T., et al. Elevated adropin: a
candidate diagnostic marker for myocardial infarction in conjunction with troponin-I. Peptides.
2014,58:91-7.
[15] Topuz, M., Celik, A., Aslantas, T., Demir, A. K., Aydin, S., Aydin, S. Plasma adropin levels predict
endothelial dysfunction like flow-mediated dilatation in patients with type 2 diabetes mellitus.
Journal of investigative medicine : the official publication of the American Federation for Clinical
Research. 2013,61:1161-4.
[16] Gozal, D., Kheirandish-Gozal, L., Bhattacharjee, R., Molero-Ramirez, H., Tan, H. L., Bandla, H. P.
Circulating adropin concentrations in pediatric obstructive sleep apnea: potential relevance to
endothelial function. The Journal of pediatrics. 2013,163:1122-6.
24
ACCEPTED MANUSCRIPT
Adropin therapy alleviates glucose intolerance
AC
C
EP
TE
D
M
AN
U
SC
RI
PT
[17] Celik, E., Yilmaz, E., Celik, O., Ulas, M., Turkcuoglu, I., Karaer, A., et al. Maternal and fetal
adropin levels in gestational diabetes mellitus. Journal of perinatal medicine. 2013,41:375-80.
[18] Celik, A., Balin, M., Kobat, M. A., Erdem, K., Baydas, A., Bulut, M., et al. Deficiency of a new
protein associated with cardiac syndrome X; called adropin. Cardiovascular therapeutics.
2013,31:174-8.
[19] Aydin, S., Kuloglu, T., Aydin, S., Eren, M. N., Yilmaz, M., Kalayci, M., et al. Expression of adropin
in rat brain, cerebellum, kidneys, heart, liver, and pancreas in streptozotocin-induced diabetes.
Molecular and cellular biochemistry. 2013,380:73-81.
[20] Ganesh Kumar, K., Zhang, J., Gao, S., Rossi, J., McGuinness, O. P., Halem, H. H., et al. Adropin
deficiency is associated with increased adiposity and insulin resistance. Obesity. 2012,20:1394402.
[21] Butler, A. A., Tam, C. S., Stanhope, K. L., Wolfe, B. M., Ali, M. R., O'Keeffe, M., et al. Low
circulating adropin concentrations with obesity and aging correlate with risk factors for metabolic
disease and increase after gastric bypass surgery in humans. J Clin Endocrinol Metab.
2012,97:3783-91.
[22] Lian, W., Gu, X., Qin, Y., Zheng, X. Elevated plasma levels of adropin in heart failure patients.
Internal medicine. 2011,50:1523-7.
[23] Bremer, A. A., Stanhope, K. L., Graham, J. L., Cummings, B. P., Ampah, S. B., Saville, B. R., et al.
Fish oil supplementation ameliorates fructose-induced hypertriglyceridemia and insulin resistance
in adult male rhesus macaques. The Journal of nutrition. 2014,144:5-11.
[24] Kuhla, A., Hahn, S., Butschkau, A., Lange, S., Wree, A., Vollmar, B. Lifelong caloric restriction
reprograms hepatic fat metabolism in mice. The journals of gerontology. Series A, Biological
sciences and medical sciences. 2014,69:915-22.
[25] Partridge, C. G., Fawcett, G. L., Wang, B., Semenkovich, C. F., Cheverud, J. M. The effect of dietary
fat intake on hepatic gene expression in LG/J AND SM/J mice. BMC genomics. 2014,15:99.
[26] McGarry, J. D., Brown, N. F. The mitochondrial carnitine palmitoyltransferase system. From
concept to molecular analysis. Eur J Biochem. 1997,244:1-14.
[27] Otero, Y. F., Stafford, J. M., McGuinness, O. P. Pathway-selective Insulin Resistance and
Metabolic Disease: The Importance of Nutrient Flux. The Journal of biological chemistry.
2014,289:20462-9.
[28] Randle, P. J., Garland, P. B., Hales, C. N., Newsholme, E. A. The glucose fatty-acid cycle. Its role in
insulin sensitivity and the metabolic disturbances of diabetes mellitus. Lancet. 1963,1:785-9.
[29] Hue, L., Taegtmeyer, H. The Randle cycle revisited: a new head for an old hat. American
journal of physiology. Endocrinology and metabolism. 2009,297:E578-91.
[30] Koves, T. R., Ussher, J. R., Noland, R. C., Slentz, D., Mosedale, M., Ilkayeva, O., et al. Mitochondrial
overload and incomplete fatty acid oxidation contribute to skeletal muscle insulin resistance. Cell
Metab. 2008,7:45-56.
[31] Muoio, D. M., Newgard, C. B. Fatty acid oxidation and insulin action: when less is more.
Diabetes. 2008,57:1455-6.
[32] Keung, W., Ussher, J. R., Jaswal, J. S., Raubenheimer, M., Lam, V. H., Wagg, C. S., et al. Inhibition
of carnitine palmitoyltransferase-1 activity alleviates insulin resistance in diet-induced obese mice.
Diabetes. 2013,62:711-20.
[33] Lusk, G. ANIMAL CALORIMETRY: Twenty-Fourth Paper. ANALYSIS OF THE OXIDATION OF
MIXTURES OF CARBOHYDRATE AND FAT. Journal of Biological Chemistry. 1924,59:41-2.
25
ACCEPTED MANUSCRIPT
Adropin therapy alleviates glucose intolerance
AC
C
EP
TE
D
M
AN
U
SC
RI
PT
[34] Araujo, E. P., De Souza, C. T., Gasparetti, A. L., Ueno, M., Boschero, A. C., Saad, M. J., et al. Shortterm in vivo inhibition of insulin receptor substrate-1 expression leads to insulin resistance,
hyperinsulinemia, and increased adiposity. Endocrinology. 2005,146:1428-37.
[35] Hulver, M. W., Berggren, J. R., Cortright, R. N., Dudek, R. W., Thompson, R. P., Pories, W. J., et al.
Skeletal muscle lipid metabolism with obesity2003.
[36] Morillas, M., Gomez-Puertas, P., Roca, R., Serra, D., Asins, G., Valencia, A., et al. Structural model
of the catalytic core of carnitine palmitoyltransferase I and carnitine octanoyltransferase (COT):
mutation of CPT I histidine 473 and alanine 381 and COT alanine 238 impairs the catalytic activity.
The Journal of biological chemistry. 2001,276:45001-8.
[37] Jing, E., O’Neill, B. T., Rardin, M. J., Kleinridders, A., Ilkeyeva, O. R., Ussar, S., et al. Sirt3
Regulates Metabolic Flexibility of Skeletal Muscle through Reversible Enzymatic Deacetylation.
Diabetes. 2013.
[38] Welsh, G. I., Hers, I., Berwick, D. C., Dell, G., Wherlock, M., Birkin, R., et al. Role of protein kinase
B in insulin-regulated glucose uptake. Biochem Soc Trans. 2005,33:346-9.
[39] Cho, H., Mu, J., Kim, J. K., Thorvaldsen, J. L., Chu, Q., Crenshaw, E. B., 3rd, et al. Insulin resistance
and a diabetes mellitus-like syndrome in mice lacking the protein kinase Akt2 (PKB beta). Science.
2001,292:1728-31.
[40] Kruszynska, Y. T., Worrall, D. S., Ofrecio, J., Frias, J. P., Macaraeg, G., Olefsky, J. M. Fatty acidinduced insulin resistance: decreased muscle PI3K activation but unchanged Akt phosphorylation.
J Clin Endocrinol Metab. 2002,87:226-34.
[41] Morino, K., Neschen, S., Bilz, S., Sono, S., Tsirigotis, D., Reznick, R. M., et al. Muscle-Specific IRS1 Ser→Ala Transgenic Mice Are Protected From Fat-Induced Insulin Resistance in Skeletal Muscle.
Diabetes. 2008,57:2644-51.
[42] Kramer, H. F., Witczak, C. A., Taylor, E. B., Fujii, N., Hirshman, M. F., Goodyear, L. J. AS160
regulates insulin- and contraction-stimulated glucose uptake in mouse skeletal muscle. The Journal
of biological chemistry. 2006,281:31478-85.
[43] Kramer, H. F., Witczak, C. A., Fujii, N., Jessen, N., Taylor, E. B., Arnolds, D. E., et al. Distinct
signals regulate AS160 phosphorylation in response to insulin, AICAR, and contraction in mouse
skeletal muscle. Diabetes. 2006,55:2067-76.
[44] Funai, K., Song, H., Yin, L., Lodhi, I. J., Wei, X., Yoshino, J., et al. Muscle lipogenesis balances
insulin sensitivity and strength through calcium signaling. The Journal of clinical investigation.
2013.
[45] Zisman, A., Peroni, O. D., Abel, E. D., Michael, M. D., Mauvais-Jarvis, F., Lowell, B. B., et al.
Targeted disruption of the glucose transporter 4 selectively in muscle causes insulin resistance and
glucose intolerance. Nat Med. 2000,6:924-8.
[46] Saltiel, A. R., Kahn, C. R. Insulin signalling and the regulation of glucose and lipid metabolism.
Nature. 2001,414:799-806.
[47] Anai, M., Funaki, M., Ogihara, T., Kanda, A., Onishi, Y., Sakoda, H., et al. Enhanced insulinstimulated activation of phosphatidylinositol 3-kinase in the liver of high-fat-fed rats. Diabetes.
1999,48:158-69.
[48] Hers, I., Vincent, E. E., Tavare, J. M. Akt signalling in health and disease. Cellular signalling.
2011,23:1515-27.
[49] Holness, M. J., Sugden, M. C. Regulation of pyruvate dehydrogenase complex activity by
reversible phosphorylation. Biochem Soc Trans. 2003,31:1143-51.
26
ACCEPTED MANUSCRIPT
Adropin therapy alleviates glucose intolerance
AC
C
EP
TE
D
M
AN
U
SC
RI
PT
[50] Sugden, M. C., Holness, M. J. Recent advances in mechanisms regulating glucose oxidation at
the level of the pyruvate dehydrogenase complex by PDKs. American Journal of Physiology Endocrinology And Metabolism. 2003,284:E855-E62.
[51] Holness, M. J., Kraus, A., Harris, R. A., Sugden, M. C. Targeted upregulation of pyruvate
dehydrogenase kinase (PDK)-4 in slow-twitch skeletal muscle underlies the stable modification of
the regulatory characteristics of PDK induced by high-fat feeding. Diabetes. 2000,49:775-81.
[52] Lombard, D. B., Alt, F. W., Cheng, H.-L., Bunkenborg, J., Streeper, R. S., Mostoslavsky, R., et al.
Mammalian Sir2 Homolog SIRT3 Regulates Global Mitochondrial Lysine Acetylation. Molecular and
Cellular Biology. 2007,27:8807-14.
[53] Palacios, O. M., Carmona, J. J., Michan, S., Chen, K. Y., Manabe, Y., Ward, J. L., 3rd, et al. Diet and
exercise signals regulate SIRT3 and activate AMPK and PGC-1alpha in skeletal muscle. Aging.
2009,1:771-83.
[54] Rardin, M. J., Wiley, S. E., Naviaux, R. K., Murphy, A. N., Dixon, J. E. Monitoring phosphorylation
of the pyruvate dehydrogenase complex. Anal Biochem. 2009,389:157-64.
[55] Sugden, M. C., Howard, R. M., Munday, M. R., Holness, M. J. Mechanisms involved in the
coordinate regulation of strategic enzymes of glucose metabolism. Adv Enzyme Regul. 1993,33:7195.
[56] Bowker-Kinley, M., Davis, W., Wu, P., HARRIS, R., POPOV, K. Evidence for existence of tissuespecific regulation of the mammalian pyruvate dehydrogenase complex. Biochem. j. 1998,329:1916.
[57] Lin, J., Handschin, C., Spiegelman, B. M. Metabolic control through the PGC-1 family of
transcription coactivators. Cell Metabolism. 2005,1:361-70.
[58] Wende, A. R., Huss, J. M., Schaeffer, P. J., Giguere, V., Kelly, D. P. PGC-1alpha coactivates PDK4
gene expression via the orphan nuclear receptor ERRalpha: a mechanism for transcriptional
control of muscle glucose metabolism. Mol Cell Biol. 2005,25:10684-94.
[59] Moore, M. L., Park, E. A., McMillin, J. B. Upstream stimulatory factor represses the induction of
carnitine palmitoyltransferase-Ibeta expression by PGC-1. The Journal of biological chemistry.
2003,278:17263-8.
[60] Wende, A. R., Schaeffer, P. J., Parker, G. J., Zechner, C., Han, D.-H., Chen, M. M., et al. A Role for
the Transcriptional Coactivator PGC-1α in Muscle Refueling. Journal of Biological Chemistry.
2007,282:36642-51.
[61] Benton, C. R., Nickerson, J. G., Lally, J., Han, X.-X., Holloway, G. P., Glatz, J. F. C., et al. Modest
PGC-1α Overexpression in Muscle in Vivo Is Sufficient to Increase Insulin Sensitivity and Palmitate
Oxidation in Subsarcolemmal, Not Intermyofibrillar, Mitochondria. Journal of Biological Chemistry.
2008,283:4228-40.
[62] Larsen, S., Nielsen, J., Hansen, C. N., Nielsen, L. B., Wibrand, F., Stride, N., et al. Biomarkers of
mitochondrial content in skeletal muscle of healthy young human subjects. J Physiol.
2012,590:3349-60.
[63] Ekstrand, M. I., Falkenberg, M., Rantanen, A., Park, C. B., Gaspari, M., Hultenby, K., et al.
Mitochondrial transcription factor A regulates mtDNA copy number in mammals. Human
molecular genetics. 2004,13:935-44.
[64] Kim, J. K., Fillmore, J. J., Chen, Y., Yu, C., Moore, I. K., Pypaert, M., et al. Tissue-specific
overexpression of lipoprotein lipase causes tissue-specific insulin resistance. Proceedings of the
National Academy of Sciences of the United States of America. 2001,98:7522-7.
27
ACCEPTED MANUSCRIPT
Adropin therapy alleviates glucose intolerance
AC
C
EP
TE
D
M
AN
U
SC
RI
PT
[65] Goudriaan, J. R., den Boer, M. A. M., Rensen, P. C. N., Febbraio, M., Kuipers, F., Romijn, J. A., et al.
CD36 deficiency in mice impairs lipoprotein lipase-mediated triglyceride clearance. Journal of
Lipid Research. 2005,46:2175-81.
[66] Yuan, M., Konstantopoulos, N., Lee, J., Hansen, L., Li, Z. W., Karin, M., et al. Reversal of obesityand diet-induced insulin resistance with salicylates or targeted disruption of Ikkbeta. Science.
2001,293:1673-7.
[67] Hirosumi, J., Tuncman, G., Chang, L., Gorgun, C. Z., Uysal, K. T., Maeda, K., et al. A central role for
JNK in obesity and insulin resistance. Nature. 2002,420:333-6.
[68] Boura-Halfon, S., Zick, Y. Phosphorylation of IRS proteins, insulin action, and insulin
resistance. American Journal of Physiology - Endocrinology and Metabolism. 2009,296:E581-E91.
[69] Yaspelkis, B. B., 3rd, Kvasha, I. A., Figueroa, T. Y. High-fat feeding increases insulin receptor
and IRS-1 coimmunoprecipitation with SOCS-3, IKKalpha/beta phosphorylation and decreases PI-3
kinase activity in muscle. Am J Physiol Regul Integr Comp Physiol. 2009,296:R1709-15.
[70] Jarriault, S., Le Bail, O., Hirsinger, E., Pourquie, O., Logeat, F., Strong, C. F., et al. Delta-1
activation of notch-1 signaling results in HES-1 transactivation. Mol Cell Biol. 1998,18:7423-31.
[71] Benton, C. R., Nickerson, J. G., Lally, J., Han, X. X., Holloway, G. P., Glatz, J. F., et al. Modest PGC1alpha overexpression in muscle in vivo is sufficient to increase insulin sensitivity and palmitate
oxidation in subsarcolemmal, not intermyofibrillar, mitochondria. The Journal of biological
chemistry. 2008,283:4228-40.
[72] Bi, P., Shan, T., Liu, W., Yue, F., Yang, X., Liang, X.-R., et al. Inhibition of Notch signaling
promotes browning of white adipose tissue and ameliorates obesity. Nat Med. 2014,20:911-8.
[73] Sun, C., Zhang, F., Ge, X., Yan, T., Chen, X., Shi, X., et al. SIRT1 improves insulin sensitivity under
insulin-resistant conditions by repressing PTP1B. Cell Metab. 2007,6:307-19.
[74] Pettit, F. H., Pelley, J. W., Reed, L. J. Regulation of pyruvate dehydrogenase kinase and
phosphatase by acetyl-CoA/CoA and NADH/NAD ratios. Biochemical and biophysical research
communications. 1975,65:575-82.
[75] Turner, N., Bruce, C. R., Beale, S. M., Hoehn, K. L., So, T., Rolph, M. S., et al. Excess Lipid
Availability Increases Mitochondrial Fatty Acid Oxidative Capacity in Muscle: Evidence Against a
Role for Reduced Fatty Acid Oxidation in Lipid-Induced Insulin Resistance in Rodents. Diabetes.
2007,56:2085-92.
[76] Crewe, C., Kinter, M., Szweda, L. I. Rapid Inhibition of Pyruvate Dehydrogenase: An Initiating
Event in High Dietary Fat-Induced Loss of Metabolic Flexibility in the Heart. PLoS ONE.
2013,8:e77280.
[77] Bouzakri, K., Austin, R., Rune, A., Lassman, M. E., Garcia-Roves, P. M., Berger, J. P., et al. Malonyl
CoenzymeA Decarboxylase Regulates Lipid and Glucose Metabolism in Human Skeletal Muscle.
Diabetes. 2008,57:1508-16.
[78] Jeoung, N. H., Harris, R. A. Pyruvate dehydrogenase kinase-4 deficiency lowers blood glucose
and improves glucose tolerance in diet-induced obese mice. American journal of physiology.
Endocrinology and metabolism. 2008,295:E46-54.
[79] Muoio, D. M., Noland, R. C., Kovalik, J. P., Seiler, S. E., Davies, M. N., DeBalsi, K. L., et al. Musclespecific deletion of carnitine acetyltransferase compromises glucose tolerance and metabolic
flexibility. Cell Metabolism. 2012,15:764-77.
[80] Brüning, J. C., Michael, M. D., Winnay, J. N., Hayashi, T., Hörsch, D., Accili, D., et al. A MuscleSpecific Insulin Receptor Knockout Exhibits Features of the Metabolic Syndrome of NIDDM without
Altering Glucose Tolerance. Molecular cell. 1998,2:559-69.
28
ACCEPTED MANUSCRIPT
Adropin therapy alleviates glucose intolerance
AC
C
EP
TE
D
M
AN
U
SC
RI
PT
[81] Palomero, T., Sulis, M. L., Cortina, M., Real, P. J., Barnes, K., Ciofani, M., et al. Mutational loss of
PTEN induces resistance to NOTCH1 inhibition in T-cell leukemia. Nat Med. 2007,13:1203-10.
[82] Wong, G. W., Knowles, G. C., Mak, T. W., Ferrando, A. A., Zuniga-Pflucker, J. C. HES1 opposes a
PTEN-dependent check on survival, differentiation, and proliferation of TCRbeta-selected mouse
thymocytes. Blood. 2012,120:1439-48.
[83] Bruce, C. R., Hoy, A. J., Turner, N., Watt, M. J., Allen, T. L., Carpenter, K., et al. Overexpression of
carnitine palmitoyltransferase-1 in skeletal muscle is sufficient to enhance fatty acid oxidation and
improve high-fat diet-induced insulin resistance. Diabetes. 2009,58:550-8.
[84] Choi, C. S., Befroy, D. E., Codella, R., Kim, S., Reznick, R. M., Hwang, Y. J., et al. Paradoxical effects
of increased expression of PGC-1alpha on muscle mitochondrial function and insulin-stimulated
muscle glucose metabolism. Proceedings of the National Academy of Sciences of the United States
of America. 2008,105:19926-31.
[85] Forstermann, U., Closs, E. I., Pollock, J. S., Nakane, M., Schwarz, P., Gath, I., et al. Nitric oxide
synthase isozymes. Characterization, purification, molecular cloning, and functions. Hypertension.
1994,23:1121-31.
29
ACCEPTED MANUSCRIPT
Adropin therapy alleviates glucose intolerance
Figure legends
Figure 1. Schemes of the animal treatment for the assessments of glucose and insulin tolerance in DIO
RI
PT
mice. DIO mice received five intraperitoneal (i.p.) injections of adropin34-76 or vehicle over a 48 h period. A group
of chow-fed lean mice included in the study received injections of vehicle. (A) Protocol for assessing the impact
of adropin treatment on glucose tolerance. After the 4th injection of adropin or vehicle, food was removed and the
SC
mice fasted overnight. The mice received a 5th injection the next morning; one hour later, baseline blood glucose
levels were determined (t=0); mice then received an i.p. injection of glucose (2 mg/g fat free mass). Glucose
M
AN
U
levels were then determined at 15 min intervals. (B) Protocol for assessing the impact of adropin treatment on
insulin tolerance. DIO and the lean control mice received five intraperitoneal (i.p.) injections of adropin34-76 or
vehicle. One hour after the 5th injection, the mice that had been fasted for 6h were given an i.p. injection of
insulin (0.5mU/g body weight).
TE
D
Figure 2. Treatment of DIO mice with adropin34-76 enhances glucose tolerance and ameliorates insulin
resistance without affecting body weight. (A) Body weights before the first injection and after the fifth injection
were compared (n=5). (B) Effect of adropin treatment on glucose tolerance. Following glucose injection, blood
EP
glucose levels were monitored at regular intervals for 90 min (n=7-8). *: DIO/adr. vs. DIO/veh., P<0.05; ***:
DIO/adr. vs. DIO/veh., P<0.001. The right panel shows the area under the curve (AUC) calculated for the glucose
AC
C
excursion curve . *: DIO/veh. vs. lean/veh., P<0.05; ***: DIO/adr. vs. DIO/veh., P<0.001. (C) Glucose-induced
changes in serum insulin levels following adropin treatment. Serum samples were collected from two
experiments, and the values of insulin levels at 90 min after glucose injection are expressed as a percentage of the
basal level (i.e., fasting values before glucose injection) of the lean controls (0.45ng/ml). ****: DIO/veh. vs.
lean/veh., P<0.0001; *: DIO/adr. vs. DIO/veh., P<0.05. (D) Effect of adropin treatment on whole body insulin
sensitivity. Blood glucose levels were monitored at 15-min interval for 60 min (n=6-9) after an injection of
30
ACCEPTED MANUSCRIPT
Adropin therapy alleviates glucose intolerance
insulin. The right panel shows the percent decline (% decrease) in blood glucose following insulin injection. ***:
RI
PT
DIO/adr. vs. DIO/veh., P<0.001.
Figure 3. Adropin treatment increases carbohydrate oxidation and enhances metabolic flexibility towards
glucose oxidation in DIO mice. DIO mice received 5 injections of adropin or vehicle (n=8) prior to injection of a
bolus of insulin (2mU/g) and glucose (2mg/g) (INS/GLU); the mice had been fasted for 16h prior to the injection
SC
of INS/GLU. (A) The respiratory exchange ratio (RER) for the time preceding and following the insulin/glucose
injection. The left panel of curves shows the individual RER values along the injections. The averaged values for
M
AN
U
each animal between the 4th and 5th injection are designated as “Pre-INS/GLU”. Values averaged after the 5th
injection were designated as “Post-INS/GLU”. The differences (delta) between the pre-injection average and the
post-injection average, i.e., “Post-INS/GLU” minus “Pre-INS/GLU”, were then calculated. (B) Heat production
(kcal/h) for the “Pre-INS/GLU” and the “Post-INS/GLU” period defined in (A), and the change (delta) of heat
TE
D
productions (“Post” minus “Pre”) were calculated. The corresponding carbohydrate oxidation levels (C) and fat
oxidation levels (D) were calculated. *, P<0.05; **, P<0.01; ***, P<0.001.
EP
Figure 4. Adropin treatment enhances insulin-signaling actions in muscle of DIO mice. DIO and lean
control mice received five injections of adropin34-76 or the vehicle, and were fasted for 6h, with a final adropin
AC
C
injection administered 5h into the fast. The mice then received i.p. injections of insulin (INS, 5mU/g) or saline
(SAL). Muscle tissue was freeze clamped and flash frozen in liquid nitrogen 10 min after the injection of insulin
or saline. (A) The muscle samples were divided into two subgroups using two sets of gels (n=4-8). The
representative blots from one set of gels were presented, showing phospho-Akt (pAkt-S473) and total Akt (n=2-4).
GAPDH was used as the loading control. The level of the pAkt or total Akt was normalized to the corresponding
GAPDH, and the ratios of the normalized pAkt to the normalized Akt were presented. (B) The Ab against Akt
substrate 160 (AS160) was used to immunoprecipitate AS160 protein from whole muscle lysate. The
31
ACCEPTED MANUSCRIPT
Adropin therapy alleviates glucose intolerance
immunoprecipitates were probed with a phospho-AS160 (pAS160-T642) Ab and AS160 Ab (n=3-5). (C) GLUT4
contents in the subcellular fraction consisting mainly of cell surface were detected by Western blotting, and Na-K
ATPase was used as the loading control (two muscle tissues were pooled; n=2-3). In parallel, the GLUT4 protein
same gel are presented. *, P<0.05; ***, P<0.001; ****, P<0.0001.
RI
PT
levels in whole muscle lysate were shown (n=3-4). In all blots, two representatives from individual groups in the
SC
Figure 5. Adropin treatment of DIO mice reduced incomplete oxidation of fatty acid and reduced CPT1
activity in muscle. Whole muscle lysates were used for the measurement of the production of acid soluble
M
AN
U
metabolites (ASM), indicating incomplete oxidation (A), and the production of CO2, indicating complete
oxidation (B). (C) Total fatty acid oxidation (FAO) was calculated as the sum of the production of ASM and CO2
(n=7). (D) CPT-1 activities in isolated muscle mitochondria of vehicle- and adropin-treated DIO mice (n=4). (E)
Muscle Cpt1b message levels in vehicle- and adropin-treated DIO mice (n=6). (F) Free CoA and acetyl-CoA
TE
D
levels in muscle of vehicle- and adropin-treated DIO mice were measured; the CoA to acetyl-CoA ratio
(CoA/acetyl-CoA) is shown (n=5-6). *, P<0.05.
Figure 6. Adropin treatment increased pyruvate dehydrogenase (PDH) activity, and decreased PDK-4
EP
expressions, in the muscle from DIO mice. (A) PDH activity. The activity in whole muscle lysate in the
presence of phosphatase inhibitors and ATP-depleting system is designated as “native activity”. The activity
AC
C
following phosphatase treatment is designated as “total activity”. The ratio of the native activity to total activity
was then calculated. (B) The PDH E1α subunit was immunoprecipitated. The immunoprecipitates were used for
detections of phospho-Ser232 (pS232), acetylated lysine (Ac-K) and total E1α (DIO group, n=4-5). A
conformation-specific anti-IgG antibody that only recognizes native IgG was used to detect the proteins. The
molecular weight of the E1α subunit is 43Kda. (C) The levels of PDK4 protein (n=4), PDK4 message (n=5) and
PDK2 protein (n=3-4). *, P<0.05; **, P<0.01; ***, P<0.001.
32
ACCEPTED MANUSCRIPT
Adropin therapy alleviates glucose intolerance
Figure 7. Adropin treatment decreased PGC-1α expression levels in the muscle of DIO mice. Shown are the
RI
PT
levels of PGC-1α protein (n=3-4) and mRNA (n=6) in muscle. *, P<0.05.
Figure 8. Adropin treatment did not alter intramuscular lipid intermediate levels in DIO mice. (A)
Individual long-chain fatty acyl-CoA’s levels in muscle were measured, and the sum of the individual acyl-CoA’s
was calculated as the total level. The assay was performed in two separate groups, and the average level of the
SC
“lean/veh.” was set as “100 %” (n=8-10). (B) Ceramide levels in muscle (n=5-6). (C) Triacylglycerol (TAG)
levels in muscle (n=6-8). (D) The levels of CD36 protein in the cell surface (n=3-5), CD36 message (n=6) and
AC
C
EP
TE
D
M
AN
U
CD36 protein in whole muscle (two samples pooled, n=2). *, P<0.05; **, P<0.01.
33
ACCEPTED MANUSCRIPT
Glucose tolerance test (GTT)
1800
0600
adropin
1800
0600
adropin
M
AN
U
adropin
adropin
1800
TE
D
0600
FAST (6h)
EP
1800
AC
C
0600
adropin
Insulin tolerance test (ITT)
adropin
B.
SC
FAST (16h)
glucose
RI
PT
0600
adropin
adropin
adropin
adropin
A.
Fig. 1
insulin
0600
1800
ACCEPTED MANUSCRIPT
B
body weight
glucose tolerance test
450
360
270
*
*
***
180
lean/veh.
90
DIO/veh.
DIO/adr.
0
0
15
30
45
60
75
90
D
insulin tolerance test
lean/veh.
DIO/veh.
DIO/adr.
AC
C
min, after insulin injection
Fig. 2
% change
min, after insulin injection
% decrease
EP
TE
D
blood glucose levels
mg/dl
% baseline
serum insulin levels
(90 min after glucose injection)
M
AN
U
min, after glucose injection
C
RI
PT
g
lean/veh.
SC
blood glucose, mg/dl
DIO/veh. DIO/adr.
AUC
A
ACCEPTED MANUSCRIPT
respiratory exchange ratio (RER)
A
difference between post- and pre-INS/GLU
C
heat production
pre-INS/GLU
post-INS/GLU
RI
PT
carbohydrate oxidation
pre-INS/GLU
delta
post-INS/GLU
0.10
vehicle
adropin
AC
C
0.05
TE
D
0.15
0.00
vehicle
fat Oxidation
pre-INS/GLU
delta
post-INS/GLU
0.50
***
0.30
0.20
0.10
*
0.00
adropin
Fig. 3
delta
0.40
EP
kcal/h/mouse
kcal/h/mouse
0.20
D
kcal/h/mouse
B
M
AN
U
SC
pre-INS/GLU
delta
delta
RER
RER
pre-INS/GLU
-0.10
vehicle
adropin
A
ACCEPTED MANUSCRIPT
Akt phosphorylation levels
lean
SAL
DIO/veh.
SAL
INS
SAL
INS
pAkt
Akt
RI
PT
% lean/SAL
INS
pAkt/Akt
DIO/adr.
Akt substrate 160 (AS160) phosphorylation levels
SAL
DIO/veh.
INS
SAL
INS
DIO/adr.
SAL
INS
IP: AS160
IB: pAS160
TE
D
IP: AS160
IB: AS160
M
AN
U
lean
pAS160/AS160
% lean/SAL
B
SC
GAPDH
cell surface GLUT4
cell surface GLUT4 levels
Na-K ATPase
(whole cell)
GLUT4
GAPDH
SAL
INS
SAL
INS
% lean/SAL
(cell surface)
GLUT4
INS
DIO/adr.
whole cell GLUT4
% lean/SAL
SAL
DIO/veh.
EP
lean
AC
C
C
Fig. 4
ACCEPTED MANUSCRIPT
fatty acid oxidation
Cpt1b message
F
TE
D
ratio
M
AN
U
CoA/acetyl-CoA ratio
DIO
DIO
AC
C
DIO
EP
% vehicle
E
total
RI
PT
C
nmole/mg protein/h
CPT-1 activity
nmole/mg protein/min
D
CO2 production
SC
B
nmole/mg protein/h
ASM production
nmole/mg protein/h
A
Fig. 5
ACCEPTED MANUSCRIPT
pyruvate dehydrogenase (PDH) activity
A
native
native/total
B
M
AN
U
SC
RI
PT
% total
% lean/veh.
% lean/veh.
total
levels of acetylated lysines (Ac-K) and phosphorylated serine (pSer232) of PDH E1α
DIO/veh.
pSer232
DIO/adr.
% vehicle
lean/veh.
IB: Ac-K
TE
D
50Kd
37Kd
EP
IB: PDH E1α
DIO/veh.
DIO/adr.
PDK4
GAPDH
lean/veh.
DIO/veh.
DIO/adr.
PDK4 protein
Pdk4 message
PDK2 protein
% vehicle
lean/veh.
AC
C
pyruvate dehydrogenase kinase (PDK) expression
% lean/veh.
C
DIO
DIO
% veh.
IP: PDH E1α
IB: pSer232
Ac-K
PDK2
GAPDH
DIO
Fig. 6
DIO
DIO
ACCEPTED MANUSCRIPT
Pgc-1α levels
PGC-1α protein
SC
GAPDH
RI
PT
DIO/adr.
% veh.
PGC-1α
DIO/veh.
% lean/veh.
lean/veh.
Pgc-1α message
AC
C
EP
TE
D
M
AN
U
DIO
Fig. 7
ACCEPTED MANUSCRIPT
ceramide levels
triacylglycerol levels
CD36 levels
(whole cell) CD36 protein
DIO/adr.
TE
D
Na-K ATPase
DIO/adr.
EP
(cell surface)
CD36
DIO/veh.
DIO
AC
C
lean/veh.
% lean/veh.
GAPDH
(cell surface) CD36 protein
CD36 message
% lean/veh.
DIO/veh.
(whole cell)
CD36
% vehicle
lean/veh.
M
AN
U
D
RI
PT
μg/mg tissue
% lean/veh.
C
SC
B
nmole/g muscle
A total long-chain acyl-CoA levels
Fig. 8
ACCEPTED MANUSCRIPT
EP
TE
D
M
AN
U
SC
RI
PT
Adropin treatment ameliorates glucose intolerance in DIO mice.
Adropin treatment promotes metabolic flexibility towards glucose oxidation.
Adropin treatment sensitizes insulin signaling actions in DIO muscle.
Adropin action inhibits CPT-1B and incomplete fatty acid oxidation in DIO muscle.
Adropin action activates PDH in DIO muscle.
AC
C
ACCEPTED MANUSCRIPT
Additional experimental procedures
Citrate Synthase activity assay
Citrate synthase activity was measured spectrophotometrically as described elsewhere [1].
RI
PT
Mitochondrial respiration
Mitochondria were isolated from fresh muscle as previously described [1]. Respirometry of isolated
mitochondria was performed using an XF96 extracellular flux analyzer (Seahorse Bioscience; North
M
AN
U
Adropin transgenic and knockout mice
SC
Billerica, MA) according to the manufacturer’s instructions.
Adropin transgenic mice and adropin whole-body knockout mice were described in the previous reports
[2, 3].
TE
D
Supplementary Figure Legends
Figure S1. Ten minutes after insulin (INS) or saline (SAL) injection, the mice were euthanized, and the
muscle tissues were freeze clamped and flash frozen in liquid nitrogen. (A) The Ab against insulin
EP
receptor substrate 1 (IRS-1) was used to immunoprecipitate IRS-1 protein from whole muscle lysate. The
immunoprecipitates were used for detections of phospho-tyrosine (pY), total IRS-1 and the IRS1-
AC
C
associated p85 subunit of PI-3 kinase (n=3-4). In parallel, the whole p85 levels from the muscle lysate
were shown (n=4). (B) The levels of PTEN protein (n=3-6) and PTEN message (n=6) in muscle. (C) The
levels of phospho-AMPK (n=4) and phospho-ACC (n=4) in muscle. The phospho-AMPK and phosphoACC were probed using the blot detecting the PDK4 (Fig. 6C), and the GAPDH shown in Fig. 6C also
served as the loading control for phospho-AMPK and phospho-ACC. *, P<0.05; NS, not significant.
1
ACCEPTED MANUSCRIPT
Figure S2. The DIO mice received five injections of adropin or the vehicle. (A) The SIRT3 protein
levels in muscle (n=3-4). The SIRT3 protein and the PDK2 protein (Fig. 6C) were probed in the same
blot, and the GAPDH shown in Fig. 6C also served as the loading control for SIRT3. (B) Malonyl-CoA
RI
PT
levels in muscle (n=5-6).
Figure S3. The mice received five injections of adropin or the vehicle. Glycogen contents in muscle were
SC
measured (n=6-8). *, P<0.05.
M
AN
U
Figure S4. The DIO mice received five injections of adropin or the vehicle. (A) Citrate synthase activity
in the whole muscle lysate (A, n=7), and the message level of mitochondrial transcription factor A
(mtTfa) (B, n=6) were measured. (C) The mitochondria were isolated from muscle. Pyruvate-based
oxygen consumption rates (OCR) in basal state, following ADP-induction and upon FCCP [carbonyl
TE
D
cyanide 4-(trifluoromethoxy) phenylhydrazone] stimulation were monitored (n=4-5).
Figure S5. The mice received five injections of adropin or the vehicle. The levels of phospho-c Jun N-
EP
terminal kinase (pJNK) (T183/Y185), total JNK, phospho-inhibitor kappa B kinase (pIKK) α/β (S176/180)
and total IKKβ were measured by Western blotting. The levels of the pJNK and pIKK or total JNK and IKK
AC
C
were normalized to the corresponding GAPDH, and the ratios of the normalized pJNK or pIKK to the normalized
total JNK or total IKK, respectively, were presented (n=3-4). *, P<0.05.
Figure S6. The mice received five injections of adropin or the vehicle. The message levels of Hes1 in the
muscle from DIO mice (A, n=6), adropin transgenic (TG) mice (B, n=5) and adropin knockout (KO)
mice (C, n=6) were measured. *, P<0.05.
2
ACCEPTED MANUSCRIPT
Table 1
Effect of adropin treatment of glycolytic intermediates in muscle of DIO mice. The DIO mice received the
injections of adropin or the vehicle. Concomitantly, some lean mice received vehicle injection. Metabolic profiling
RI
PT
analysis was performed using muscle samples collected 2 h after the fifth injection (n=9-10); fold-changes are
shown. HFD-A, DIO mice fed HFD diet and treated with adropin; HFD-V, DIO mice fed HFD diet and treated
with vehicle; LFD-V, lean mice fed LFD diet and treated with vehicle. For comparisons within each column: *,
P<0.05; **, P<0.01; # P=0.08
HFD-A / LFD-V
HFD-V / LFD-V
1,5-anhydroglucitol (1,5-AG)
1.10
0.61**
0.56**
Glycerate
1.09
1.32*
1.20
1.22
0.97
0.80
1.08
1.14*
1.06
1.15
1.07
0.93
2.53*
0.89
0.35#
3-phosphoglycerate
1.33
0.95
0.72
Phosphoenolpyruvate (PEP)
1.14
0.95
0.84
Pyruvate
0.99
0.91
0.92
1.10
1.10
0.92
Mannose
1.26
*
1.03
0.82
Mannose-6-phosphate
1.45*
1.03
0.71
Fructose
1.47*
1.18
0.80
Glucose
Fructose-6-phosphate
AC
C
Fructose/Sucrose
metabolism
EP
Lactate
TE
D
2-phosphoglycerate
M
AN
U
HFD-A / HFD-V
Glucose-6-phophate
Glycolysis
SC
Fold of change
3
ACCEPTED MANUSCRIPT
References
AC
C
EP
TE
D
M
AN
U
SC
RI
PT
[1] Gao, S., McMillan, R. P., Jacas, J., Zhu, Q., Li, X., Kumar, G. K., et al. Regulation of
Substrate Oxidation Preferences in Muscle by the Peptide Hormone Adropin. Diabetes.
2014.
[2] Ganesh Kumar, K., Zhang, J., Gao, S., Rossi, J., McGuinness, O. P., Halem, H. H., et al.
Adropin deficiency is associated with increased adiposity and insulin resistance. Obesity.
2012,20:1394-402.
[3] Kumar, K. G., Trevaskis, J. L., Lam, D. D., Sutton, G. M., Koza, R. A., Chouljenko, V. N., et
al. Identification of adropin as a secreted factor linking dietary macronutrient intake
with energy homeostasis and lipid metabolism. Cell Metab. 2008,8:468-81.
4
ACCEPTED MANUSCRIPT
A
C
levels of phospho-tyrosine (pY) of IRS1
lean
SAL
INS
DIO/veh.
SAL
levels phospho-AMPK and phospho-ACC
lean/veh.
DIO/adr.
INS
SAL
INS
DIO/veh.
DIO/adr.
pAMPK
pACC
RI
PT
IP: IRS1
IB: pY
IB: IRS1
IB: p85
pACC
lean/veh.
DIO/veh.
DIO/adr.
PTEN
TE
D
GAPDH
AC
C
EP
Pten message
% veh.
% lean/veh.
PTEN protein
DIO
Fig. S1
% lean/veh.
% lean/veh.
PTEN levels
M
AN
U
B
SC
pAMPK
(whole cell)
p85
ACCEPTED MANUSCRIPT
SIRT3
malonyl-CoA levels in the DIO
DIO/adr.
AC
C
EP
TE
D
M
AN
U
SC
RI
PT
DIO/veh.
% lean/veh.
lean/veh.
B
nmole/g tissue
A
Fig. S2
DIO
ACCEPTED MANUSCRIPT
AC
C
EP
TE
D
M
AN
U
SC
RI
PT
μg/mg tissue
glycogen content
Fig. S3
ACCEPTED MANUSCRIPT
A citrate synthase activity
B
mtTfa message levels
C
mitochondrial oxygen consumption
ADP-stimulated
RI
PT
SC
EP
TE
D
M
AN
U
DIO
AC
C
DIO
pMoles/min
% vehicle
nmole/mg protein/min
basal
Fig. S4
DIO
FCCP-stimulated
ACCEPTED MANUSCRIPT
phospho-JNK and phospho-IKK levels
lean/veh.
DIO/veh.
DIO/adr.
pJNK/JNK
IKK
pJNK
SC
JNK
RI
PT
% lean/veh.
pIKK
AC
C
EP
TE
D
M
AN
U
GAPDH
Fig. S5
pIKK/IKK
ACCEPTED MANUSCRIPT
Hes1 message
adropin knockout
M
AN
U
SC
% WT
C
RI
PT
B adropin transgenic overexpression
% WT
adropin treatment
% vehicle
EP
TE
D
DIO
AC
C
A
Fig. S6
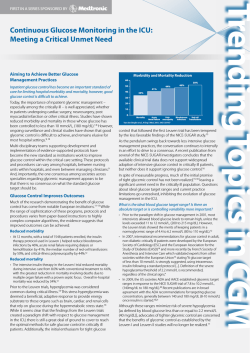
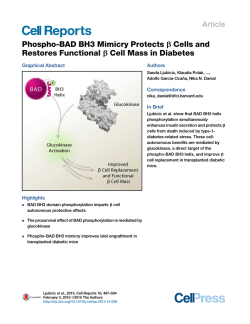

© Copyright 2026