
Namibia
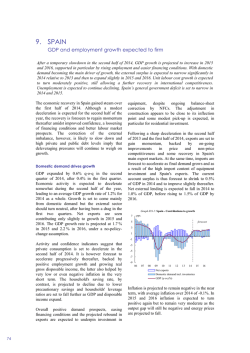
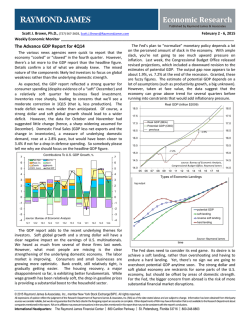
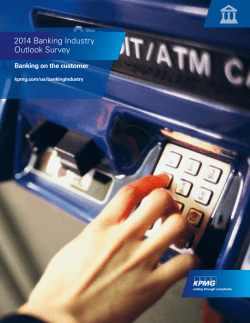
NAMIBIAN
SNAPSHOT
2014 Quarter 1
Inflation – The Bank of Namibia (BoN, the central bank) held its most recent Monetary Policy Committee (MPC) meeting on April 16. The BoN decided
to keep the repo rate unchanged at 5.5%. Meanwhile, inflation reached 5.2% y-o-y during March, compared to the same reading in February and up
from 4.9% y-o-y in January.
Growth – The Namibia Statistics Agency (NSA) released its rebased national accounts on March 27. The figures suggest that Namibia’s real GDP
growth declined from 6.7% during 2012 to 4.4% in 2013. The main factor contributing to the slowdown in growth relates to a significant contraction in
the agricultural sector, a result of the prolonged drought which plagued the country last year. According to the national accounts, the agricultural sector
contracted by 26.9% in real terms. Looking ahead, Namibia’s growth prospects are more promising with forecast real GDP growth expected to reach
around 5% this year. The construction sector will remain a key growth driver, buoyed by the construction requirements associated with several largescale infrastructure initiatives.
National development plan – Currently, the focus is predominantly on infrastructure development. Several large-scale infrastructural initiatives are
either already underway or in the development and planning phase. These include the Walvis Bay expansion project, the Trans-Kalahari railway (TKR)
line and the construction of the Neckartal Dam.
OPPORTUNITIES
STRENGTHS
The majority of food and consumer goods purchased in the country is Low political risk with stable trend lines suggests that the country
imported from South Africa, signalling import-substitution opportunities. should continue on this footing over the long term.
Walvis Bay port is undergoing a major expansion in order to create
Small size and low growth rate of population, high literacy rates, and
more capacity to handle imports and exports for landlocked neighbours. GDP per capita relatively high among developing countries.
The real estate sector is experiencing a boom in prices and
Links with South Africa's economy are supported by a closely aligned
development due to a housing shortage and high demand from abroad. legal environment, good quality economic data, and linguistic features.
Oil exploration continues along the coast, though results have so far
Financial sector is small but well developed and regulated. The capital
not been inspiring.
market (used to help finance fiscal deficit) is deep by African standards.
VULNERABILITIES
WHAT IS BEING DONE?
Dependent on mineral exports for foreign revenues and state income.
This makes the country susceptible to international developments
affecting demand for and prices of copper, uranium and diamonds.
The country imports 30% of its electricity needs and basically all its
liquid fuel supplies.
Government is promoting tourism, transport & storage facilities,
agriculture and manufacturing as alternative investment opportunities
in order to diversify foreign revenue streams and investment interest.
The Energy Sector Plan is looking towards the building of a
hydropower installation (600 MW), wind farms (114 MW), three solar
stations, and an 800 MW gas-to-power plant.
Country faces significant climate change risks over next few decades. Authorities have identified the steps required to mitigate the negative
Groundwater recharge could fall by 30% - 70% in some areas.
effects, including water management and infrastructural adaption.
More than two decades after independence, Namibian society is still
The land redistribution process has reached 70% of its targets with
beset by unacceptable levels of inequality along the lines of gender,
seven years to go. By late-2012, previously disadvantaged Namibians
race, religion, ethnicity and class, according to the United Nations.
owned 9.6 million hectares of a targeted 15 million hectares.
MEGA TRENDS
Population
2,198,406 (July 2014 est.); Age 15 - 64: 63.4%
Population growth rate (%)
0.67% (2014 est.)
Life expectancy at birth
Total population: 51.85 years; male: 52.22 years; female: 51.46 years (2014 est.)
HIV/AIDS
Adult prevalence rate: 13.3%; People living with HIV/AIDS: 220,000 (2012 est.)
Adult literacy rate (age 15 and over can
Total population: 88.8%; male: 89.0%; female: 88.5% (2010 est.)
read and write)
Urbanisation
Urban population: 39% of total population (2012); Urban population growth: 3.3% (2012)
Population below national poverty line
28.7% (2009 est.)
Unemployment rate
29.6% (2013 est.)
Employment (% of total)
Agriculture: 27.4%; Industry: 13.8%; Services: 58.7% (2012 est.)
Labour participation rate (% of total
population ages 15+)
70.9% (2013 est.)
Business languages
English, Afrikaans, German
Telephone & Internet users
Main lines in use: 171,249; Mobile cellular: 2.15 million; Internet users: 284,474 (2012)
Sources: CIA World Factbook, World Bank, UNESCO, ITU, UNAIDS, Namibia Statistics Agency, NKC Research
1
Total
Namibia
177
57
Corruption Perceptions Index 2013 (1 least, 177 most corrupt)
148
90
Global Competitiveness 2013-14 (1 most, 148 least competitive)
178
94
Economic Freedom 2014 (1 most, 178 least free)
187
128
HDI Ranking 2012 (1 most, 187 least developed)
0
Source: NKC Research
189
98
Doing Business 2014 (1 best, 189 worst)
20
40
60
80
100
120
140
160
180
200
Risk environment / Risk outlook
Sovereign Risk Ratings
S&P
Fitch
Moody’s
N/R
BBB-/Stable
Baa3/Stable
On 2 December 2013, Fitch Ratings affirmed Namibia's long-term foreign and local currency Issuer Default Ratings (IDR) at “BBB-” and “BBB”
respectively. The outlook remained stable. Fitch noted that the “BBB-” rating was supported by Namibia’s low public debt and the country’s net
external creditor position, while real GDP growth has remained robust despite difficult external conditions in recent years. The stable outlook
reflects that the upside and downside risks remained balanced, thus not prompting the agency to consider a rating change at present. A key
downside rating risk pertained to the scenario that Namibia's open economy could suffer from a weaker than expected global economy, notably
through SACU receipts and lower demand and prices for minerals.
In a report published on January 30, Moody’s Investors Service (Moody’s) re-affirmed Namibia’s sovereign credit rating. The “Baa3” investmentgrade rating with a stable outlook continued to be supported by robust economic growth despite difficult external conditions. Even though Moody’s
estimated that GDP growth declined to 4.6% in 2013, mainly as a result of the drought, the agency remained optimistic that the desert economy
will record stronger growth performance over the coming two years. More specifically: “The expansion of the country's transport infrastructure,
development of new mines, and exploitation of offshore gas resources are expected to provide the basis for continued growth of roughly 5% per
annum in the decade ahead”. Also supportive of the rating was the government's history of responsible budget management, which allowed for
carrying out expansionary fiscal policies following the global financial crisis. Yet, the country continues to face socio-economic challenges, such
as unemployment and income inequality. Also, the main structural risk pertained to the economy’s dependence on minerals to generate foreign
exchange earnings, noting that commodity prices are highly susceptible to global economic conditions.
Infrastructure
Diversity of
the Economy
Banking
Sector
Limited due to
Growth
Small but
low population dependent on
developed &
density, but of
mining and
well regulated
good quality
agriculture
Continuity
of Economic
Policy
GDP Growth
Stable
Moderate to
strong
Key Balances
Foreign
Investment
Socioeconomic
Development
Forex
Reserves
Small twin
deficits, should
eventually
return to
surpluses
Strong
Moderate
Acceptable
Stock Market
Listed Companies
Liquidity
Market Cap
Dominant Sector
Daily Trading
Volume
Namibia Stock
Exchange (NSX)
8 Primary listings
Low
N$19.5bn
(Primary listed on NSX)
Food & beverages
N$90,863
Capital Market
Development
Liquidity
Maturity Range
Municipal Bonds
Corporate Bonds
Yes
Developed in an African
context
Reasonable
91 to 364 days (T-bills),
1 to 22 years (T-bonds)
N/a
Limited
Macro-economic overview
The mining and agricultural industries have traditionally been amongst the main drivers of economic growth in Namibia. The services sector has
been expanding gradually, while manufacturing sector growth has been limited due to competition from South Africa. Due to the central role of
the agricultural and mining industries, growth in Namibia is prone to influence from the global economy via its impact on mineral demand and
prices, while domestic weather conditions influence farming activity. The latter was especially relevant in relation to Namibia’s economic growth
last year.
The NSA released its rebased national accounts on March 27. The figures suggest that the desert economy’s real GDP growth declined from
6.7% during 2012 to 4.4% in 2013. The main factor contributing to the slowdown in growth relates to a significant contraction in the agricultural
sector, a result of the prolonged drought which plagued the country last year. According to the national accounts, the agricultural sector contracted
by 26.9% in real terms during 2013. The mining industry was also under pressure due to weak global economic conditions and the impact thereof
on commodity demand and prices. In this sense, uranium mining was especially hard-hit, as the industry recorded negative real growth close to
7% in 2013. In contrast, the construction industry flourished and expanded by roughly 35% in real terms, buoyed by various large-scale
infrastructure projects. The services sector also performed well in general, posting positive real growth equal to 6.4% last year.
2
Economic Structure as % of GDP
2013 Estimate
Source: NKC Research
Agriculture/
GDP
8.2%
Industry/GDP
28.9%
Service/GDP
62.9%
Looking ahead, Namibia’s growth prospects are more promising. We forecast real GDP growth will reach around 5% this year. The construction
sector will remain one of the key growth drivers, buoyed by construction requirements associated with several large-scale infrastructural initiatives
such as the Walvis Bay expansion project and the construction of the Neckartal Dam. The expansion of the sector will further be supported by
developments at the Husab Uranium mine and the Tschudi Copper mine, in addition to the possibility that the government’s mass housing scheme
could take off prior to the end of 2014.
Real GDP Growth & Net FDI/GDP
7.5
11.0
Source: NKC Research
6.0
10.0
4.5
9.0
3.0
8.0
1.5
7.0
0.0
6.0
-1.5
5.0
2008
2009
2010
2011
2012 2013E 2014F 2015F
GDP Growth (y-o-y, %) (lhs)
Net FDI/GDP (rhs)
Net foreign direct investment (FDI) is expected to have accelerated to $1.24bn during 2013, up from $1.2bn in the previous year. Although Namibia
has performed well in relation to attracting FDI inflows, the mining sector continues to be the main beneficiary. However, seeing as the latter is
less labour intensive, foreign investment directed at the industry does not always directly contribute to broader economic objectives such as
employment creation or poverty alleviation. For this reason, the Namibian government is attempting to diversify the industries that benefit from
FDI inflows, especially towards the development of the manufacturing and agro-processing sectors. Attracting foreign investment to these sectors
is part of the Namibian government’s broader “Growth-at-Home” industrial development strategy, aimed at ensuring more value is added to
products within the country’s borders, and as such creating additional employment opportunities. Regardless, we believe the mining industry will
continue to be the main FDI draw card in the medium term. The recovery of the global economy, albeit at a slow rate, and the associated impact
thereof on demand for Namibian mineral exports bodes well for future FDI inflows into the mining sector. We expect net FDI will accelerate further
during 2014 to $1.32bn.
Exports ($ bn)
Imports ($ bn)
2013E
2014F
Main Imports: % share of total
2015F
Vehicles other than railway & tramway
Machinery & boilers
Mineral fuels, oils & distillation products
Electrical & electronic equipment
Pearls, precious stones, metals & coins
Inorganic chemicals, precious metal
compounds & isotopes
Copper & articles thereof
Fish, crustaceans, molluscs & aquatic
invertebrates
2013E 2014F
2015F
Vehicles other than railway & tramway
15.60
14.82
15.37
Machinery & boilers
11.87
10.93
10.60
Mineral fuels, oils & distillation
products
11.54
11.34
11.63
Electrical & electronic equipment
7.13
6.62
6.64
Main Exports: % share of total
2013E 2014F
2015F
25.77
26.30
27.81
13.78
12.29
11.51
Copper & articles thereof
12.89
12.04
12.14
Fish, crustaceans, molluscs & aquatic
invertebrates
9.30
8.24
7.60
Pearls, precious stones, metals &
coins
Inorganic chemicals, precious metal
compounds & isotopes
0.0
0.5
1.0
1.5
2.0
According to the NSA’s rebased national accounts, Namibia’s trade deficit reached N$15.8bn last year, up 42.8% from the figure recorded in
2012. Although we expected a wider deficit in 2013, the magnitude thereof was somewhat surprising. Namibia’s trade statistics have in recent
months been prone to influence from large amounts of exports or imports of a specific commodity type. Due to certain on-going infrastructural
projects in the country, we would not be surprised to see similar occurrences this year. Regardless, the current account deficit widened significantly
as a result, from N$1.3bn in 2012 to N$4bn in 2013. We expect the current account deficit will widen further to N$4.9bn in 2014. The various
large-scale infrastructural projects currently underway in the country will continue to add pressure on the trade deficit due to the imports of building
materials and certain high-value parts and components. Also, while exports should be supported by a slow recovery in the global economy, we
believe the effect thereof might still be somewhat tempered this year. However, the medium-term outlook continues to look more favourable and
the country should eventually return to a surplus position.
3
Current Account & Budget Balance
(% of GDP)
4.0
4.0
Source: NKC Research
2.0
2.0
0.0
0.0
-2.0
-2.0
-4.0
-4.0
-6.0
-6.0
2008 2009 2010 2011 2012 2013E 2014F 2015F
Current Account/GDP (lhs)
Budget Balance/GDP (rhs)
In its most recent 2013 Article IV Consultation report, published in February, the International Monetary Fund (IMF) reiterated the need for mediumterm fiscal consolidation. In addition, the Fund proposed that the Namibian government aim to achieve a balanced fiscal position by 2015 in order
to rebuild fiscal and foreign reserve buffers. The IMF still deemed the country to be vulnerable to external shocks given the local currency’s peg
to the South African rand and lingering uncertainty in relation to the global economic recovery and the impact thereof on key export commodity
prices. This advice is certainly still relevant, especially considering that Namibia’s trade deficit widened by 42.8% during 2013. Also, by our
estimates, Namibia’s foreign reserves would have been equivalent to 2.6 months of import cover at the end of 2013, well below the Fund’s
recommended level. However, the 2014/15 budget does not seem to heed the multilateral organisation’s advice, at least not in the short term,
with the deficit expected to widen from 5.4% of GDP in 2013 to 5.8% of GDP this year.
Average CPI (% change, y-o-y)
10.0
9.0
8.0
7.0
6.0
5.0
4.0
3.0
2.0
1.0
0.0
Source: NKC Research
2008
2009
2010
2011
2012 2013E 2014F 2015F
Inflation reached 5.2% y-o-y during March, compared to the same reading in February and up from 4.9% y-o-y in January. We have maintained
for some time that the decline in average annual inflation – down from 6.7% in 2012 to 5.6% in 2013 – masked upward price pressure stemming
from the weaker currency. Even though the currency regained some lost ground recently, it remains weak and this effect will continue to filter
through to inflation in the coming months, as evidenced by the markedly higher food prices (1.8% m-o-m higher in March) and elevated transport
costs (1.1% m-o-m higher in March). We expect inflation will average 5.6% this year. The BoN held its most recent MPC meeting on April 16. The
BoN decided to keep the repo rate unchanged at 5.5%. In recent years, the BoN often preferred to keep the Namibian repo slightly higher than
compared to its South African counterpart to ensure the premium attracts capital inflows. However, seeing as the South African Reserve Bank
(SARB) hiked interest rates by 50 bps in January, it means that the Namibian repo rate is currently equal to its South African counterpart at 5.5%.
Yet, at 9.25%, Namibia’s prime lending rate is still 25 bps higher than the South African equivalent. At its most recent MPC meeting on March 28,
the SARB opted to keep rates stable, but cautioned that further interest rate hikes later in the year were likely. With further interest rate hikes by
the SARB further down the line more than likely, our baseline scenario sees the BoN matching such moves to prevent the possibility of capital
outflows, or at the very least, not allow the real interest rate differential to become too large. A significant amount of capital outflows could prove
especially disruptive to the Namibian economy given the widening current account deficit, which if not adequately financed, could add further
pressure on already low foreign reserve holdings.
CONTACT DETAILS
KPMG
NKC
NKC Independent Economists CC
Robert Grant – designation is Partner
Tel +264 61 387 500
Email [email protected]
12 Cecilia Street Paarl, 7646, South Africa
P O Box 3020, Paarl, 7620
Tel: +27(0)21 863-6200
Fax: +27(0)21 863-2728
Email: [email protected]
GPS coordinates
S33°45.379'
E018°58.015'
The foregoing information is for general use only. NKC does not guarantee its accuracy or completeness nor does NKC assume any liability for any loss which may result from the reliance by
any person upon such information or opinions.
© 2014 KPMG Advisory Services (Namibia) (Proprietary) Limited, a Namibian private company and member firm of the KPMG network of independent firms affiliated with KPMG International
Cooperative (“KPMG International”), a Swiss entity. All Rights Reserved KPMG International Cooperative (“KPMG International”) is a Swiss entity. Member firms of the KPMG network of
independent firms are affiliated with KPMG International. KPMG International provides no client services. No member firm has any authority to obligate or bind KPMG International or any other
member firm vis-à-vis third parties, nor does KPMG International have any such authority to obligate or bind any member firm.
4


© Copyright 2026