
ANALYSIS OF PYROXENE MINERALOGY OF BASALTS AT
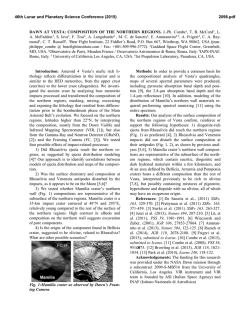
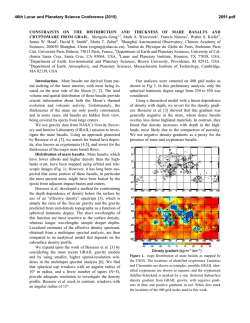
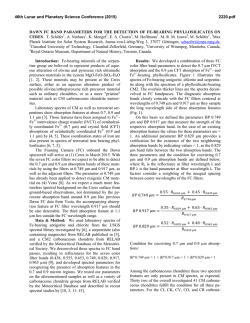
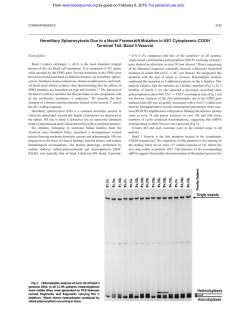
46th Lunar and Planetary Science Conference (2015)
1407.pdf
ANALYSIS OF PYROXENE MINERALOGY OF BASALTS AT HANSTEEN-BILLY, MOON THROUGH
CHANDRAYAAN-I MOON MINERALOGY MAPPER (M3). Mamta Chauhan, Satadru Bhattacharya and
Prakash Chauhan, Space Applications Centre, Indian Space Research Organisation, Ahmedabad – 380 015, India
([email protected]).
Introduction: Mare basalts on the Moon derived
from partial melting of its mantle occurs in a wide
range of composition. The Oceanus Procellarum area
of the Moon is dominantly covered by these basaltic
flows and characterized by emplacement of vast expanses of various mare units ranging from Nectarian to
Copernican period (3.9-1.2 Ga) as mapped by earlier
remote observations [1, 2]. Pyroxene, the most abundant phase in mare basalts is a solid solution of various
minerals [3] and are characterized by two widely separated absorption features in near infra-red region whose
position and shapes are the results of its bulk composition, texture, and cooling history [4]. Therefore, this
mineral provide useful information regarding the composition and thermal history of the host rocks. In the
present study, compositional analysis of basaltic units
have been carried out in the Hansteen-Billy area using
high-resolution hyperspectral data from Chandrayaan-1
Moon Mineralogy Mapper (M3) instrument [5] based
on pyroxene mineralogy. The study area lies near the
southwest edge of the Oceanus Procellarum, extending
roughly between 55oW-16.5oS and characterized by the
presence of craters Hansteen and Billy and a prominent
domal feature, Hansteen alpha.
Methodology: Three mare units (INm, Im and
Em) (Fig. 1a) are delineated in this area that corresponds to the chrono-stratigraphic units of [6]. The
youngest basaltic unit belonging to Eratosthenian period (Em) and is confined to crater Billy and appears
bright while, the Imbrian period (Im) unit is somewhat
dull and the oldest unit (INm) of Nectarian age is mostly degraded. To represent the spectral variability
amongst the three basaltic units, Integrated Band Depth
(IBD) mosaic has been generated (Fig. 1b) using equation given by Mustard et al. [7]. These mare units are
analyzed for their composition using the diagnostic
absorption features of the abundant mineral phases i.e,
olivine and pyroxenes as characterized by [8-10]. For
quantification of the spectra and to determine their
relative mafic mineral abundances (olivine/orthoand/or clinopyroxene) and pyroxene chemistry spectral
band parameters, are computed. Band Continuum removal is performed by fitting a straight line continuum
tangent on both side of the absorption band, I and II
separately and dividing the spectra by the respective
continuum. Band center is calculated by fitting a third
order polynomial equation to the bottom of the continuum-removed absorption feature between 10 and 20
data points on either side of a visually determined min-
imum or center. Band area is calculated as the area
between the continuum slopes and the data points.
Results: The normal and continuum-removed reflectance spectra from the fresh craters sampled from
each of the three basaltic units are presented in Figure
2. To estimate the relative abundances of pyroxene and
olivine in the basalts the band area ratio of Band II vs
Band I (BAR) [11] have been calculated. The calculated BAR value ranges from 2.2-3 for all the three mare
units indicating pyroxene dominated lithologies in the
area. Besides, pyroxenes a weaker absorption band
could be noted in the spectra of the basalts around 650
nm (Fig. 2). This absorption band could perhaps be
attributed to the presence of chromium in the basalts.
As in both high- and low-Ca pyroxenes the absorption
bands in reflectance spectra at 0.6–0.68 mm regions is
attributed to the presence of chromium in octahedral
coordination in the M1 site [e.g., 12-14].
The Band I and Band II centre obtained from the
reflectance spectra of fresh craters of basalts are plotted in a Band I/Band II center scatter plot of ortho-and
clino-pyroxenes (Fig. 3) along with the compositional
data of pure ortho-and clino-pyroxenes of Adams and
Klima [15-17] for comparison. The band center values
of the spectra from INm basalts ranges from 910 to 950
nm for Band I and 1900–2100 nm for Band II absorption features. They appears to fall in the orthopyroxene
range. Data from the Im basalts shows Band I center
values varying from 960 to 990 nm and Band II from
2160 to 2270 nm characterizing them as high-Ca pyroxenes. Whereas, for Em, the Band I center range
from 951 to 991 nm and 2230-2340 indicating their
high-Ca bearing nature (Fig. 3). The Band II centre in
Em basalts are indicative of their Cr-bearing nature as
the wavelength position is more longwards. Crdiopside displays the 2000-nm absorption bands at
longer than expected wavelength [13, 14]. In addition
the additional absorption band near 650-680 nm is also
indicative of Cr-diopside and are more common in
lunar samples while rare in terrestrial basalts [14].
The spectral band parameters of pyroxene obtained from reflectance spectra are analysed for estimating the Enstatite (En), Ferrosilite (Fs) and Wollastonite (Wo) content of pyroxenes using calibration
equations formulated by [15] for compositional assessment of pyroxenes. The pyroxene composition thus
obtained for the three mare units are projected over the
Di-En-Hd-Fs quad for showing their composition and
determination their formation temperatue [16].
46th Lunar and Planetary Science Conference (2015)
1407.pdf
1050oC for INm, 1000o-700oC for Im, 1000o-600oC for
Em basalts. It indicates that basaltic evolution in the
area with time probably would have occurred by assimilating
plagioclase
in
the
source.
Figure 4
Figure 1
Figure 2
Figure 3
Conclusions: The calculated average pyroxene composition for INm basalts is En39.2Fs45.4Wo15.4 indicating
a pigeonitic affinity and suggests a primitive basaltic
source. Pyroxene composition of Im En46.32Fs17.4Wo35.7
and Em basalts En44.3Fs16.15Wo39.46 indicates composition close to calcic augite to diopside suggesting their
highland affinity.Temperature ranges from 1100o-
Figure 1. (a) M3 False colour composite (R=930,
G=1229 and B=1578-nm bands) showing basaltic units
belonging to different ages (b) M3 IBD mosaic of
Hansteen-Billy region generated by assigning red,
green and blue colour to 1000 nm, 2000 nm and 1578nm bands respectively.
Figure 2 Normal and Continuum removed spectras of
pyroxenes from Nectarian (INm) (a and b), Imbrium
(Im) (c and d) and Eratosthene (Em) basalts (e and f).
Figure 3. Band I-Band II ratio image showing plotting
of three basaltic units of the Hansteen-Billy area along
with data for pure ortho-and clino-pyroxenes of Adams
(1974) and Klima (2007, 2010).
Figure 4. Composition and equlibrium pyroxene
temperature for the basaltic units of Hansteen-Billy
region projected over pyroxene compositional
quadrilateral overlain by geotherms determined by
Linsley and Anderson (1983).
References: [1]Wilhelms D. E. and McCauley J.F.
(1971) Map I,703,U.S. Geol. Surv. [2] Hiesinger H. et
al. (2003) JGR 108, E7, 5065. [3] Basaltic Volcanism
Study Project (1981) Pergamon Press, Inc., New York.
[4] Klima R. L. et al. (2007) Meteorit. Planet. Sci,. 42,
235-253. [5] Boardman J. et al. (2011) JGR 116,
E00G14.[6] Wegner R. et al. (2010) JGR 115, E06015.
[7] Mustard J. F. et al. (2011) JGR 116, E00G12. [8]
Burns R. G. (1993) 2nd ed., Cambr. Univ. Press, New
York [9] Klima, R. L. (2007) Meteorit. Planet. Sci. 42,
235-253. [10] Klima, R. L.(2011) Meteorit. Planet.
Sci. 46, 3, 379-395. [11] Cloutis E. A. and Gaffey M. J.
(1991) JGR 96, 22,809-22,826. [12] Mao H. K. et al.
(1972) Year Book Carnegie Inst. Washington, 71, 538541. [13] Hazen, R. M. et al. (1978) Proc. Lunar Sci.
Conf. 9, 2919-2934. [14] Cloutis E. A. et al. (2002)
JGR 107, E6, 5039. [15] Gaffey M. J. et al. (2002)
Univ. Arizona Press, 183-204. [16] Linsley D. H. and
Anderson D. J. (1983) JGR 88, A887-A906.


© Copyright 2026