
china macro monitor 2015: from cyclical to structural
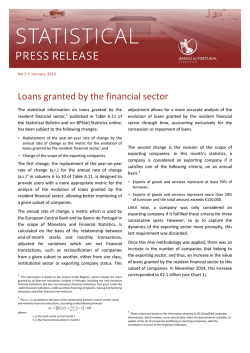
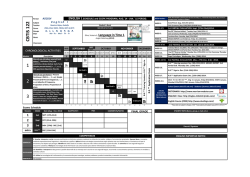
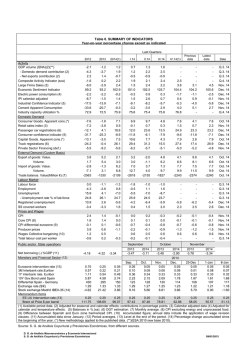
Nitesh Shah, Associate Director [email protected] 2 FEBRUARY 2015 CHINA MACRO MONITOR 2015: FROM CYCLICAL TO STRUCTURAL • • • • After half a year of spectacular equity market performance to some the clouds of slowing economic growth cast doubt on China’s ability to maintain the rally. However, that view over-emphasises the correlation between GDP performance and equity market performance. The link between economic and equity market performance has never been straight-forward. Indeed, China may follow a path similar to Japan, South Korea and Taiwan during their early stages of development. That indicates that equity market performance will accelerate during periods of financial market liberalisation rather than periods of strong economic growth. A number of exogenous events may also prove to be supportive for both China’s domestic equity market and China’s role in the global economy. MSCI is due to evaluate the inclusion of China A-Shares in its Emerging Markets Index this June. The IMF is also due to conduct its five-yearly Special Drawing Rights (SDR) basket review this October. Renminbi inclusion discussions could become a catalyst for significant currency market liberalisation and a seismic shift in the role of the Chinese currency in international trade and finance. We expect reform to remain the focus of policy makers’ agenda this year, with lower economic growth an acceptable by-product of stability. The authorities are unlikely to let growth fall substantially lower however, as that could stoke political unrest and undo the hard work of the reform agenda. We expect some policy easing, primarily in the form of lower interest rates and a reduction the Reserve Requirement Ratio in coming months. Yuan: In Need of A Wider Band? <------- Yuan Appreciation 6.45 6.40 Note: On 16/04/2012 band set to 1% around the official mid-point 6.35 On 17/03/2014 band set to 2% around the official mid-point 6.30 6.25 6.20 6.15 6.10 6.05 6.00 Source for all charts and tables in publication: ETF Securities and Bloomberg unless otherwise stated INVESTMENTS MAY GO UP OR DOWN IN VALUE AND YOU MAY LOSE SOME OR ALL OF THE AMOUNT INVESTED Jan 15 Jan 15 Dec 14 Dec 14 Nov 14 Nov 14 Oct 14 Oct 14 Sep 14 Sep 14 Sep 14 Aug 14 Jul 14 Aug 14 Jul 14 Jun 14 Jun 14 May 14 May 14 Apr 14 Apr 14 Mar 14 Mar 14 Mar 14 Feb 14 Feb 14 Jan 14 Jan 14 Dec 13 Dec 13 Nov 13 5.95 ETF SECURITIES 2 A ROCKY PATH TO STABILITY Although Chinese GDP growth of 7.4% in 2014 surpassed consensus expectations, it was the lowest reading in 24 years. The outlook for growth is lower still in 2015. Both the World Bank and IMF have downgraded their 2015 China growth forecasts to below 7%t this month. The message from policy makers in China is that sub-7% growth is acceptable, so long as its reform agenda continues apace. Over the next decade China’s growth model will migrate away from cheap-currency dependent mercantilism and China will become increasingly more capitalist. Market forces will help the 1 allocation of resources and the legal framework will be strengthened to improve quality of China’s institutional 2 infrastructure . Transition will inevitably involve winners and losers, but society as a whole is likely to benefit from the new model. China will be careful not to move too quickly and aggravate political instability. With that in mind, it is likely that China will stimulate the economy further in 2015 to avoid a marked slowdown, especially in light of a faltering Euro area dampening global demand their good and services. In spite of economic growth deceleration in H2 2014, the 3 domestic equity market rallied 58% . That is not unusual and the experiences of Japan, South Korea and Taiwan in their transition paths in earlier decades highlight that this is what we should expect. For example in Japan during the 1960s, a period of financial repression, the stock market underperformed relative to the overall economy. However in the 1980s when economic growth was subdued relative its past, the stock market performed particularly well in an environment of financial market liberalisation. South Korea and Taiwan experienced similar bouts of equity market outperformance during periods of financial market liberalisation, which countered the underperformance during earlier periods of financial repression and relatively stronger growth. We believe China’s equity market underformance in recent years prior to the opening up of the Hong Kong-Shanghai Connect initiative in November 2014 was a symptom of a lack of market access. The Connect initiative significantly opened up market access. The fact that volumes traded on the Connect have not met expectations is irrelevant. The market has priced Shanghai stocks as internationally accessible now. The 4 eventual opening of a Shenzhen Exchange link will give further access to Chinese domestic stocks, which will also become priced-in at some point. We are likely to see equity market volatility rise. While structural shifts will move the equity market higher, periodic disappointment over growth figures are likely to lead to frequent corrections. This tug-of-war between the structural and cyclical drivers of the market will continue to divide analysts and see volatility remain high. Investors attracted to the recent rally should recognise the need for a significant degree of risk tolerance to weather rising market volatility. In 2014, it was clear that Chinese equities were cheap by international standards. That is no longer the case. The MSCI China A-Share P/E is now close to the MSCI World P/E. P/Es in 2009 were undesirably high (it was a period of earnings weakness and price optimism in light of policy easing) and so should not be treated as a benchmark for where equity markets should go back to. Trading China on cheapness should be a thing of the past. Investing in China is once again about buying into structural change. MSCI P/Es (12-Month-Trailing) 50 45 40 35 30 25 20 15 10 Dec 14 Jun 14 Sep 14 Mar 14 Dec 13 Jun 13 Sep 13 Mar 13 Dec 12 Jun 12 Sep 12 Mar 12 Dec 11 Jun 11 China A 70% Sep 11 Mar 11 Dec 10 Jun 10 Sep 10 Mar 10 Dec 09 Jun 09 Sep 09 Mar 09 Dec 08 Jun 08 Sep 08 Mar 08 Dec 07 5 Japanese Economic and Stock Market Performance: Correlation Broken World Source: ETF Securities, Bloomberg 25% 60% 20% 50% THE GLOBAL STAGE AWAITS 15% 30% 20% 10% 10% % y-o-y %y-o-y 40% 5% 0% -10% 0% -20% Nikkei 225 (Left) 1998 1996 1994 1992 1990 1988 1986 1984 1982 1980 1978 1976 1974 1972 1970 1968 1966 1964 1962 1960 1958 -5% 1956 -30% Japan Nominal GDP (Right) Source: ETF Securities, FRED (Federal Reserve Bank of St. Louis), Statistics Japan 1 A number of events this year could prove to be a catalyst for further capital market deepening in China. “The focus of the restructuring of the economic system... is to allow the market [forces] to play a ‘decisive role’ in the allocation of resources”, Third Plenum Communiqué, November 2013 2 "Comprehensively advancing the rule of law", Fourth Plenum Communiqué, October 2014 3 MSCI China A-Share, between 30 June 2014 and 31 December 2014 Firstly in June, MSCI will reconsider whether to include domestic Chinese equities into its emerging markets index. With approximately US$1.5tn benchmarked to MSCI China Emerging Markets Index, even a small allocation of 0.5% to the China A-Share market in the broader index could drive US$7.5bn into the market on the back of index replication by investors. As a point of reference, the MSCI United Arab Emirates Net TR 4 Although no formal announcement has been made, Premier Li Keqiang has openly encouraged the opening of an Shenzhen link INVESTMENTS MAY GO UP OR DOWN IN VALUE AND YOU MAY LOSE SOME OR ALL OF THE AMOUNT INVESTED ETF SECURITIES 3 MSCI United Arab Emirates Net TR USD Index 800 700 CNY International Ranking in Average Daily Turnover 1998 2001 2004 2007 2010 2013 0 5 10 Higher Ranking ---------> USD index rose over 90% between the time MSCI announced UAE stocks would enter its Emerging Market Index and actual inclusion (see shaded area of chart). While the Chinese and UAE markets are vastly different in size and composition, we believe the increasing probability of index inclusion will bode well for China A-Shares. 15 20 25 30 600 35 500 40 With the Yuan trading very close to the edge of its trading band (see chart on front page), we could see further flexibility in the trading band this year. The recent depreciation against the US Dollar seems to be more about the strength of the US dollar than Yuan weakness, with the nominal effective rate actually having appreciated in December. Indeed there has been no increase in foreign exchange reserves that would occur if the authorities were intervening to depreciate the currency. 5.5 115 6.5 110 105 7 100 7.5 95 90 85 CNY/USD (Left) Effective Exchange Rate (Right) Source: ETF Securities, Bloomberg, BIS December 2014 INVESTMENTS MAY GO UP OR DOWN IN VALUE AND YOU MAY LOSE SOME OR ALL OF THE AMOUNT INVESTED 80 Yuan Appreciation ---> 120 8 5 Dec 14 125 6 8.5 Jul 14 Feb 14 Sep 13 Apr 13 Nov 12 Jun 12 Jan 12 Aug 11 Mar 11 Oct 10 May 10 Dec 09 Jul 09 Feb 09 Sep 08 Apr 08 Nov 07 Jun 07 Jan 07 Aug 06 Dollar Appreciation Rather Than Yuan Depreciation Mar 06 In its last review in 2010 the IMF decided not to widen the currencies in the basket. At the time the IMF noted that China was the third largest exporter of goods and services but felt that the Renminbi was not a freely useable currency. However, they urged that this issue be kept under review. Since then, the Chinese Yuan has become the fifth most used payment 5 currency according to SWIFT , jumping from seventh position only a year earlier. The Renminbi became the ninth most actively traded currency according to the Bank of International th Settlement’s 2013 triennial survey, jumping from 17 position in 2010. Over that period average daily turnover soared from US$34bn in 2010 to US$120bn in 2013. While capital and exchange rate controls will continue to hold back the Renminbi from SDR inclusion, we believe the IMF’s review this year will facilitate a road-map for further internationalisation of the currency. With the internationalisation of the Renminbi a stated policy objective we believe that the Chinese authorities will continue to dismantle controls on the currency. Oct 05 Secondly, in October the International Monetary Fund will review which currencies it will include in its Special Drawing Rights (SDR) currency basket. The SDR is an international reserve asset, created by the IMF in 1969 to supplement its member countries’ official reserves. Its value is based on a basket of four key international currencies, and SDRs can be exchanged for freely usable currencies. If the Renminbi is included in the basket, central banks buying/selling SDRs will have to deliver/receive Renminbi (in proportion to its weight in the basket). May 05 Sep 14 Jul 14 May 14 Mar 14 Jan 14 Nov 13 Sep 13 Jul 13 May 13 Mar 13 Jan 13 Nov 12 200 Dec 04 300 Significant expansion in RMB offshore clearing centres around the world has helped fuel this trend and access to the currency has never been easier. In 2014, the Yuan-HK Dollar convertibility cap was abolished in recognition of the demand for Renminbi (timed with the opening of the Hong KongShanghai Stock Connect initiative). Yuan Appreciation ---> 400 Soure: BIS Triennial Central Bank Survey on Foreign Exchange ETF SECURITIES 4 Level (Left) Jun 14 %m-o-m, 3mma Dec 14 Jun 13 Dec 13 Jun 12 Dec 12 Jun 11 Dec 11 Jun 09 Jun 10 -2.0 Dec 10 -1.0 0.0 Dec 09 0.0 0.5 Jun 08 1.0 1.0 Dec 08 2.0 1.5 Jun 07 3.0 2.0 Dec 07 4.0 2.5 Jun 06 5.0 3.0 Dec 06 6.0 3.5 Jun 05 7.0 4.0 Dec 05 4.5 Dec 04 US$ tn China Foreign Exchange Reserves Continue to Decline Growth (Right) POLICY EASING IN 2015 With consumer price inflation weakening and property prices continuing to fall, we expect the Peoples Bank of China (PBoC) to cut interest rates further this year. We also expect the central bank to cut the Reserve Requirement Ratio (the amount of reserves banks need to hold with the central bank), thus improving banks’ ability to lend. The transition away from shadow banks to the formal banking sector will continue in 2015, increasing pressure on the PBoC to nd provide liquidity support to banks. On January 22 the PBoC injected CNY50bn into the banking system through the 7-day repo market. That was one of the many injections the central bank has provided in the past six months (see page 10 for other examples) and we expect the PBoC to maintain a strong hand on facilitating the transition in the financial sector. Financing Shifting From the Shadows to the Formal Sector 70% 50% 30% 10% -10% -30% -50% -70% RMB + FX Loans Shadow Banks Corporate Bond + Equity Financing Q4 2014 Q2 2014 Q4 2013 Q2 2013 Q4 2012 Q2 2012 Q4 2011 Q2 2011 Q4 2010 Q2 2010 Q4 2009 Q2 2009 Q4 2008 Q2 2008 Q4 2007 Q2 2007 Q4 2006 Q2 2006 Q4 2005 Q2 2005 Q4 2004 -90% Other INVESTMENTS MAY GO UP OR DOWN IN VALUE AND YOU MAY LOSE SOME OR ALL OF THE AMOUNT INVESTED ETF SECURITIES 5 MACRO MONITOR Dec -‐13 J an-‐14 F eb-‐14 Mar-‐14 A pr-‐14 May-‐14 J un-‐14 J ul-‐14 A ug -‐14 S ep-‐14 Oc t-‐14 Nov -‐14 Dec -‐14 G rowth Indic ators G DP G rowth (% y-‐o-‐y) K eqiang Index * Indus trial P roduc tion (% y-‐o-‐y) Manufac turing P MI (L ev el) R etail S ales (% y-‐o-‐y) F ix ed A s s et Inv es tment (ytd % y-‐o-‐y) T rade, R es erv es , Money and Inflation T rade B alanc e (US $ bn) E x ports (% y-‐o-‐y) Imports (% y-‐o-‐y) F oreig n E x c hang e R es erv es (US $ tn) M1 Money S upply (% y-‐o-‐y) M2 Money S upply (% y-‐o-‐y) C P I Inflation (% y-‐o-‐y) C P I Non F ood Inflation (% y-‐o-‐y) P P I Inflation (% y-‐o-‐y) Interes t and E x c hang e R ates P olic y Interes t R ate: L ending (%) P olic y Interes t R ate: Depos it (%) 7d R epo R ate (%) 3m S HIB OR (%) 5yr B ond Yield (%) S ov ereig n 5yr C DS R ate (bps ) C NY/US D E ffec tiv e E x c hang e R ate Other K ey Indic ators R es idential B uilding S ales (% y-‐o-‐y) T otal B uilding S ales (% y-‐o-‐y) 70 C ity R es idential P ric e (% y-‐o-‐y) A g g reg ate F inanc e (C NY bn) MS C I C hina A S hare Index MS C I World Index 7.6 8.5 9.7 51.0 13.6 19.6 17.9 7.4 4.8 8.8 50.3 12.2 17.6 4.5 8.7 50.4 11.9 17.3 6.2 8.8 50.8 12.5 17.2 7.5 6.2 9.2 51.0 12.4 17.3 4.9 9.0 51.7 12.2 17.0 3.2 6.9 51.1 11.9 16.5 7.3 4.1 8.0 51.1 11.6 16.1 3.0 7.7 50.8 11.5 15.9 3.1 7.2 50.3 11.7 15.8 7.3 2.3 7.9 50.1 11.9 15.7 7.0 -‐1.1 50.5 50.2 25.3 4.3 8.3 3.8 9.3 13.6 2.5 1.7 -‐1.4 32.0 10.5 9.8 3.9 1.2 13.2 2.5 1.9 -‐1.6 -‐22.6 -‐18.1 9.7 3.9 6.9 13.3 2.0 1.6 -‐2.0 8.0 -‐6.6 -‐11.5 3.9 5.4 12.1 2.4 1.5 -‐2.3 18.7 0.8 0.7 4.0 5.5 13.2 1.8 1.6 -‐2.0 36.3 7.1 -‐1.7 4.0 5.7 13.5 2.5 1.7 -‐1.4 31.9 7.2 5.3 4.0 8.9 14.7 2.3 1.7 -‐1.1 47.3 14.5 -‐1.7 4.0 6.7 13.5 2.3 1.6 -‐0.9 49.9 9.4 -‐2.4 4.0 5.7 12.8 2.0 1.5 -‐1.2 31.1 15.3 6.9 3.9 4.8 12.9 1.6 1.3 -‐1.8 45.4 11.6 4.5 3.9 3.2 12.6 1.6 1.2 -‐2.2 54.5 4.7 -‐6.7 3.8 3.2 12.3 1.4 1.0 -‐2.7 49.6 9.7 -‐2.4 3.8 3.2 12.2 1.5 0.8 -‐3.3 6.0 3.0 5.3 5.6 4.5 79.8 6.05 6.1 6.0 3.0 5.0 5.6 4.2 98.2 6.06 6.0 6.0 3.0 3.5 5.5 4.0 89.7 6.15 6.1 6.0 3.0 4.2 5.5 4.1 92.3 6.22 6.2 6.0 3.0 4.2 5.5 4.0 88.9 6.26 6.3 6.0 3.0 3.3 4.9 3.9 73.2 6.25 6.2 6.0 3.0 3.9 4.7 3.8 77.0 6.20 6.2 6.0 3.0 4.0 4.7 4.0 79.7 6.17 6.2 6.0 3.0 3.8 4.7 4.0 70.2 6.14 6.1 6.0 3.0 2.9 4.5 3.9 88.8 6.14 6.2 6.0 3.0 3.3 4.4 3.6 79.0 6.11 6.1 5.6 2.8 3.5 4.2 3.4 77.3 6.15 6.2 5.6 2.8 4.8 5.1 3.5 94.8 6.21 6.2 9.0 2600 2200 9684 -‐3.7 8.2 937 2184 10297 -‐10.7 -‐5.2 7.3 2093 2144 10409 -‐15.3 -‐7.8 6.4 1526 2143 10564 -‐11.3 -‐8.5 5.4 1401 2145 10715 -‐5.4 -‐6.7 4.1 1967 2159 10817 -‐17.8 -‐8.2 2.4 274 2343 10586 -‐13.8 -‐8.9 0.5 958 2342 10739 -‐10.3 -‐8.9 -‐1.1 1136 2473 10425 -‐3.2 -‐7.9 -‐2.5 681 2528 10444 -‐7.8 -‐7.8 -‐3.6 1146 2793 10685 4.2 -‐6.3 -‐4.3 1695 3379 10613 3.6 26.3 9.2 1232 2301 10053 L as t 3 m onth trend improving L as t 3 m onth trend flat L as t 3 m onth trend wors ening * T he K eqiang index is the e qual-‐weighted a verage of the year-‐on-‐year c hange in bank loans , rail freight volumes a nd elec tric ity produc tion STOCK MARKET PERFORMANCE AND VALUATION MSCI China index Top Five Stock Gainers and Decliners MSCI China A Share Index 3600 19 MSCI China A Share Index and P/E Ratio 18 3400 17 3200 T op 5 G ainers C S R C orp L td A vic C apital C o L td C hina C NR C orp L td C hina L ife Ins urance C o L td C hina N ational S oftware & S ervice C o L td P ric e (% m -‐o-‐m) 133.1 131.5 116.7 53.1 52.3 Weig ht (% ) 0.56 0.38 0.59 0.65 0.12 C ontribution (p x w ) 0.75 0.50 0.68 0.34 0.07 B ottom 5 D ec liners G uangdong W eihua C orp C hina Merchants S ecurities C o L td C hangjiang S ecurities C o L td S inolink S ecurities C o L td G uangdong H E C T echnology H olding C o L td P ric e (% m -‐o-‐m) -‐31.6 -‐25.1 -‐23.8 -‐21.3 -‐21.1 Weig ht (% ) 0.05 0.40 0.41 0.23 0.06 C ontribution (p x w ) -‐0.02 -‐0.10 -‐0.10 -‐0.05 -‐0.01 16 3000 15 2800 14 2600 13 2400 12 Index (Left) MSCI China A Share Sector Breakdown Jan 15 Nov 14 Dec 14 Sep 14 Oct 14 Aug 14 Jun 14 Jul 14 Apr 14 May 14 Jan 14 Feb 14 Mar 14 Dec 13 Oct 13 Nov 13 Sep 13 Aug 13 Jun 13 Jul 13 Apr 13 May 13 Jan 13 Feb 13 Mar 13 10 Nov 12 Dec 12 11 2000 Sep 12 Oct 12 2200 Financials (77 members) P/E Ratio, 12-Month Trailing (Right) Industrials (125 members) P erformanc e MS C I C hina A Index MS C I W orld Index S &P 5 00 Index E uro S toxx 5 0 Index F TS E 1 00 Index -‐1M 7.8% -‐0.9% -‐1.4% -‐2.0% 0.3% -‐12M 55.3% 6.6% 15.6% -‐8.0% -‐6.1% YTD 49.8% 5.9% 14.3% -‐8.6% -‐5.5% P E R atio* 17.7 17.6 18.2 23.7 19.6 * Bas ed on c urrent pric e and 12-‐month trailing earnings INVESTMENTS MAY GO UP OR DOWN IN VALUE AND YOU MAY LOSE SOME OR ALL OF THE AMOUNT INVESTED Consumer Discretionary (58 members) Materials (76 members) Information Technology (57 members) Health Care (56 members) Consumer Staples (32 members) Utilities (21 members) Energy (21 members) Telecommunication Services (2 members) ETF SECURITIES 6 ECONOMIC GROWTH China GDP Growth and Keqiang Index 25 13 • Q4 2014 GDP grew at a better-than-expected 7.3% y-o-y, bringing full-year growth to 7.4% in 2014. As China seeks a stable level of economic expansion we are likely to see growth in 2015 come in below 7%. • The “Keqiang index” index pointed to a weaker fourth quarter than the GDP figures imply. We are likely to see more easing by the PBoC to assist a smoother recovery. • Industrial production growth in December edged up to 7.9% y-o-y from 7.2% in November and 7.7% in October. • The official manufacturing purchasing manager’s index (PMI) however fell to 50.1 in December from 50.3 in November. • Preliminary HSBC/Markit manufacturing PMI for January 2015 rose to 49.8, an improvement from December 2014, but still below the 50 threshold separating expansion from contraction. • China retail sales appear to have stabilised in the 11-13% range from the overheated levels of the 2009-10 government stimulus period. Retail sales growth in December rose to 11.9% y-o-y from 11.7%.in November. • Fixed asset investment grew by 15.7% in 2014, significantly lower than the 19.6% recorded in 2013. As China strives for stable economic growth, fixed asset investments will continue to be rationalised in 2015. • The clamp-down on corruption in 2014 contributed to a sharper deceleration in fixed asset investment than would otherwise have been the case. With local governments now able to borrow under their own name, we expect the pullback from investment to abate. 12 20 11 15 10 9 10 The Keqiang index, named after Premier Keqiang is the equalweighted average of the year-onyear change in bank loans, rail freight volumes and electricity production 5 8 7 Keqiang Index 6mma (left) Jun 14 Dec 14 Jun 13 Dec 13 Jun 12 Dec 12 Jun 11 Dec 11 Jun 10 Dec 10 Jun 09 Dec 09 Jun 08 Dec 08 Jun 07 Dec 07 Jun 06 Dec 06 Jun 05 Dec 05 6 Dec 04 0 GDP y-o-y (right) China Industrial Production and Manufacturing PMI 25 65 60 20 50 Level % y-o-y 55 15 10 45 5 40 Industrial Production Growth, y-o-y (Left) Dec 14 Apr 14 Aug 14 Dec 13 Aug 13 Apr 13 Dec 12 Aug 12 Apr 12 Dec 11 Aug 11 Apr 11 Dec 10 Aug 10 Apr 10 Dec 09 Apr 09 Aug 09 Dec 08 Apr 08 Aug 08 Dec 07 Apr 07 Aug 07 Dec 06 Aug 06 Apr 06 35 Dec 05 0 Manufacturing PMI (Right) China Retail Sales 25 23 % y-o-y, 3mma 21 19 17 15 13 11 Dec 14 Jun 14 Dec 13 Jun 13 Dec 12 Jun 12 Dec 11 Jun 11 Dec 10 Jun 10 Dec 09 Jun 09 Dec 08 Jun 08 Dec 07 Jun 07 Dec 06 Jun 06 Dec 05 Jun 05 Dec 04 9 China Fixed Asset Investment 35 33 31 27 25 23 21 19 17 Dec 14 Jun 14 Dec 13 Jun 13 Dec 12 Jun 12 Dec 11 Jun 11 Dec 10 Jun 10 Dec 09 Jun 09 Dec 08 Jun 08 Dec 07 Jun 07 Dec 06 Jun 06 Dec 05 Jun 05 15 Dec 04 % ytd, y-o-y 29 INVESTMENTS MAY GO UP OR DOWN IN VALUE AND YOU MAY LOSE SOME OR ALL OF THE AMOUNT INVESTED ETF SECURITIES 7 TRADE, MONEY AND PRICES China Trade Trends 60 80 • Both export and import growth has been trending lower in recent months with imports contracting 2.4% y-o-y in December 2014. • Yuan depreciation has helped exports remain brisk with growth of 8.7% in December 2014. However, export growth has slowed from 13.1% in September 2014. • With exports still growing and imports contracting, the trade surplus had risen to all-time high of US$54.5bn in November before easing to US$49.6bn in December. • China’s foreign exchange reserves have been falling since an all-time high was reached in August 2014. • China’s reserves remain the highest in the world and more than three-times as high as Japan’s (the country with the second largest reserves). • M2 growth fell to 12.2% y-o-y in December compared to 12.9% y-o-y in September. • A late-2014 pick-up in aggregate financing could see money supply growth increase in coming months. • CPI inflation fell to 1.5% at the end of 2014 from 2.5% a year earlier. • With commodity price declines reducing the costs of production, producer price deflation has accelerated. • With inflation so low and far below the 3.5% target, the PBoC has plenty of room for further policy stimulus. 50 60 30 40 % y-o-y, 3mma % US$bn 3mma 40 20 10 20 0 0 -10 -20 -20 -30 -40 Dec 04 Apr 05 Aug 05 Dec 05 Apr 06 Aug 06 Dec 06 Apr 07 Aug 07 Dec 07 Apr 08 Aug 08 Dec 08 Apr 09 Aug 09 Dec 09 Apr 10 Aug 10 Dec 10 Apr 11 Aug 11 Dec 11 Apr 12 Aug 12 Dec 12 Apr 13 Aug 13 Dec 13 Apr 14 Aug 14 Dec 14 -40 Trade Balance, US$ bn (Left) Exports (Right) Imports (Right) Jun 14 %m-o-m, 3mma Dec 14 Jun 13 Dec 13 Jun 12 Jun 11 Jun 07 Level (Left) Dec 12 -2.0 Dec 11 -1.0 0.0 Jun 10 0.0 0.5 Dec 10 1.0 1.0 Jun 09 2.0 1.5 Dec 09 3.0 2.0 Jun 08 2.5 Dec 08 4.0 Dec 07 5.0 3.0 Jun 06 6.0 3.5 Dec 06 4.0 Dec 05 7.0 Jun 05 4.5 Dec 04 US$ tn China Foreign Exchange Reserves Growth (Right) China Money Supply 45 2500 40 35 % y-o-y 30 1500 25 20 1000 15 10 CNY Bn, 3mma 2000 500 5 0 Dec 04 Apr 05 Aug 05 Dec 05 Apr 06 Aug 06 Dec 06 Apr 07 Aug 07 Dec 07 Apr 08 Aug 08 Dec 08 Apr 09 Aug 09 Dec 09 Apr 10 Aug 10 Dec 10 Apr 11 Aug 11 Dec 11 Apr 12 Aug 12 Dec 12 Apr 13 Aug 13 Dec 13 Apr 14 Aug 14 Dec 14 0 M1 (Left) M2 (Left) All-System Financing (Right) China Inflation 15 % y-o-y 10 5 0 -5 CPI Inflation Dec 14 Jun 14 Dec 13 Jun 13 Dec 12 Jun 12 Jun 11 CPI Non Food Inflation Dec 11 Jun 10 Dec 10 Dec 09 Jun 09 Dec 08 Jun 08 Dec 07 Jun 07 Dec 06 Jun 06 Dec 05 -10 PPI Inflation INVESTMENTS MAY GO UP OR DOWN IN VALUE AND YOU MAY LOSE SOME OR ALL OF THE AMOUNT INVESTED ETF SECURITIES 8 INTEREST AND EXCHANGE RATES China Policy Interest Rates 8 3.7 7 • Policy interest rates were cut for the first time in over two years in November as the PBoC stepped up its fight against flagging growth and deflationary headwinds. • The cuts to the lending and deposit rates were asymmetric. The PBoC cut the 1-year benchmark lending rate 40bps (to 5.6%) and cut the 1-year deposit rate by 25bps (to 2.75%). • We expect several interest rate cuts to come in 2015, although policy efforts are more likely to focus on Reserve Requirement cuts. • After spiking close to 6% in December 2014, the 7-day repo rate fell back to 3.9% on 23 January 2015 after the PBoC intervened by injecting CNY50bn into the banking system via the 7-day repo market. • On 19 January 2015, Credit Default Swap spreads rose to their highest level since China’s first ever corporate bond default (March 2014). A series of growth forecast downgrades (IMF, World Bank) have cast doubt on China’s ability to maintain sufficient expansion to weather through its ambitious reform programme. We believe those fears are over-blown and CDS spreads have fallen markedly in recent days on the back of PBoC repo market intervention. • The Renminbi is trading close to the upper-end of its trading band at the moment after three months of continued depreciation against the US Dollar. • Those thinking that Yuan appreciation was a one-way bet have no doubt been burnt by two bouts of sharp depreciation in the past year. • The lack of reserve accumulation indicates that the depreciation is not being forced by the PBoC and could be symptomatic of weaker economic growth in China relative to strengthening economic growth in the US. 3.5 6 % 4 3.1 3 % 3.3 5 2.9 2 2.7 1 Spread (Right) Jun 14 Dec 14 Jun 13 Dec 13 Jun 12 Lending (Left) Dec 12 Jun 11 Dec 11 Jun 10 Dec 10 Jun 09 Dec 09 Jun 08 Dec 08 Jun 07 Dec 07 Jun 06 Dec 06 Jun 05 Dec 05 2.5 Dec 04 0 Deposit (Left) China Market Interest Rates 11 9 % 7 5 3 3m SHIBOR Jan 15 Jul 14 Jan 14 Jul 13 Jan 13 Jul 12 Jul 11 Jan 12 Jan 11 Jul 10 Jul 09 7d Repo Jan 10 Jan 09 Jul 08 Jan 08 Jul 07 Jan 07 Jul 06 -1 Jan 06 1 5yr Bond Yield China Sovereign 5y CDS 300 250 150 100 50 Jan 15 Jul 14 Jul 13 Jan 14 Jan 13 Jul 12 Jan 12 Jul 11 Jan 11 Jul 10 Jan 10 Jul 09 Jan 09 Jul 08 Jan 08 Jul 07 Jan 07 Jul 06 Jan 06 Jul 05 Jan 05 0 China Exchange Rate 6.45 6.40 Note: On 16/04/2012 band set to 1% around the official mid-point 6.35 On 17/03/2014 band set to 2% around the official mid-point 6.30 6.25 6.20 6.15 6.10 6.05 6.00 Jan 15 Nov 14 Sep 14 Jul 14 May 14 Mar 14 Jan 14 Nov 13 Sep 13 Jul 13 Mar 13 May 13 Jan 13 Nov 12 Sep 12 Jul 12 May 12 5.95 Mar 12 <------- Yuan Appreciation bps 200 INVESTMENTS MAY GO UP OR DOWN IN VALUE AND YOU MAY LOSE SOME OR ALL OF THE AMOUNT INVESTED ETF SECURITIES 9 PROPERTY AND FINANCE China Property Market 200 150 Residential Building Sales 14.0 Total Building Sales 12.0 70 City Residential Property Prices (Right) 10.0 • China saw residential building sales grow for the first time in a year in December 2014. The rate of decline in total building sales has also slowed in recent months indicating that sales are responding to lower prices. • The average price of newly built houses across 70 cities fell by 4.3% y-o-y in December. • While the government will likely maintain its policy of clamping down on real estate speculation, given the scale of urbanisation taking place in China it is unlikely that prices will fall substantially more except in some of the more speculative projects and locations. • Floor space sold continued to decline at a pace of 7.6% yo-y in December 2014, a small improvement over the November 2014 decline of 8.2% y-o-y. • Property building seemed to have gotten ahead of itself with a sharp acceleration in October being countered by a large contraction in November and December 2014. • The shadow banking sector has historically played an important role in financial sector intermediation in China. However, we expect interest rate liberalisation and other banking sector reforms to displace the role of shadow banks. • Trusts, the largest part of shadow banking, are regulated by the China Banking Regulatory Commission (CBRC), the same entity that regulates banks. With trusts playing a vital role in capital market deepening (one of key goals of the government), close oversight as well as support from the government is expected. • Shadow banks contracted in 2014, especially in the second half, as a clamp-down on corruption reduced local government reliance on opaque financing vehicles for their funding needs. With local governments now able to borrow under their own name we expect further decline in the role of shadow banks. • A surprising increase in shadow banking activity in December is likely to be more of an aberration than a trend. 8.0 % y-o-y 100 6.0 4.0 50 2.0 0.0 0 -2.0 -4.0 Jul 14 Oct 14 Apr 14 Jan 14 Jul 13 Oct 13 Apr 13 Jan 13 Jul 12 Oct 12 Apr 12 Jan 12 Jul 11 Oct 11 Apr 11 Jan 11 Jul 10 Oct 10 Apr 10 Oct 09 -6.0 Jan 10 -50 China Floor Space Started and Sold 250.0 60.0 50.0 200.0 40.0 150.0 30.0 100.0 20.0 10.0 50.0 0.0 0.0 -10.0 -20.0 Oct 09 Dec 09 Feb 10 Apr 10 Jun 10 Aug 10 Oct 10 Dec 10 Feb 11 Apr 11 Jun 11 Aug 11 Oct 11 Dec 11 Feb 12 Apr 12 Jun 12 Aug 12 Oct 12 Dec 12 Feb 13 Apr 13 Jun 13 Aug 13 Oct 13 Dec 13 Feb 14 Apr 14 Jun 14 Aug 14 Oct 14 Dec 14 -50.0 Floor Space Started (Left) Floor Space Sold (Right) China Sources of Finance 3-month Aggregate, CNY Bn 7000 6000 5000 4000 3000 2000 1000 RMB + FX Loans Shadow Banks Corporate Bond + Equity Financing Jun 14 Dec 14 Dec 13 Jun 13 Jun 12 Dec 12 Dec 11 Jun 11 Dec 10 Jun 10 Dec 09 Jun 09 Dec 08 Jun 08 Dec 07 Jun 07 Dec 06 Jun 06 Dec 05 Jun 05 Dec 04 0 Other China Contribution to Financing Growth 70% 50% 30% 10% -10% -30% -50% -70% RMB + FX Loans Shadow Banks Corporate Bond + Equity Financing Q4 2014 Q2 2014 Q4 2013 Q2 2013 Q4 2012 Q2 2012 Q4 2011 Q2 2011 Q4 2010 Q2 2010 Q4 2009 Q2 2009 Q4 2008 Q2 2008 Q4 2007 Q2 2007 Q4 2006 Q2 2006 Q4 2005 Q2 2005 Q4 2004 -90% Other INVESTMENTS MAY GO UP OR DOWN IN VALUE AND YOU MAY LOSE SOME OR ALL OF THE AMOUNT INVESTED ETF SECURITIES 10 POLICY EASING Date Policy Branch responsible Mar-14 Currency trading band widened and Renminbi depreciated People’s Bank of China Apr-14 CNY 800bn investment injection into railway infrastructure Apr-14 Apr-14 Increased social housing target to 7 million units of new starts (4.7 million units will come from shanty town redevelopment) Small businesses (with annual taxable income less than 100,000 yuan) will have tax halved from Jan 1 to end of 2016 Reserve requirement ratio cut for rural banks China Railway Corporation Central Government Jun-14 Cash injections to reduce short-term funding costs People’s Bank of China Jun-14 CNY 100bn quota set for relending to agriculture and small businesses People’s Bank of China Jun-14 Further reserve requirement ratio cut for small and rural banks People’s Bank of China Jun-14 Exclude certain loans and widen deposit definition for loan-to-deposit ratios to free up capacity of banks to lend Cut utility company taxes by CNY24bn People’s Bank of China Central/Local Government Sep-14 Li Keqiang reminds local governments of their "inescapable responsibility" to help meet annual growth targets. Widely viewed as a prod to speed up spending and avoid procrastination by local governments who have been reluctant to spend for fear of getting caught up in the corruption probe From October, small businesses (with annual revenue less than 30,000 yuan) will be exempted from VAT and business income tax, raising the threshold from 20,000 currently CNY 500bn of liquidity injected into five state-owned banks Sept 14 14-day repo rate target cut from 3.7% to 3.5% People’s Bank of China Sep-14 Mortgage rates and downpayment levels cut for some borrowers People’s Bank of China Oct-14 Central/Local Government Oct-14 State Council gives local governments the ability to borrow in their own right, while curbing borrowing via local government financing vehicles. While more a structural reform, it could help revive lending to sectors that were previously being crowded out. 14-day repo rate target cut from 3.5% to 3.4% Oct-14 CNY200bn injected into 20 large national and regional banks People’s Bank of China Apr - Oct 14 Local Governments Nov-14 Selective housing policy stimulus. Relaxation of house purchase restrictions (e.g. limitations on number of properties people can own) saw some easing of rules 1-year benchmark lending rate cut by 40bps to 5.60% Nov-14 1-year benchmark deposit rate cut by 25bps to 2.75% People’s Bank of China Nov-14 Deposit ceiling widened from 1.1 times to 1.2 times the deposit rate People’s Bank of China Nov-14 The number of lending and deposit benchmarks reduced, taking another step toward interest rate liberalisation th PBoC refrains from selling repos on 27 November to avoid draining funds from the banking system CNY50bn injected into banking system through 7-day reverse repos People’s Bank of China Apr-14 Jun-14 Jun-14 Sep-14 Nov-14 Jan-14 Central Government People’s Bank of China Central Government Central Government People’s Bank of China People’s Bank of China People’s Bank of China People’s Bank of China People’s Bank of China INVESTMENTS MAY GO UP OR DOWN IN VALUE AND YOU MAY LOSE SOME OR ALL OF THE AMOUNT INVESTED ETF SECURITIES 11 IMPORTANT INFORMATION This communication has been issued and approved for the purpose of section 21 of the Financial Services and Markets Act 2000 by ETF Securities (UK) Limited (“ETFS UK”) which is authorised and regulated by the United Kingdom Financial Conduct Authority (“FCA”). Investments may go up or down in value and you may lose some or all of the amount invested. Past performance is not necessarily a guide to future performance. You should consult an independent investment adviser prior to making any investment in order to determine its suitability to your circumstances. The information contained in this communication is for your general information only and is neither an offer for sale nor a solicitation of an offer to buy securities. This communication should not be used as the basis for any investment decision. Historical performance is not an indication of future performance and any investments may go down in value. This communication may contain independent market commentary prepared by ETFS UK based on publicly available information. Although ETFS UK endeavours to ensure the accuracy of the content in this communication, ETFS UK does not warrant or guarantee its accuracy or correctness. Any third party data providers used to source the information in this communication make no warranties or representation of any kind relating to such data. Where ETFS UK has expressed its own opinions related to product or market activity, these views may change. Neither ETFS UK, nor any affiliate, nor any of their respective, officers, directors, partners, or employees accepts any liability whatsoever for any direct or consequential loss arising from any use of this communication or its contents. ETFS UK is required by the FCA to clarify that it is not acting for you in any way in relation to the investment or investment activity to which this communication relates. In particular, ETFS UK will not provide any investment services to you and or advise you on the merits of, or make any recommendation to you in relation to, the terms of any transaction. No representative of ETFS UK is authorised to behave in any way which would lead you to believe otherwise. ETFS UK is not, therefore, responsible for providing you with the protections afforded to its clients and you should seek your own independent legal, investment and tax or other advice as you see fit. This communication is not, and under no circumstances is to be construed as, an advertisement or any other step in furtherance of a public offering of shares or securities in the United States or any province or territory thereof. Neither this communication nor any copy hereof should be taken, transmitted or distributed (directly or indirectly) into the United States. This communication constitutes an advertisement within the meaning of Section 31 para. 2 of the German Securities Trading Act (Wertpapierhandelsgesetz - WpHG); it is not a financial analysis pursuant to Section 34b WpHG and consequently does not meet all legal requirements to warrant the objectivity of a financial analysis and is also not subject to the ban on trading prior to the publication of a financial analysis. FOR INVESTMENT PROFESSIONAL USE ONLY, NOT FOR PUBLIC DISSEMINATION – PAST PERFORMANCE DOES NOT GUARANTEE RESULTS.


© Copyright 2026