
Physics B S Ä Measurement of Third-Order Nonlinear
Appl. Phys. B 32,137-143 (1983)
-
r
^
!
_ - i
MppilöUi
physics
Physics B S Ä
© Springer-Verlag 1983
Measurement of Third-Order Nonlinear Susceptibilities
by Non-Phase Matched Third-Harmonic Generation
M . Thalhammer and A . Penzkofer
Naturwissenschaftliche Fakultät II - Physik, Universität, D-8400 Regensburg,
Fed. Rep. Germany
Received 1 June 1983/Accepted 5 August 1983
Abstract. The third-order susceptibilities x xxx (~ 3 > i » v 1) °^
liquids, solids
and air are determined by third-harmonic generation. The samples are placed behind the
focal region of a laser beam in an evacuated environment to avoid third-harmonic
generation of the surroundings. F o r fluid media the sample cell is made out of two thin
fused quartz plates and oriented to an angle of zero net third-harmonic production in each
window (minimum Maker fringe position).
3
co
w
:
0 3
03
s
o
m
e
x
P A C S : 42.65
The measurement of third-order nonlinear susceptibilities x ( — co ; co co coJ responsible for thirdharmonic generation is aggravated by disturbing light
production in surrounding media (sample cell, air).
Avoiding the influence of the surrounding substances
in the light path by tight focussing (sample length
longer than confocal parameter) results in zero thirdharmonic generation under phase-matched condition
and for positive phase-mismatch Ak = k — 3k >0
(normal dispersive media). Only in anomalous dispersive matter light generation at frequency co occurs
[1, 2]. In a collimated pump beam (frequency c o j the
third-harmonic light is periodically generated and
annihilated for Ak + 0 and efficient light generation
requires Ak = 0. Circularly polarized laser light does
not generate third-harmonic light in transparent media
at all [6].
(3)
3
v
v
3
x
3
In this paper we report on an accurate method to
determine the third-order nonlinear susceptibilities
X ( — co ; co co co ) of solids, liquids and gases.
Third-harmonic generation in a slightly diverging
beam (thin sample behind focal plane of a lens) is
studied. Third-harmonic generation i n air along the
path of the laser beam is avoided by putting the sample
into a vacuum chamber. The entrance and exit windows of the sample cell for liquids and gases are made
out of thin plane fused silica plates (thickness:
« 0 . 2 mm). By tilting the cell to a Maker fringe minimum position for each window [11] no thirdharmonic light is produced in each of the windows.
The cell is slightly wedged in order to record a Maker
fringe curve when the filled cell is laterally shifted
relative to the light path.
(3)
3
v
v
t
(3)
Third-order nonlinear susceptibility values # ( — co ;
co co ,co )of
gases were obtained by putting a gas cell
with its entrance window (absorbing at co ) in the focal
plane of a laser [1], The susceptibilities of some solids
were measured in reflection [3]. A comparison of
third-harmonic generation with cascading secondorder processes was used to derive x ( — co ; co co
co ) values for liquids and solids [4, 5], In mixtures of
substances with normal and anomalous dispersion
optimum third-harmonic conditions were achieved
[6-10] and nonlinear susceptibility values could be
obtained.
3
v
1
1
1. Theory
3
(3)
3
x
v
v
The calculation of third-harmonic light generation
starts from the wave equation
2
d
2
2
n d
r
E
E
an d
ä? "?^ "7ä7
E = / l o
2
d
ö?
P N L
( 1 )
'
where E is the electrical field strength and P
the
nonlinear polarization; n and a are the refractive index
and the linear absorption coefficient, respectively. The
N L
®
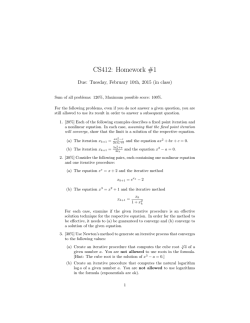
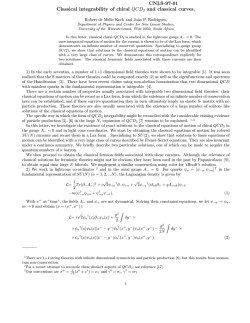
Fig. 1. (a) Experimental setup for third-harmonic
generation. (L1-L3: lenses, PD1, PD2: photodetectors, D C : dye cell for intensity detection, V C :
vacuum chamber, S: sample. F l , F2: filters, P M :
photomultiplier.) (b) Schematic light path through
sample cell S. (A: entrance window, B: inner space,
C : exit window, 6: tilting angle, Ö: wedge angle)
nonlinear polarization which is responsible for thirdharmonic generation is [12]
3
P =4£ < >;EEE
nl
(2)
Z
Insertion of (5) and (6) into (4) gives (E
=E
30x
d
a
17
3 0 +
30
\E
3 0 y
3
3 0
Y
(3)
with x being the third-order nonlinear susceptibility
tensor.
Equation (1) is solved with the plane-wave ansatz
for the third-harmonic generation process
<JO +CD
1
3a (z'-z )
1
1
0
-\iAk{z'-z )
•exp
A = A +A =^{A
1
+A
3
3 0
exp [ i ^ z - co tj]
1 0
exp [i(/c z - co ty] + c.c.},
3
.exp[- -^(z'-zj]
(3)
E (z') =
where A stands for E and P . A and A
are
amplitudes at co and co , respectively. Using
slowly varying amplitude approximation and
transformation z' = z and t' = t — nz/c leads to (ß =
1 0
3 0
3
the
the
the
1, 3)
3
E (z lC^X E (z )
ln c
30
x
30
0
10
0
3
•exp
y(z'-Z )-i<p(z )
0
0
exp {[(a - 3a, )/2 - i A k] (z' - z )} - 1
3
0
(a — 3a )/2 — \Ak
3
dz'
F o r transparent media (oc = a =0) Eq. (8) simplifies to
R
1
Neglecting the effect of P
field amplitude is given by
N L
1 0
E , o(z') = E ( z ) exp [ - utf
1 0
on E
1 0
(5)
0
In the experiments linearly polarized laser light is used,
i.e. E
=E , E y =E
= 0. F o r this situation the
nonlinear polarization P
reduces to
1 0 x
10
10
t
10
3
, the pump laser
- z )/2].
0
+ (p(z )
•exp
0
•sin[\d/c(z'-z )/2].
(9)
0
> z
N L > 3 0
Equation (9) indicates that the contribution to thirdharmonic light generation E (z') — E (z ) in a transparent medium of length z' —z is zero if z' — z
= 2ml , where l = n/Ak is the coherence length and
m is an integer. The thicknesses of our windows are
adjusted to this length condition (entrance window
^ 34fcoh> ^ window / = 32^ , Fig. lb) in order to
avoid contributions of the cell windows to the thirdharmonic light generated in the sample.
The light path through the sample cell is shown
schematically in F i g . l b . The cell has a wedge d. Its
entrance face is tilted to an angle 0 to the input light
30
^ . 3 o . ^ ) =
ß
o^(-
ö
3^i>
ö
i>
c
o
i) ?o(^)
£
0
(6)
0
and ^NL,3O,>; ^ N L , 3 O , z 0 for isotropic media and all
crystalline classes except triclinic and monoclinic. Ak
= k — 3k = (n co — 3n co )/c = 3co (n — nj/c
is the
wave vector mismatch. cp(z ) is the phase of the
nonlinear polarization at the initial position z . In the
further discussion X xxx(~^3 > v v ^ I ) * abbreviated by x \
3
x
=
3
3
1
1
1
3
0
0
3
x
{3
00
00
30
0
• exp { - i[A k(z' - z ) + cp(z )-]}
=
(8)
1
(4)
NL,0O-
2n
(7)
(3)
3
NL
l
ou
The solution of (7) is
x
+ (p{z
0
s
coh
=
coh
e x
c
oh
0
0
r {x) is the reflectivity of light of frequency co at the
interface x( = a,b,c, d). [r = — sin(0. — 0 )/sin (0. + 0 ),
where 0. and 6 are the angles of incidence and
refraction]. M(a) and M(b) denote the magnification of
the beam diameter in the plane of refraction
( M = cos0 /cos0 ). \x \ is determined from (13) by
measuring all quantities entering (11) and (13).
Using a cell with a slight wedge the cos(Akl ) dependence of //, (11), is observed by transverse displacement of the sample. In case of strong dispersion
cos(Akl ) averages already across the beam diameter
[<cos(4fc/ )>=0].
direction. The light is polarized perpendicular to the
plane of incidence. The input light amplitude E (a_)
before the entrance window is made negligibly small
by focusing the pump laser into a long vacuum
chamber and positioning the sample in the focal region
behind the focal plane (Fig. la). (Subscripts — and +
indicate positions before and after an interface, respectively.) A t the end of the transparent entrance
window A at position b_ it is E {b_) = E (l ) = 0,
since £ ( z = 0) = £ ( a ) = 0 and l = 2m l
with
m = 17, (9). A t the end c_ of the inner space of the cell
B of thickness l the amplitude E (c_) = E {l +,l ) is
given by (8) with £ ( z = /^) = 0 and z' — z = / . The
exit window C transfers the generated signal
E (l + l ) unchanged to the outside (except reflection
losses, see below) since its thickness is an integer
multiple of 2l
[see (9), E tf = l + l + l ) = E {z
= l + l \ since sin[J/c(z' - z ) / 2 ] = sin(zl/c/ /2) = 0].
The generated third-harmonic intensity is calculated
from (8) by using the relation I = (nce /2)\E\ . F o r the
conditions stated above [ £ ( a ) = 0, l = 2m l ] the
intensity at interface c is
±i
3O
3 O
o
3 O
+
3O
A
A
30
3 0
30
A
0
0
B
B
B
B
2. Experimental
B
coh
A
30
B
A
B
c
0
30
A passively mode-locked Nd-phosphate glass laser (v
= 9480cm" ) is used in the experiments. A single
transform limited pulse is selected in the early part of
the pulse train. Broadened spectra as they occur in
later parts of the pulse train cause a spreading of Ak
due to the dispersion of the refractive index and wash
out the Maker fringes. The selected pulse is increased
in energy by double passage through a Nd-glass
amplifier.
t
0
1
c
2
0
3 0
h(c-)
+
A
A coh
= K\ \ ll(b )
(3)
2
X
(10)
+
with
K =
I
B
A
A
co 3 {exp( — 3a l ) + exp( — oc l ) — 2 exp [ — (a + 3a )/ /2] cos(Akl )}
1
B
3 B
3
2
~~
2
1
B
B
2
n n\c*s \_{a - 3a ) /4 + Ak ~\
3
3
t
{3)
f
coh
30
r
t
A
B
i
L
30
(11)
x
The set-up for x -measurement i displayed in Fig. l a .
The input pulse energy W is registered with photodetector P D 1 . The input peak intensity I is determined
from energy-transmission measurements through a
saturable absorber with detectors P D 2 and P D 1 [13].
The laser pulse is focused with a lens L 2 of / = 30cm
focal length. This lens is placed in front of a 80 cm long
vacuum chamber (pressure: ^0.1 mbar). The sample is
positioned 36 cm behind the lens L 2 . The laser peak
intensity at the sample is in the range between 2 x 10
and 8 x 10 W / c m . In this intensity region light
generation at co by cascading parametric processes
(parametric interaction co +co -+co + co and frequency conversion co -\-co + co ^co ) is negligible
[14]. Behind the vacuum chamber the fundamental
laser is filtered out with filters F l . The third-harmonic
light is focused with lens L 3 to the photomultiplier P M
which measures the generated light energy W .
Detectors P D 1 and P M were cross-calibrated by detecting the same second harmonic signal with both
detectors and using spectral sensitivity curves for their
response to the fundamental (PD1) and thirdharmonic frequency (PM).
The sample cell for liquids has a length of l = 2 mm. Its
opening is rectangular having a width of 9 mm and a
height of 3 m m (small opening to avoid distortions in
vacuum chamber). The wedge of the cell along the
(3)
For transparent media K simplifies to
s
l
K =
2
col
sin {Akl /2)
B
A
2
2
n n\c z
(Ak/2)
3
(12)
'
In the experiments the energy conversion ratio rj
= W {d )/W {a_) of third-harmonic pulse energy
W (d ) after the end of the sample to incident fundamental pulse energy W (a_) before the entrance window is measured. F r o m (10) the energy conversion
rj = W (c^)/W (b ) may be calculated. F o r a Gaussian
temporal and spatial pulse shape one obtains
exp
3
3
+
1
+
x
3
1
+
3
x
+
3 / 2
lx l / (M.
(3)
2
2
(13)
0
I {b ) is the input peak intensity at the beginning of
the inner space of the cell. The energies W (c_), W (f> )
and the intensity I (b ) are related to the measurable
quantities W {d ), W^(a_) and / ( a _ ) by
10
+
3
10
3
+
+
(14)
M{a)M{b)
2
W,{b ) = W {a-) [1 - r
W,(c_) =
x
±1
(a)] [1 -r
W (d )
3
+
[l-ri (c)][l-ri (d)]'
3
+
10
1
+
1
+
/ (fe ) = / (a_)
1
9
9
2
3
l
W (c_) _ K
W {b ) " 3
10
3
2
±1
(b)],
(15)
(16)
1
1
s
s
I
I
3
3
B
of various solids, liquids and air have been measured. The results are summarized in Table 1.
The normalized signal S = fj/Il (b ) averaged over a
modulation period changes only slightly for the various substances. As an example at 5 x 10 W / c m an
energy conversion of 7 7 ~ 5 x l O
is obtained i n
water.
The |% |-values are presented in SI units. They are
transformed to esu-units by multiplying the reported
values with 9 x 10 /(47i) [12]. The relative error of the
presented data is estimated to be zlx /x — ± 0 . 2 . The
lx |-value of air is small because of the reduced
density of molecules in gaseous state. The nonlinear
susceptibilities of the liquids and solids vary over three
orders of magnitude. They are related to the electronic
transition frequencies and transition strengths. A n
increase of x is observed when co approaches an
absorption band (SF10, SF59, rutile, nitrobenzene,
2-nitrotoluene,
carbon
disulfide,
allo-ocimene).
Correspondingly, x increases with growing refractive
indices.
Instead of x the third-order hyperpolarizability y
may be used to characterize the media. It describes the
nonlinearity per molecule and is given by [26]
0
E
+
9
2
- 1 1
(3)
8
(3)
(3)
(3)
er.
z
o
>er
{3)
3
Q
UJ
M
i3)
<
et
o
{3)
1
LATERAL
2
3
DISPLACEMENT
xlmml
(3)
{
24s
NZ
„(3)-
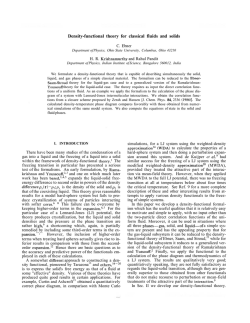
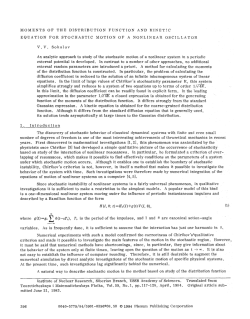
Fig. 2. (a) Third-harmonic generation in empty sample cell versus
tilting angle 0. Dashed curve (O), entrance window (fused silica
Suprasill, thickness d — 0.222 mm). Solid curve (•), empty cell
consisting of entrance plate with 9 = 6° and exit plate with
0 = O°. [Curves calculated, (12) and (13).] (b) Third-harmonic
generation versus lateral displacement x of wedged cell. Tilting
angle 9 = 9 = 5°. Dotted curve (•), empty cell. Solid curve (A),
methanol. Dashed curve (O), benzene. (Curves are fitted to experimental points, not calculated)
min
min
min
(3)
oX
(17)
4
is the number density of molecules. N
= 6.022169 x 1 0 m o l " is the Avogadro number, Q
the density and M the molar mass. L = (n\ + 2) (rc
+ 2)/81 is the Lorentz local field correction factor.
(Other definitions of y without factor 24 and £ are
sometimes used [1, 34, 36].)
The hyperpolarizability values y are listed in Table 1
(1 C m / V = 8.0888 x 10 esu). They exhibit a similar
dependence as % . In case of rutile y is reduced
compared to x due to the large local field correction
term L . The hyperpolarizability of air has about the
same value as the liquid water.
According to the anharmonic oscillator model [25, 26]
the hyperpolarizability y
is related to the linear
polarizabilities ^ = (3e /iV) {nf- l)/(n + 2) (i = l,3)
by
6m
«(3),' ( - co ; co co co J = £
(18)
y[
N = N Q/M
A
A
23
1
4
3
2
( 3 )
0
(3)
4
9 mm width is 5 = 0.46°. The Suprasil windows (microscope cover plates) have thicknesses of 0.222 and
0.209 mm. They are pressed to the brass cell with brass
fittings. Teflon washers are used for tightening. A cell
of 12 mm length was used for the investigation of air.
Figure 2a depicts the normalized third-harmonic signal S = t]/ll (b ) versus tilting angle 6 for the entrance
plate (dashed curve) and the empty cell (both windows,
solid curve). Figure 2b shows S versus displacement x
at a tilting angle 6 = 0 = 5° for the empty cell (dotted
line), for methanol (full line) and benzene (dashed line).
In case of methanol the modulation of S{x) due to the
cos(zi/d )-dependence of (11) is clearly seen. F o r
benzene the signal averages already within the laser
diameter.
0
+
m i n
B
3
24
(3)
( 3 )
(3)
4
( 3 )
1 }
2
0
1)3
3
v
19
where £ is the anharmonic coupling constant, m the
electron mass, e the electron charge and / the oscillator
strength.
Equation
(18) leads
to
X o c ( n - l ) ( n - l ) (Miller's rule [25]). The effective
anharmonic coupling constant £/f is listed in Table 1.
It is proportional to y /[y ^ y ]. The data indicate
strong anharmonic coupling constants for substance
with small y -values (LiF, water, air) while for substances with large nonlinearity y grows less rapidly
( 3 )
2
3
2
2
3. Results
X3)
(
)3
( 1}
3
The magnitude of the third-order nonlinear susceptibility
Xxxxx(-^3'^u
(<*>i
=2ncv
x
l9
v =9480 c m " )
x
(3)
( 3 )
Table 1. Third-order nonlinear susceptibilities and data relevant for their calculation (temperature 23 °C)
a
Substances
n,
a,
a
2
3
(3)
(3)
2
fj/I (b )
[10- cm /W ]
|* |
[10~ m /V ]
|y |
[ 10 ~
3.2
3.2
4.5
6.2
1.0
3.7
1.1
30
34
3.6
4.7
32
87
1.2
3.6
5.2
2800
2000
0.97
l.l
5.6
5.9
0.14
1.2
1.1
8.8
12.9
1.01
0.70
0.34
0.56
14.8
0.32
0.11
0.82
1.6
0.57
23.5
0.93
1.95
3.2
5.9
14.8
7.1
14.9
6.7
11.8
15.1
7.1
14.4
10.4
21.6
9.7
33.7
0.65
0.23
0.15
0.038
1.39
0.023
0.042
0.024
0.019
0.23
0.033
0.052
0.046
0.012
l0
+
30
4
2
23
2
2
6 1
c/f
C m / V ] [10 m
4
3
51
- 2
- 2
s ]
1
[cm' ]
Solids
Fused silica
Glass Bk7
Glass SF10
Glass SF59
LiF
Calcite E J c
Calcite E , I f , k , l c
Rutile Ej \\c
Rutile E i l e , k 1c
c
c
1.4501
1.5070
1.7024
1.9085
1.3870
1.4800
1.6429
2.7447
2.4823
b
1.4769
1.5392
1.8144
2.1233
1.4032
1.5040
1.6968
4.25
3.69
d
b
d
d
b
d
d
d
c
c
c
c
c
c
c
e
c
t
e
0
0
0
0
0
0
0
0
0
0
0.053
22.6
45.6
0
0
0
2x 10
4x 10
0.172
0.144
0.112
0.031
0
0
0
0
0
0.01
0
0
0.43
0.2
0
0
2.3xl0
0.2
0
0
0
0
0
2.48
2.25"
0
5900°
175
0.031
1.6
0.74
133
1.9
4.8
1.6
2.7
3.5
5.4
3.3
1.3
2.2
2.0
1.3
4.8
3.1
3.5
2.4
3.6
2.2
11.1
1.6
2.6
3.3
6.2
17.0
8.5
19
7.0
13.0
41.1
5.2
12.7
8.6
14.7
0
1.5
5.6 x 10-
4e
4e
q
r
s
q
r
s
Liquids
Water
Water + 6mol/l KI
Methanol
Ethanol
Acetone
CC1
Benzene
Benzonitrile
Nitrobenzene
Tuoluene
2-nitrotoluene
f
f
1.3252
1.4391
1.3225
1.3547
1.3511
1.4498
1.4286
1.5080
1.5258
1.4774
1.5236
1.5928
1.3915
1.4345
1.4187
1.4799
1.3487
1.5034*
1.3416
1.3778
1.3771 V
1.4848
1.5518
1.5861
1.6371
1.5402
1.6195*
1.7395
1.4294
1.5120
1.4896
1.5494
1.0002490™
1.0002598
g
h
h
1
1
1
f
4
f
h
h
h
h
h
h
h
h
1
cs
f
2
1,5-hexadiene
c, t 2,4-hexadiene
f, t 2,4-hexadiene
Allo-ocimene
f
h
h
j
k
1
1
j
k
-3
p
1
U
Gases
Air (0.9 bar)
' Absolute refractive index
From Glaswerke Schott, Mainz
Linear interpolated from [15]
Schott data sheet
[16]
Linear interpolated from [17]
[18]
m
0
h
Extrapolated from [17] using single
oscillator model [18]
Extrapolated from [19] using single
oscillator model [18]
Extrapolated from own measurements [20]
using single oscillator model [18]
Own measurements [20]
[21]
[15]
" [22]
1
J
k
1
m
3
x)
2
than y ^ y (£/f decreases). A similar behaviour was
reported in [28].
In Table 2 the measured X
( — co ; co co co^
values are compared with reported electronic thirdorder
nonlinear
susceptibility
contributions
X xxx,ei( — ^ <°v 2» 3)' The third-harmonic generation is caused by electronic nonlinearity. Our data are
in reasonable agreement with most reported numbers
(good agreement with [34]). In case of 6 molar K I
dissolved i n water x ^ (— co ; a> co coj is about a
half of ^ ( - c o ; co , o , - c ^ ) with co = 2co The
enlargement of x (~"^3> ^ 2 » 1> ~ i) responsible
for four wave mixing seems to be due to a two-photon
3
(
3)
X
0 3
3
XJC
3
19
v
03
a)
x
x
x
3
xx
2
(3)
3
v
v
2
2
03
CJO
v
4
0.54
4.0
° [23]
" [24]
Average molar mass of M = 70 g/mol is
assumed [17]
M= 162 g/mol is assumed [17]
M= 175 g/mol is assumed [17]
Apparent hyperpolarizability of
KI-ions [26]
For KI-ions [26]
q
r
s
1
u
resonance contribution (2co near to electronic transition in K I solution). The nonlinear "electronic" susceptibilities obtained from optical Kerr effect measurements with picosecond lasers [37-39] are about an
order of magnitude larger than the electronic nonlinear susceptibilities obtained from third harmonic
and four-photon frequency mixing experiments. This
fact indicates that the main contribution to the fast
part of the Kerr constant is still due to molecular
effects of short (subpicosecond) response time and not
of pure electronic origin. Nonlinear susceptibility contributions with subpicosecond response times have
been observed recently [40, 41].
2
Table 2. Electronic third-order nonlinear susceptibilities zS.x.v.ei ( —
Substance
w
i
co
co
i* i)
«
(
]
x\
Wavelength A,- = 27rc/co -
x xx
(
e l
1
( - w ; w , , co ,
4
2
15
[10 * esu]
[nm]
Solids
Fused silica
Fused silica
Fused silica
Glass Bk7
Glass (n = 1.516)
Glass BSC
Glass BSC
LiF
LiF
LiF
LiF
Calcite
Calcite
n
1055
694.3
557
1055
1055
1060
557
1055
694.3
1890
557
1055
1055
694.3
557
1055
1055
1060
557
1055
694.3
1890
557
1055
-
-
1055
527.5
1055
527.5
1055
555
1060
1055
1890
570
1060
555
1055
527.5
1055
527.5
1055
555
1060
1055
1890
532
1060
555
-
-
-
-
-
1055
745.7
594
1055
0
1060
594
1055
694.3
1890
594
1055
a
2.6
10
1\ 3.8
3.4
3.8
8
9.2 , 6.2
0.9 ,3 ,3.6
2
~\J
3.4 , 1.9
2.6 ,3.7
b
d
a
e
f
c
d
a
f
g
b
h
1 4
-
c
C
d
a
a
yd
4
d
Liquids
Water
Water
6 mol KI in water
6 mol KI in water
CC1
CC1
CC1
Benzene
Benzene
Benzene
Benzene
Benzene
Benzene
Nitrobenzene
Nitrobenzene
Nitrobenzene
Nitrobenzene
2-nitrotoluene
2-nitrotoluene
CS
CS
CS
CS
CS
Allo-ocimene
Allo-ocimene
4
4
4
2
2
2
2
2
1055
-1055
1055
-1055
1055
- 587
0
1055
1890
- 532
0
- 587
1.6"
1.5
8.0
19
4.5
11
8.7
12.2
15.8
20
10.6
17.5 , 18.4
14
14
40
16.7
300
9.3
330
30
86.5
87
30
120
ll
35
1
a
1
a
j
e
a
h
k
e
j
1055
555
1060
1060
1055
1060
1055
570
555
1060
1060
1055
1890
1055
555
1060
-1060
1055
-1060
1055
532
555
1060
-1060
1055
1890
1055
1055
1
d
-
1055
587
0
530
1055
530
1055
- 532
- 587
0
530
1055
1890
a
-
j
e
p
a
p
a
k
j
e
q
a
m
Gases
Air (p = 1 bar,
T =m K )
Air (p = 1 bar,
T = 273 K )
0
4a
4.9 x 10~ , 4.4
1055
n
0
694.3
0
3
694.3
694.3
2x 10~ or 7.9
n
0
a
This work
b
[ii]
c
[29]
[30]
e
[34]
f
[3]
g
[4]
h
[4]
i
[26]
j [32]
k
1
m
[33]
[35]
[36]
d
m
" x (air, Po, r ) = £f £
(3
0
Z
» (air, p, T)
P -»o
° [1]
From optical Kerr effect (x xx ,ei ( « , CÜJ, —co co ) = i
n, refractive index at a> '•> i nonlinear electronic optical Kerr
index [12] [37] (see text)
From optical Kerr effect [39] (see text)
p
l
—
XX
n
2
q
2
lt
2
co )
3
4. Conclusions
We described a technique for the accurate measurement of third-order nonlinear susceptibilities responsible for third-harmonic generation. The technique was
applied to determine nonlinear susceptibility and hyperpolarizability values of some liquids, solids and air.
The described method may be easily extended to the
measurement of other third-order nonlinear susceptibilities
—ctf ; ±co
± c o , ±co ) responsible for
four-wave interaction processes.
4
l9
2
3
Acknowledgements. The authors thank Prof. M . Maier for helpful
discussions. They are indepted to Th. Ascherl for technical assistance, to W. Leupacher for assistance in the later part of the work,
and to Dr. G . Meyer for help in the numerical analysis. They thank
the "Deutsche Forschungsgemeinschaft" for financial support and
the "Rechenzentrum" of the University for providing computer time.
References
1. J.F. Ward, G.H.C. New: Phys. Rev. 185, 57 (1969)
2. R. Fischer, L.W. Wieczorek: Ann Physik 7. Folge, 35, 389 (1978)
3. C.C. Wang, E.L. Baardsen: Phys. Rev. 185, 1079 (1969); Phys.
Rev. B1, 2827(E) (1970)
4. J.P. Hermann: Opt. Commun. 9, 74 (1973)
5. S.A. Akhmanov, L.B. Meisner, S.T. Parinov, S.M. Saltiel, V.G.
Tunkin: Sov. Phys. JETP 46, 898 (1977)
6. P.P. Bey, J.F. Guiliani, H . Rabin: IEEE J. QE-4, 932 (1968);
Phys. Lett. 26 A, 128 (1968)
7. R.K. Chang, L.K. Calbraith: Phys. Rev. 171, 993 (1968)
8. J.C. Diels, F.P. Schäfer: Appl. Phys. 5, 197 (1974)
9. H.P. Puell, C R . Vidal: IEEE J. QE-14, 364 (1978)
10. S.RJ. Brueck, H . Kildal: Opt. Lett. 2, 33 (1978)
11. P.D. Maker, R.W. Terhune: Phys. Rev. 137, A 801 (1965)
12. R.W. Minck, R.W. Terhune, C.C. Wang: Appl. Opt. 5, 1595
(1966)
13. A. Penzkofer, D. von der Linde, A. Laubereau: Opt. Commun. 4,
377 (1972)
14. A. Penzkofer, W. Kaiser: Opt. Quant. Electron. 9, 315 (1977)
15. D.E. Gray (ed.): American Institute of Physics Handbook, 3rd ed.
(McGraw-Hill, New York 1972)
16. M . Cardona, G . Harbeke: Phys. Rev. 137, A1467 (1965)
17. K . H . Hellwege, A . M . Hellwege (eds.): Landolt-Börnstein,
6th
edn., Vol. 2, Part 8 (Springer, Berlin, Heidelberg, New York
1962)
18. A. Penzkofer, H . Glas, J. Schmailzl: Chem. Phys. 70, 47 (1982)
19. International Critical Tables of Numerical Data, Physics,
Chemistry and Technology, Vol. VII, ed. by E.W. Washburn
(McGraw-Hill, New York 1930)
20. K. Schmid, A. Penzkofer: Appl. Opt. 22, 1824(1983)
21. Beilsteins Handbuch der Organischen Chemie, 4. edn., 3.
Ergänzungswerk, Erster Band, 1. Teil, ed. by F. Richter
(Springer, Berlin, Heidelberg, New York 1958) p. 985
22. D M S U V Atlas of Organic Compounds, Vol. I, eds. by H . H .
Perkampus, I. Sandeman, C.J. Timmons (Verlag Chemie,
Weinheim; Butterworth, London 1971) p. D8/5
23. L. Dede, A. Rosenberg: Ber. Dtsch. Chem. Ges. 67, 147 (1934)
24. E. Pietsch (ed.): Gmelins Handbuch der Anorganischen Chemie, 8.
edn. (Verlag Chemie, Weinheim 1970)
25. F. Zernike, J.E. Mitwinter: Applied Nonlinear Optics (Wiley,
New York 1973)
26. A. Penzkofer, J. Schmailzl, H . Glas: Appl. Phys. B29, 37 (1982)
27. R.C. Miller: Appl. Phys. Lett. 5, 17 (1964)
28. K.C. Rustagi, J. Ducuing: Opt. Commun. 10, 258 (1974)
29. M . D . Levenson: IEEE J. QE-10, 110 (1974)
30. R.W. Hellwarth: Prog. Quant. Electron. 5, 1 (1977)
31. C.C. Wang: Phys. Rev. B2, 2045 (1970)
32. M.D. Levenson, N. Bloembergen: J. Chem. Phys. 60,1323 (1974)
33. A. Owyoung: Opt. Commun. 16, 266 (1976)
34. B.F. Levine, C G . Bethea: J. Chem. Phys. 63, 2666 (1975)
35. M.D. Levenson, N . Bloembergen: Phys. Rev. BIO, 4447 (1974)
36. J.P. Hermann, J. Ducuing: J. Appl. Phys. 45, 5100 (1974)
37. J. Etchepare, G . Grillon, R. Muller, A. Orszag: Opt. Commun.
34, 269 (1980)
38. J. Etchepare, G . Grillon, R. Astier, J.L. Martin, C. Bruneau, A.
Antonetti: In Picosecond Phenomena III, ed. by K.B. Eisenthal,
R.M. Hochstrasser, W. Kaiser, A. Laubereau, Springer Series
Chem. Phys. 23 (Springer, Berlin, Heidelberg, New York 1982)
p. 217
39. P.P. Ho, R.R. Alfano: Phys. Rev. A 20, 2170 (1979)
40. J.M. Halbout, C L . Tang: Appl. Phys. Lett. 40, 765 (1982)
41. B.I. Greene, R . C Farrow: Chem. Phys. Lett. 98, 273 (1983)

© Copyright 2026