
Extended in vivo anterior eye-segment imaging with full
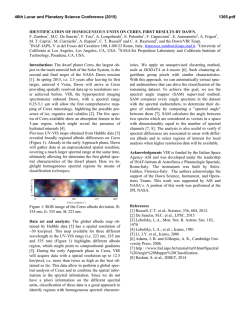
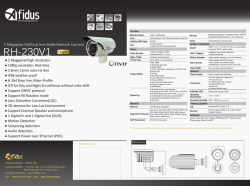
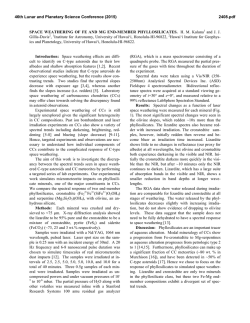
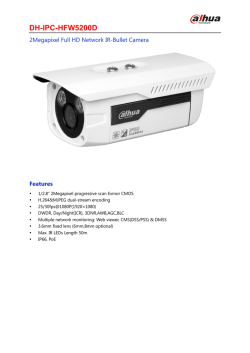
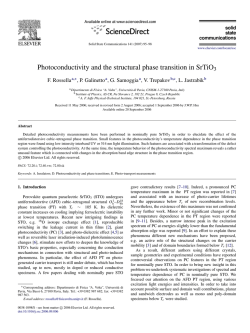
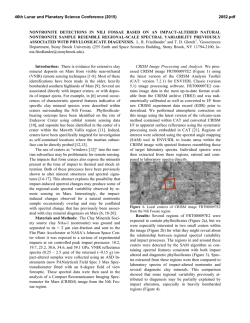
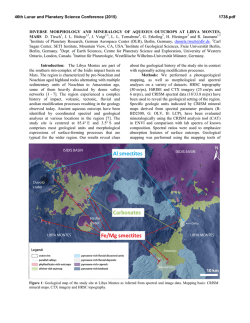
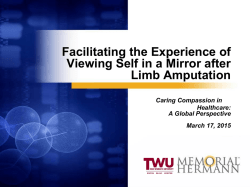
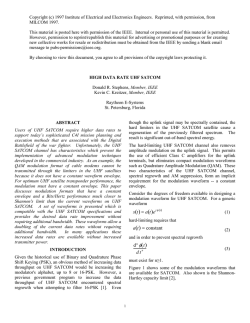
JBO LETTERS Extended in vivo anterior eye-segment imaging with full-range complex spectral domain optical coherence tomography Johannes Jungwirth, Bernhard Baumann, Michael Pircher, Erich Götzinger, and Christoph K. Hitzenberger Medical University of Vienna, Center for Biomedical Engineering and Physics, Waehringer Stasse 13, A-1090 Vienna, Austria Abstract. We demonstrate the capability of full-range complex 共FRC兲 spectral domain optical coherence tomography 共SD-OCT兲 to image the anterior eye segment from the cornea to the posterior surface of the lens. With an adapted spectrometer design, we developed a SD-OCT system with an extended normal 共single half-space兲 depth range of 7 mm 共in air兲. This OCT-intrinsic depth range was doubled with a FRC technique. We demonstrate the performance of our OCT system by imaging the whole anterior segment of a healthy human eye in vivo. © 2009 Society of Photo-Optical 关DOI: 10.1117/1.3213569兴 Instrumentation Engineers. Keywords: biomedical optics; ophthalmology; imgaging systems. Paper 09034LR received Feb. 6, 2009; revised manuscript received Jun. 5, 2009; accepted for publication Jul. 10, 2009; published online Sep. 8, 2009. Optical coherence tomography 共OCT兲 is an imaging modality that enables high-resolution cross-sectional imaging of biological tissues and translucent materials.1,2 Spectral domain 共SD兲 OCT is a high-speed and high-sensitivity variant of OCT that largely replaced the older time domain variant in the recent years. In SD-OCT, the depth-resolved information can be reconstructed by Fourier transform of the cross spectral density measured with a spectrometer located in the detection arm of an interferometer.3,4 However, SD-OCT suffers from two drawbacks that restrict its measurement range. First, the Fourier transform of the real-valued crossspectral density is symmetrical about the zero path difference. Therefore, one cannot distinguish between positive and negative optical path differences with respect to the reference mirror. This effect particularly concerns imaging of objects with larger depth extensions, such as the anterior eye segment, where measurement ranges of the order of 10 mm are needed. In order to suppress the mirror images, the so-called fullrange complex 共FRC兲 technique was introduced.5 In addition to the amplitude of the spectral interferogram, its phase is measured to reconstruct the full complex spectral interferogram—the analytic function. Inverse Fourier transformation of the analytic function directly yields the true obAddress all correspondence to: Christoph K. Hitzenberger, Tel: 0043-1-427760711; Email: [email protected] Journal of Biomedical Optics Fig. 1 Schematic setup of the FRC-SD-OCT system. SLD, super luminescent diode; C, collimator; NPBS, nonpolarizing beamsplitter; VDF, variable density filter; M, reference mirror; GS, x-y galvanometer scanner; OL, object lens; S, sample; DAQ, data acquisition card; SMF, single-mode fiber; DG, diffraction grating; CL, camera lens; LSC, line scan camera; and FGC, frame grabber card. ject structures without any mirror terms. Several FRC approaches were developed that differ in the way of generating the / 2 phase-shifted quadrature function of the spectral interferometric signal.6–8 An elegant method uses the phase modulation that is introduced by off-pivot-point illumination of the galvanometer scanner mirror.9–11 A second drawback of SD-OCT is the spectrometer-intrinsic depth range, which is limited by its spectral resolution. Until now, the depth range of standard SD-OCT systems is ⬃3 mm, which can be doubled by applying FRC methods. However, this axial measurement range is not sufficient to cover the entire anterior eye segment. In this letter, we demonstrate an SD-OCT system with a modified spectrometer design combined with a FRC measurement range doubling that achieves an imaging depth of 14 mm, sufficient to cover the human anterior eye segment from the cornea to the posterior surface of the lens. Figure 1 shows a schematic diagram of our system. A superluminescent diode 共Superlum, Moscow兲 with a center wavelength of 835 nm and a bandwidth 共FWHM兲 of 18 nm was used as the light source. The round trip coherence length was 17 m. The collimated beam 共1.5 mm diam兲 was divided by a 50/ 50 nonpolarizing beamsplitter into a reference and a sample beam. A variable neutral density filter was mounted in the reference arm to adjust the light power so that the line-scan camera of the spectrometer is operated close to the saturation limit to get maximum sensitivity. In the sample arm, a galvanometer scanner was mounted on an x-y translation stage for correct adjusting of the scanner position to achieve a / 2 phase shift between adjacent A scans.9 The scanner was driven by a saw-tooth voltage generated by a DAQ-card 共National Instruments, PCI 6110, Austin, TX兲. An achromatic object lens with a focal length of 80 mm was used to focus the beam onto the sample. This provided a transversal resolution of ⬃57 m with a confocal range of 6 mm. Sample and reference beams were recombined at the 50/ 50 splitter, coupled into a single mode fiber and guided to the 1083-3668/2009/14共5兲/050501/3/$25.00 © 2009 SPIE 050501-1 Downloaded From: http://spiedigitallibrary.org/ on 02/06/2015 Terms of Use: http://spiedl.org/terms September/October 2009 쎲 Vol. 14共5兲 JBO LETTERS Fig. 2 In vivo measurements of human anterior eye segment: 共a兲 B scan with 2048 A scans obtained by standard SD-OCT processing; 共b兲 full-range reconstruction by FFT of the complex spectral interferometric signal; image range from cornea to back surface of the lens. Extinction ratio at the iris: 22 dB; image size: 14⫻ 14 mm2; and Dynamic range 50 dB. spectrometer where the real part of the spectral interferogram S共x , 兲 was recorded. The spectrometer consisted of a transmission diffraction grating 共Wasatch Photonics, Logan, Utah兲 with 1500 lines/ mm, an achromatic camera lens with a focal length of 300 mm, and a 2048 pixel line-scan camera 共Atmel, Aviiva M2 CL 2014, San Jose, CA兲 with 14⫻ 14 m2 pixel size. In our configuration, the spectrometer resolution was 25 pm. The SD-OCT intrinsic depth range, which is limited by the Nyquist sampling theorem, was measured with 7 mm 共in air兲.6 After applying the full-range algorithm, the depth range was doubled to an axial imaging range of 14 mm. The probing beam power on the cornea was 2 mW, which is well below the safety limits.12 The integration time per A scan was set to 50 s to optimize the trade-off between mirror term suppression and sensitivity. With this setting, the sensitivity of the system was measured with ⬃106 dB near zero position. The sensitivity decrease was ⬃17 dB over three-quarters of the depth range. The system worked with an A-scan rate of 20 kHz. A single B scan with 2048 A-scans was recorded in ⬃100 ms. The acquisition time for a 3-D scan with 120 B scans was ⬃15 s. The scanning range covered the whole transversal width of the anterior eye segment 共14 mm for a single B scan and 14⫻ 14 mm2 for a 3-D scan兲. In conventional SD-OCT, the intensity distribution I共x , z兲 共which represents the depth profiles兲 is retrieved by inverse Fourier transform of the recorded spectral interferogram −1 I共x , z兲 = FTk→z 兵S共x , k兲其, where x is the transversal scanning direction, z the axial depth range, and k the wavenumber. Prior to the Fourier transform, fixed pattern noise and dc term were removed by subtracting a mean spectrum 共averaged over 2048 A scans兲 from each spectral data set, followed by rescaling the spectral data from space into k space. As mentioned above, the Fourier transform of a real valued function is Hermitian, and therefore, the depth profile is symmetrical about zero path difference, giving rise to mirror artifacts in conventional SD-OCT. To suppress these mirror artifacts and double the measurement range, we used a phase shift introduced by the x scanning mirror.9–11 In brief, the Journal of Biomedical Optics sample beam hits the fast scanning mirror slightly away from the scanner pivot axis. Therefore, during the transversal scan, the optical path length is changed. A constant phase shift between adjacent A scans is generated that depends on the mirror axis offset. If the phase difference is set appropriately 共 / 2兲, one can reconstruct the complex spectral interferogram by Hilbert transform of S共x , k兲 along the transverse coordinate x for each wavenumber k. Finally, an inverse Fourier transform of each complex spectral A scan yields the depth profiles with suppressed mirror images. The measured spectral interferograms were transferred via camera link and a high-speed frame grabber card 共National Instruments, PCI 1428, Austin, Taxas兲 to a personal computer, where the data were stored and postprocessed. We demonstrate the performance of our system by 2-D and 3-D imaging of the human anterior eye segment in vivo. Figure 2 shows a B scan. The signal intensity was plotted on a logarithmic gray scale and covers an image size of 14 共x兲 ⫻ 14 共z, optical distance兲 mm2. Figure 2共a兲 shows a SD-OCT image obtained by inverse fast Fourier transform 共FFT兲 of the spectral interferogram without applying FRC reconstruction. The object structure is disturbed by overlapping of mirror images. Figure 2共b兲 shows the same data set with FRC postprocessing. Note that the imaging depth ranges from the front surface of the cornea to the posterior surface of the lens. Even the epithelium of the cornea and backscattered intensity within the lens can be observed, as well as the lens capsule. However, there are still some residual mirror artifacts from highly backscattering structures, such as the iris. To quantify the mirror term suppression of our system, the extinction ratio was measured within a highly backscattering structure 共iris in vivo兲 and at a weakly scattering black synthetic 共nonmoving兲 surface.9 Only pixels with an intensity level above a certain threshold 共noise level兲 in both imaging regions 共corresponding to the positive and negative frequencies兲 were used to calculate the extinction ratio. With this convention, the extinction ratio was measured from Fig. 2共b兲 with 22 dB in contrast to the nonmoving sample with 36 dB. The reduced extinction ratio might be caused by sample mo- 050501-2 Downloaded From: http://spiedigitallibrary.org/ on 02/06/2015 Terms of Use: http://spiedl.org/terms September/October 2009 쎲 Vol. 14共5兲 JBO LETTERS Fig. 3 OCT B-scans during the accommodation of the eye from 共a兲 the far point to 共b兲 the near point. Changes of the anterior eye segment, especially the thickness of the lens, are visible. The white lines are for better visualization of the lens surface position changes during accommodation. tion that leads to phase instabilities and loss in mirror term suppression efficiency. Axial sample motion of ⬎2 mm/ s would inverse the suppression effect 共suppressing the real image and enhancing the mirror image兲.9 Figure 3 shows the anterior eye segment during the accommodation from the far point 共a兲 to the near point 共b兲. The bright lines in both figures indicate the lens surfaces and demonstrate the thickness-change of the lens. Video 1 shows a 3-D scan of the anterior eye segment. It contains 120 sequenced B scans, which were recorded during one sweep of the y scanner mirror. The size of the 3-D scan is approximately 14共x兲 ⫻ 14共y兲 ⫻ 14共z兲 mm3. Video 2 shows the same 3-D data set in the en face plane. One drawback of this method is that only a fixed scanning pattern 共transversal range and speed兲 can be used for a specific scanning-mirror pivot-point offset. To overcome this problem, a motorized mount for the transverse scanner can be used. However, this would result in a more expensive and more complex system. Conclusion In conclusion, we have developed a SD-OCT system with an extended depth range. With the high sensitivity and high speed of the instrument, the whole anterior eye segment from the cornea to the posterior surface of the lens could be imaged in vivo with a recording time of ⬃100 ms per B scan at an A Video 1 3-D scan of the anterior eye segment; movie contains sequence of 120 B scans that were recorded in ⬃15 s. Size: 14⫻ 14 ⫻ 14 mm3 共QuickTime, 4.5 MB兲. 关URL: http://dx.doi.org/10.1117/1.3213569.1兴. Journal of Biomedical Optics Video 2 Video derived by the same data set showing the en face cross sections of the anterior eye segment from the cornea via the iris to the lens. Size: 14⫻ 14⫻ 14 mm3 共QuickTime, 2.6 MB兲. 关URL: http://dx.doi.org/10.1117/1.3213569.2兴. scan rate of 20 kHz; 120 sequenced B scans formed a 3-D scan, which was recorded in ⬃15 s. Possible clinical applications of our system may be in cataract and glaucoma 共chamber angle兲 diagnostics, as well as in accommodation studies. Acknowledgments Technical support by C. Wölfl and financial support by the Austrian Science Fund 共FWF Grant No. P 19624-B02兲 are gratefully acknowledged. References 1. D. Huang, E. A. Swanson, C. P. Lin, J. S. Schumann, W. G. Stinson, W. Chang, M. Hee, T. Flotte, K. Gregory, C. A. Puliafito, and J. G. Fujimoto, “Optical coherence tomography,” Science 254, 1178–1181 共1991兲. 2. A. F. Fercher, W. Drexler, C. K. Hitzenberger, and T. Lasser, “Optical coherence tomography-principles and applications,” Rep. Prog. Phys. 66, 239–303 共2003兲. 3. A. F. Fercher, C. K. Hitzenberger, G. Kamp, and S. Y. El-Zaiat, “Measurement of intraocular distancs by backscattering spectral interferometry,” Opt. Commun. 117, 43–48 共1995兲. 4. G. Häusler and M. W. Lindner, “Coherence radar and spectral radar—new tools for dermatological diagnosis,” J. Biomed. Opt. 3, 21–31 共1998兲. 5. A. F. Fercher, R. Leitgeb, C. K. Hitzenberger, H. Sattmann, and M. Wojtkowski, “Complex spectral interferometry OCT,” Proc. SPIE 3564, 173–178 共1999兲. 6. M. Wojtkowski, A. Kowalczyk, R. Leitgeb, and A. Fercher, “Full range complex spectral optical coherence tomography technique in eye imaging,” Opt. Lett. 27, 1415–1417 共2002兲. 7. R. Leitgeb, C. K. Hitzenberger, A. Fercher, and T. Bajraszewski, “Phase-shifting algorithm to achieve high-speed long-depth-range probing by frequency-domain optical coherence tomography,” Opt. Lett. 28, 2291–2203 共2003兲. 8. E. Götzinger, M. Pircher, R. Leitgeb, and C. K. Hitzenberger, “High speed full range complex spectral domain optical coherence tomography,” Opt. Express 13, 583–594 共2005兲. 9. B. Baumann, M. Pircher, E. Götzinger, and C. K. Hitzenberger, “Full range complex spectral domain optical coherence tomography without additional phase shifters,” Opt. Express 15, 13375–13387 共2007兲. 10. L. An and R. Wang, “Use of a scanner to modulate spatial interferograms for in vivo full-range Fourier-domain optical coherence tomography,” Opt. Lett. 32, 3423–3425 共2007兲. 11. R. Leitgeb, R. Michaely, T. Lasser, and S. Sekhar, “Complex ambiguity-free Fourier domain optical coherence tomography through transverse scanning,” Opt. Lett. 32, 3453–3455 共2007兲. 12. International Electrotechnical Commission, Safety of laser products—Part 1: Equipment classification and requirements, IEC 60825–1 Ed. 2 共2001兲. 050501-3 Downloaded From: http://spiedigitallibrary.org/ on 02/06/2015 Terms of Use: http://spiedl.org/terms September/October 2009 쎲 Vol. 14共5兲

© Copyright 2026