
LBB Executive Summary - Legislative Budget Board
LEGISLATIVE BUDGET BOARD Executive Summary of Legislative Budget Board Reports SUBMITTED TO THE 84TH TEXAS LEGISLATURE PREPARED BY LEGISLATIVE BUDGET BOARD STAFF JANUARY 2015 Executive Summary of Legislative Budget Board Reports SUBMITTED TO THE 84TH TEXAS LEGISLATURE LEGISLATIVE BUDGET BOARD STAFF JANUARY 2015 CONTENTS CROSS FUNCTION GOVERNMENT EFFECTIVENESS AND EFFICIENCY Improve Data Collection and Reform State Truancy Laws to Enhance the Quality of Truancy Interventions ................. 1 Increase Transparency of Discretionary Transfers from the School Land Board’s Real Estate Special Fund ...................... 3 OTHER REPORTS Overview of Impacts of Hydraulic Fracturing in Texas, Legislative Primer...................................................................... 4 ECONOMIC DEVELOPMENT AND REGULATION GOVERNMENT EFFECTIVENESS AND EFFICIENCY Modify the Texas Medical Liability Joint Underwriting Association ............................................................................... 5 Modify the Insurance Guaranty Model to Better Align Market Incentives and Prevent the Loss of Future State Revenue ............................................................................................................................................................. 6 Strengthen Enforcement of the Amusement Ride Program to Improve Compliance ...................................................... 7 Define and Establish Penalties for Worker Misclassification............................................................................................ 8 Improve Accountability of Local Workforce Board and Job Training Programs ............................................................ 10 FISCAL POLICY AND ANALYSIS GOVERNMENT EFFECTIVENESS AND EFFICIENCY Modify Equity Appeals for Property Appraisals to Ensure Uniformity .......................................................................... 11 Modify Agricultural Land Appraisal Protocols .............................................................................................................. 12 Increase Funding to Improve Long-Term Disaster Recovery......................................................................................... 13 Improve Oversight of Funds Related to the Deepwater Horizon Oil Spill .................................................................... 15 Overview of the Economic Stabilization Fund ............................................................................................................. 17 The Affordable Care Act’s Effects on Texas Employers .................................................................................................. 19 OTHER REPORTS Further Reduce Reliance on General Revenue–Dedicated Accounts for Certification of the State Budget .................... 20 GOVERNMENT OPERATIONS AND EMPLOYEES GOVERNMENT EFFECTIVENESS AND EFFICIENCY Overview of State Office Space Planning ...................................................................................................................... 23 HIGHER EDUCATION GOVERNMENT EFFECTIVENESS AND EFFICIENCY Align New Graduate Medical Education Funding with the Healthcare Needs of the State ........................................... 25 Strengthen the Returned Value Funding Approach for the Texas State Technical College System ................................. 27 Clarify Eligibility for Professional Nursing Shortage Reduction Program Funds to Increase Awards for Texas Students .......................................................................................................................................................... 28 Evaluate the Nursing Field of Study Curriculum to Increase the Number of Nurses with Advanced Degrees ............... 29 EXECUTIVE SUMMARY OF LEGISLATIVE BUDGET BOARD REPORTS – JANUARY 2015 – ID: 1880 i CONTENTS Overview of Current Practices and Alternatives for Higher Education Capital Funding ............................................... 30 Overview of Research Activities at Education Research Centers ................................................................................... 32 OTHER REPORTS Report on the Hazlewood Exemption .......................................................................................................................... 33 HEALTH AND HUMAN SERVICES GOVERNMENT EFFECTIVENESS AND EFFICIENCY Improve the Evaluation and Administration of the Medicaid Adult Substance Use Disorder Treatment Benefit ........... 35 Evaluate Pay for Quality Measures in the Texas Medicaid Program............................................................................... 37 Improve Transparency in STAR Managed Care Payment Rate Setting .......................................................................... 38 Improve Rate Setting and Data to Allow Comparison of PACE to STAR+PLUS ......................................................... 39 Coordinate Nursing Facility Resident Complaint Data to Enhance the Quality of Care............................................... 41 Improve Data and Oversight to Reduce the Prevalence of Early Elective Deliveries of Newborns ................................. 42 Overview of Family Planning Services in Texas............................................................................................................. 43 OTHER REPORTS Healthcare Reform, Legislative Primer ......................................................................................................................... 44 JUSTICE AND PUBLIC SAFETY GOVERNMENT EFFECTIVENESS AND EFFICIENCY Overview of the Texas Juvenile Justice Department’s Secure Institutions and Placement Process .................................. 45 Overview of Texas Border Security Funding and Activities ........................................................................................... 47 Improve Transparency, Coordination, and Oversight of State Border Security Activities............................................... 49 Develop Plans to Adopt Incident-Based Crime Reporting in Texas .............................................................................. 51 Improve Driver Responsibility Program Compliance and Promote Good Driving Behavior ......................................... 53 Improve Public Safety by Authorizing All Counties to Adopt Fire Codes ..................................................................... 54 Expand the Market to Which Texas Correctional Industries Can Sell Goods and Services ............................................ 55 Overview of Estimated Net Costs of Technical Revocations from Parole ...................................................................... 56 OTHER REPORTS Adult and Juvenile Correctional Population Projections, Fiscal Years 2015 to 2020 ...................................................... 57 NATURAL AND CULTURAL RESOURCES GOVERNMENT EFFECTIVENESS AND EFFICIENCY Improve Available Information on Brackish Groundwater for Water Planning ............................................................. 59 Improve State and Local Drought Planning to More Effectively Manage Water Resources ........................................... 60 Revenue Enhancement Options for the Water Resource Management Account ........................................................... 61 Overview of Responsibilities and State Oversight of River Authorities ......................................................................... 63 Overview of Funding and Maintenance Needs for the Texas State Park System ............................................................ 64 ii EXECUTIVE SUMMARY OF LEGISLATIVE BUDGET BOARD REPORTS – JANUARY 2015 – ID: 1880 CONTENTS OTHER REPORTS Management Review of the Brazos River Authority...................................................................................................... 65 PUBLIC EDUCATION GOVERNMENT EFFECTIVENESS AND EFFICIENCY Ensure Solvency and Accountability of the Teacher Retirement System Retiree Insurance Fund ................................... 67 Increase Fiscal Accountability and Transparency of School Districts’ General Fund Balances ....................................... 69 Trends in the Number and Salaries of Administrators in Texas Public Schools .............................................................. 71 Overview of Funding and Accountability for Bilingual and English As A Second Language Programs in Texas Public Schools ................................................................................................................................................. 72 Overview of Texas Education Agency’s Project Share Online Resources ........................................................................ 74 OTHER REPORTS Overview of Fiscal Impact of Shale Drilling on Texas School Districts ......................................................................... 75 Comprehensive School Performance Reviews ............................................................................................................... 76 TECHNOLOGY GOVERNMENT EFFECTIVENESS AND EFFICIENCY Overview of Server Consolidation Within Data Center Services .................................................................................. 79 TRANSPORTATION GOVERNMENT EFFECTIVENESS AND EFFICIENCY Enhance the Process Used to Remove Nonintegral Roads from the State Highway System........................................... 81 Increase the Fee for a Duplicate Motor Vehicle Title to Recover State Costs ................................................................. 82 Improve the Operations and State Oversight of Overweight Corridors ........................................................................ 83 OTHER REPORTS Options to Increase Revenue Available for Transportation Infrastructure ...................................................................... 85 Options to Fund Energy Sector Transportation Repairs................................................................................................ 86 EXECUTIVE SUMMARY OF LEGISLATIVE BUDGET BOARD REPORTS – JANUARY 2015 – ID: 1880 iii iv EXECUTIVE SUMMARY OF LEGISLATIVE BUDGET BOARD REPORTS – JANUARY 2015 – ID: 1880 IMPROVE DATA COLLECTION AND REFORM STATE TRUANCY LAWS TO ENHANCE THE QUALITY OF TRUANCY INTERVENTIONS LBB RECOMMENDATIONS 1 Amend statute to require TEA to adopt rules to define minimum standards for truancy prevention measures required by the Texas Education Code and establish best practices for these measures. 2 Include a rider to require TEA to report on efforts to improve the completeness, accuracy, and usefulness of truancy data reported by school districts. 3 Include a contingency rider to increase General Revenue Fund appropriations to the Office of Court Administration (OCA) by $150,000 and require OCA to study court processes and data on failure to attend school and parent contributing to nonattendance cases. The appropriation and study would be contingent on failure to attend school remaining a misdemeanor. 4 Increase General Revenue Fund appropriations to Trusteed Programs within the Office of the Governor by an estimated $4.6 million and include a rider to distribute grants to local entities for truancy prevention and intervention services. These recommendations would have an estimated net cost of $4.7 million in General Revenue Funds for the 2016–17 biennium. They would improve the Legislature’s ability to compare the effectiveness of programs and policies intended to reduce truancy across the state. Implementing reforms to certain court procedures would provide additional protections for children and families while maintaining the court’s ability to enforce state truancy laws. Texas school districts have a high degree of discretion to enforce truancy laws. Statute requires districts to develop truancy reduction plans, but it does not prescribe minimum standards for how truancy prevention should be carried out, which results in districts implementing truancy interventions that may be ineffective. Literature on truancy programs indicates that combining school and community resources to address the specific cause of truancy for each student is a best practice. As a condition of receiving Safe and Drug Free Schools and Communities grant funding, Texas was required to track and submit truancy data to the U.S. Department of Education. Texas implemented this mandate by adding fields to the public education information management system (PEIMS) to allow districts to report truancy data to the Texas Education Agency (TEA). However, PEIMS truancy data is often inaccurate or incomplete. Texas processes most attendance violations for students age 12 and older through the adult criminal court system as Class C misdemeanors. Criminal courts do not provide all the same protections for children as civil juvenile courts. Judges have discretion regarding how much to fine defendants, and can impose a variety of court orders on defendants whether they are on deferred disposition or have been convicted. Justice and municipal courts cannot charge a juvenile case manager fee if they do not already employ a juvenile case manager. Start-up costs can be a barrier to establishing a court juvenile case management program. The Eighty-third Legislature, Regular Session, 2013, established a court cost to fund grants for juvenile case manager services and prevention activities. Revenue would have been deposited to a new Truancy Prevention and Diversion Fund (General Revenue–Dedicated Funds); however, this fund was not exempted from funds consolidation. Revenue is therefore deposited to the General Revenue Fund, and no funds were appropriated for these grants. Amend statute to clarify that courts are required to dismiss flawed failure to attend school complaints before they are scheduled for a hearing and without requiring the presence of the defendant. A lack of data collected by courts and school districts hinders policy makers’ ability to measure the effects of various responses to truancy. Studying the variation among courts and increasing the consistency of truancy interventions would improve the Legislature’s ability to compare and evaluate the effectiveness of programs and policies across the state. Implementing reforms to certain court procedures would provide additional protections for children and families while maintaining the court’s ability to enforce state law. (LBB Recommendations tinued on next page) The full text of this report can be found in the Texas State Government Effectiveness and Efficiency Report (Legislative Budget Board, January 2015), page 1. 5 con EXECUTIVE SUMMARY OF LEGISLATIVE BUDGET BOARD REPORTS – JANUARY 2015 – ID: 1892 1 IMPROVE DATA COLLECTION AND REFORM STATE TRUANCY LAWS TO ENHANCE THE QUALITY OF TRUANCY INTERVENTIONS LBB RECOMMENDATIONS (CONTINUED) 6 Amend statute to require judges who preside over juvenile fine only misdemeanor cases to explain the potential consequences of having a criminal record. 7 Amend statute to require courts to offer a deferred disposition option for individuals charged with failure to attend school for the first time, if they have not already gone through a diversion program approved by the court. A report on the targeted review of school truancy conducted in conjunction with this report can be found in Attendance and Truancy: Summary of Nine Targeted School District Reviews (Legislative Budget Board, January 2015). FIGURE 1 FIVE-YEAR FISCAL IMPACT OF RECOMMENDATIONS FISCAL YEARS 2016 TO 2020 YEAR PROBABLE SAVINGS/(COST) IN GENERAL REVENUE FUNDS 2016 ($2,428,330) 2017 ($2,278,330) 2018 ($2,278,330) 2019 ($2,278,330) 2020 ($2,278,330) SOURCE: Legislative Budget Board. The introduced 2016–17 Gen eral Appropriations Bill includes riders and an increase in appro priated amounts implementing Recommendations 2, 3, and 4. Recommendations 1, 5, 6, and 7 require statutory changes. 2 EXECUTIVE SUMMARY OF LEGISLATIVE BUDGET BOARD REPORTS – JANUARY 2015 – ID: 1892 INCREASE TRANSPARENCY OF DISCRETIONARY TRANSFERS FROM THE SCHOOL LAND BOARD’S REAL ESTATE SPECIAL FUND LBB RECOMMENDATIONS 1 Amend statute to require SLB to adopt a rule that establishes a procedure to determine the amount of transfers to the Available School Fund and to the SBOE-controlled portion of the Permanent School Fund. 2 Amend statute to require SLB to notify CPA, SBOE, and the Legislative Budget Board of the amount and timing of transfers to the Available School Fund and to the SBOE-controlled portion of the Permanent School Fund for the next biennium, by September 1 of each even-numbered year. The introduced 2016–17 Gen eral Appropriations Bill does not include any adjustments as a re sult of these recommendations. These recommendations require statutory changes. These recommendations would not have a fiscal impact. They would increase transparency related to the processes used by the School Land Board (SLB) to determine whether to make transfers and the appropriate amount of those transfers, and would enhance the Legislature’s ability to make appropriation decisions for public education funding in a timely manner. The Texas General Land Office’s real estate portfolio for public schools is managed by SLB. The returns from that portfolio are held in the Real Estate Special Fund. SLB can make discretionary transfers from the Real Estate Special Fund to the Available School Fund and to the State Board of Education-controlled portion (SBOE) of the Permanent School Fund. From fiscal years 2003 to 2015, more than $1.8 billion in returns from real estate and mineral rights has been made available for transfer to the Available School Fund from the Permanent School Fund. In 2013, SLB exercised its constitutional authority to transfer $300.0 million directly to the Available School Fund. Transfers to the Available School Fund reduce the amount of unrestricted General Revenue Funds needed to meet the state’s obligation for funding the Foundation School Program. These transfers are entirely discretionary, and SLB does not have any formal policies or procedures for determining whether or not to make transfers or the amount of those transfers. Furthermore, SLB does not have formal policies for notifying the Texas Comptroller of Public Accounts (CPA) of expected transfers to the Available School Fund, which may limit CPA’s ability to count discretionary transfers toward certification of the budget. Establishing formal policies to determine transfer amounts and to provide notification of transfers would increase transparency and information available to the Texas Legislature, while preserving SLB’s discretion to make transfers. The full text of this report can be found in the Texas State Government Effectiveness and Efficiency Report (Legislative Budget Board, January 2015), page 21. EXECUTIVE SUMMARY OF LEGISLATIVE BUDGET BOARD REPORTS – JANUARY 2015 – ID: 1938 3 OVERVIEW OF IMPACTS OF HYDRAULIC FRACTURING IN TEXAS LBB FACTS AND FINDINGS Nearly 50 percent of all liquid (crude oil and condensate) and dry gas production in the state for calendar year 2013 was from horizontal wells located in Texas shale plays. During the past 10 years, oil and gas production from horizontal wells in Texas shale plays increased from less than 1 percent and 2 percent to 47 percent and 45 percent of statewide liquids and natural gas production, respectively. Driven by production of unconventional oil and gas resources, state revenue attributable to the oil and gas industry has increased over the last decade. State revenue related to the oil and gas industry from all sources—severance, sales and franchise taxes, and income from oil and gas production on state-owned lands—exceeded $7.4 billion for fiscal year 2013. Property value growth in shale play regions is affecting state aid formulas for public education. Based on preliminary data, recapture for fiscal year 2014 is expected to total approximately $1.2 billion, with 49 percent coming from school districts located in shale plays. This report would not have a fiscal impact for the 2016–17 biennium. It examines the effects of hydraulic fracturing and horizontal drilling on Texas oil and gas production; state revenues; the state budget, including the effects of property value increases in Texas shale play regions on Texas school finance; other state effects; and the environmental risks associated with hydraulic fracturing. Hydraulic fracturing is a well stimulation process that has been used to extract oil and natural gas in Texas for 60 years. Hydraulic fracturing is required for economical extraction from unconventional oil and gas resources, such as shale formations, that do not naturally have adequate permeability to allow sufficient quantities of oil and gas to flow freely to the well bore (the drilled hole that forms the oil or gas well) and be collected at the surface. The development of unconventional oil and gas resources such as the Eagle Ford shale play helped to reverse a 30-year decline in Texas oil and gas production. Advances in horizontal drilling and hydraulic fracturing technology, which made economic recovery of oil and gas from these resources possible, are credited for the turnaround. The Railroad Commission of Texas estimates that 85 percent to 90 percent of Texas oil and gas wells drilled today are hydraulically fractured. Data and analysis required to make definitive findings or conclusions regarding the environmental effects of hydraulic fracturing, especially with regard to air and water quality and induced seismic events, are not yet available. This report provides information regarding the increasing proportion of state oil and gas production provided by hydraulically fractured horizontal wells; the associated fiscal impacts on state revenue and the state budget, in particular state funding for public education and transportation infrastructure; the location of existing and emerging unconventional oil and gas plays in Texas; other state effects; and a discussion of the environmental risks associated with hydraulic fracturing and the regulatory framework that governs it. The report also provides a description of hydraulic fracturing and horizontal drilling in a shale formation; water use, well completion costs, and drilling depths in selected Texas shale plays; and an overview of the regulatory response to hydraulic fracturing and shale drilling by state and local governments. The full text of this report can be found in Overview of Impacts of Hydraulic Fracturing in Texas, Legislative Primer (Legislative Budget Board, February 2015). The introduced 2016–17 Gen eral Appropriations Bill does not include any adjustments as a result of this report. This report does not include any recommen dations. 4 EXECUTIVE SUMMARY OF LEGISLATIVE BUDGET BOARD REPORTS – JANUARY 2015 – ID: 1956 MODIFY THE TEXAS MEDICAL LIABILITY JOINT UNDERWRITING ASSOCIATION LBB RECOMMENDATIONS 1 Amend statute to reduce risk to medical consumers resulting from JUA by modifying the association using one of the following options: (1) suspend operations of JUA; (2) remove JUA from statute and privatize the entity; or (3) require the Texas Department of Insurance to develop more rigorous underwriting standards. 2 Amend statute to establish a method for distribution of the JUA’s surplus funds to: (1) the state for appropriation by the Texas Legislature; and/or (2) current and prior policy holders through an unclaimed property process. The introduced 2016–17 Gen eral Appropriations Bill does not include any adjustments as a re sult of these recommendations. These recommendations require statutory changes. This report would not have a fiscal impact for the 2016–17 biennium but could result in a one-time revenue gain of up to $300.8 million in General Revenue Funds for fiscal year 2018. Modifying the Texas Medical Liability Joint Underwriting Association (JUA) would reduce risks to consumers from highrisk medical providers covered by the association. The Texas Legislature established JUA in 1975 to assist medical providers experiencing difficulty obtaining affordable medical liability insurance. The act establishing the association described a temporary authorization, and a requirement was later put in statute that the association be suspended by December 1985. Despite this, JUA continues to underwrite policies for a small number of providers. The association may also be extending insurance to high-risk providers who cannot obtain insurance in the current medical liability market, which poses a risk to medical consumers. Twenty-eight of the 60 individual medical providers JUA covers have had disciplinary action taken against them by a professional licensing board. Since the association’s establishment there have been changes in the medical malpractice marketplace and regulation. The Legislature has not recently considered alterations to the association to account for these changes. The association has accumulated a large amount of assets during its operations, valued at approximately $300.8 million at the end of fiscal year 2013 for less than 100 policies. There is no statutory mechanism to refund or distribute surpluses during ongoing operations. Additionally, statute provides insufficient guidance on how to distribute reserves if JUA were suspended. Modifying the association and establishing a method for distribution of JUA’s surplus funds through a combination of the options proposed would reduce risk to medical consumers and provide guidance that would allow the JUA’s assets to be used for other purposes. The full text of this report can be found in the Texas State Government Effectiveness and Efficiency Report (Legislative Budget Board, January 2015), page 27. EXECUTIVE SUMMARY OF LEGISLATIVE BUDGET BOARD REPORTS – JANUARY 2015 – ID: 1920 5 MODIFY THE INSURANCE GUARANTY MODEL TO BETTER ALIGN MARKET INCENTIVES AND PREVENT THE LOSS OF FUTURE STATE REVENUE LBB RECOMMENDATIONS 1 Amend statute to require TPCIGA to issue assessments before insolvencies occur to more broadly distribute the cost of guaranty coverage. 2 Amend statute to eliminate tax credits to insurers for assessments issued by TPCIGA to remove the state’s financial liability for insolvencies in the private insurance industry. 3 Amend statute to require the Texas Department of Insurance and TPCIGA to develop risk-based assessments to improve market-based incentives. The introduced 2016–17 Gen eral Appropriations Bill does not include any adjustments as a re sult of these recommendations. These recommendations require statutory changes. These recommendations would not have any fiscal impact during the 2016–17 biennium but would result in an indeterminate revenue gain to the General Revenue Fund in the future. The recommendations would eliminate the state’s financial liability for private insurance industry insolvencies and increase the stability of insurance markets. The Texas Legislature established the Texas Property and Casualty Insurance Guaranty Association (TPCIGA) to provide reimbursement to individuals and businesses holding policies with insolvent insurers. After an insurer is declared insolvent, the association collects assets from the insolvent insurers to pay outstanding claims. If the assets are insufficient to pay for the claims covered by the association, the association collects assessments from solvent insurers. In Texas, the assessed insurers can subsequently claim the value of the assessment as tax credits. As a result of these tax credits, from 1993 to 2013 the state did not collect $713.9 million in inflation-adjusted revenues. In most states, however, the solvent insurers recover the cost of these assessments through premium increases or surcharges, rather than through tax credits. In the current assessment process, insurers and policyholders do not fund TPCIGA based on the risk they pose to the association. Instead, the state provides tax credits to insurers when they are required to pay assessments to offset the association’s shortfalls. Studies have shown this practice results in insurers and consumers that are more likely to engage in high-risk behaviors that destabilize insurance markets. The issuance of assessments after insolvencies occur also prevents the state from recovering the costs of deficits at TPCIGA from insolvent insurers. It may also jeopardize solvent insurers when assessments are collected during periods of market instability. Eliminating the state’s financial liability and collecting risk-based premiums before insolvencies occur would increase the stability of insurance markets and prevent the state from foregoing future revenue as a result of tax credits. The full text of this report can be found in the Texas State Government Effectiveness and Efficiency Report (Legislative Budget Board, January 2015), page 34. 6 EXECUTIVE SUMMARY OF LEGISLATIVE BUDGET BOARD REPORTS – JANUARY 2015 – ID: 1917 STRENGTHEN ENFORCEMENT OF THE AMUSEMENT RIDE PROGRAM TO IMPROVE COMPLIANCE LBB RECOMMENDATIONS 1 Increase appropriations to TDI by an estimated $386,000 in General Revenue–Dedicated Funds and include a rider directing the agency to expend the amount of appropriated funds necessary to administer and enforce the Amusement Ride Program and to report biennially to the Legislature on: (1) efforts to bring all amusement ride operators into compliance; and (2) the result of those efforts. 2 Amend statute to require TDI to set the filing fee for the Amusement Ride Program at the amount necessary to generate revenue to cover the cost of administering the program, not to exceed the current statutory limit of $40 per year. 3 Include a rider directing TDI to: (1) request a monthly report from CPA regarding amusement ride owners or operators that apply for a sales tax permit and those that pay sales tax; and (2) use this information to ensure that all operators have filed evidence of inspection and insurance. The introduced 2016–17 Gen eral Appropriations Bill does not include any adjustments as a re sult of these recommendations. Recommendation 1 requires an appropriation. Recommenda tions 1 and 3 require a rider, and Recommendation 2 requires a statutory change. These recommendations would not have a net fiscal impact for the 2016–17 biennium. Ensuring that the Texas Department of Insurance (TDI) has adequate resources and additional tools to identify noncompliant operators would strengthen the Amusement Ride Program and help ensure that amusement ride operators meet current statutory requirements. The Amusement Ride Program at TDI regulates amusement ride operations in the state. Amusement rides include inflatable rides such as bounce houses, mobile carnival rides, and fixed-location rides such as roller coasters. TDI is responsible for ensuring that amusement ride operators comply with statutory requirements for inspection, insurance, and registration and issues compliance stickers for each ride that meets all requirements. In fiscal year 2014, the agency issued 8,705 compliance stickers. The number of ride operators that register with TDI has increased nearly 500 percent from fiscal years 2005 to 2014. In large part, this is due to the addition of bounce houses to the list of amusement rides covered by the Amusement Ride Safety Inspection and Insurance Act in 2011. TDI refers violations of inspection, insurance, and registration requirements to the Office of the Attorney General and local enforcement officials. Since 2011, TDI has referred more than 330 noncompliant amusement ride operators. However, the agency lacks a mechanism to consistently identify noncompliance. The agency may request proof of inspection and insurance from ride operators, but it does not have any other oversight authority over amusement ride operators. Of the approximately $335,000 in revenue generated from registration fees by the Amusement Ride Program for fiscal year 2013, TDI was appropriated about onethird to administer the program. Revenue that exceeds the appropriated amount remains in the Insurance Operating Account (General Revenue–Dedicated Funds). The recommendations would appropriate all revenue collected from the Amusement Ride Program to TDI and direct the agency to request data from the Texas Comptroller of Public Accounts (CPA) to identify noncompliant amusement ride operators and ensure all operators have filed evidence of compliance with inspection and insurance requirements. FIGURE 1 FIVE-YEAR FISCAL IMPACT OF RECOMMENDATION 1 FISCAL YEARS 2016 TO 2020 YEAR PROBABLE SAVINGS/(COST) IN GENERAL REVENUE–DEDICATED FUNDS 2016 ($193,000) 2017 ($193,000) 2018 ($193,000) 2019 ($193,000) 2020 ($193,000) SOURCE: Legislative Budget Board. The full text of this report can be found in the Texas State Government Effectiveness and Efficiency Report (Legislative Budget Board, January 2015), page 41. EXECUTIVE SUMMARY OF LEGISLATIVE BUDGET BOARD REPORTS – JANUARY 2015 – ID: 1903 7 DEFINE AND ESTABLISH PENALTIES FOR WORKER MISCLASSIFICATION LBB RECOMMENDATIONS 1 Amend statute to clarify the definitions of employee and independent contractor by including a rebuttable presumption of employee status. 2 Amend statute to give TWC the authority to assess penalties for misclassification in the private market. The introduced 2016–17 Gen eral Appropriations Bill does not include any adjustments as a re sult of these recommendations. These recommendations require statutory changes. These recommendations would not have a fiscal impact for the 2016–17 biennium. They would provide a clearer definition of independent contractor and would authorize the Texas Workforce Commission (TWC) to assess penalties for misclassification of employees, thereby protecting good-faith business owners and workers. Employee misclassification happens when an employer intentionally classifies an employee as an independent contractor to evade state and federal taxes or because the employer does not understand the legal distinction between an employee and an independent contractor. The practice results in lost revenue to the state’s unemployment insurance fund, undercuts the competitiveness of other employers, and results in the denial of unemployment insurance benefits to laid-off workers who would otherwise be eligible. Misclassified workers ultimately owe both the employee and employer halves of the payroll tax that funds Medicare and Social Security. The unemployment insurance program is funded with state and federal payroll taxes and provides short-term, limited income replacement for people who are unemployed through no fault of their own. The state’s unemployment insurance system is financed by an employer payroll tax on the first $9,000 of an employee’s annual wages. Tax rates vary for employers based on the unemployment insurance benefits that have been paid to former employees. Federal statutes establish general provisions for unemployment insurance program coverage, benefits, and administration; however, each state designs its own program within the framework of the federal requirements. TWC administers Texas’ unemployment insurance program. Employer audits are TWC’s main way of identifying misclassified workers and recovering unemployment insurance contributions. From fiscal years 2010 to 2012, TWC audited 25,277 employers across 20 industries. These audits identified 34,846 misclassified workers and more than $2.4 million in additional payroll taxes due to the unemployment insurance fund. House Bill 2015, Eighty-third Legislature, Regular Session, 2013, established a penalty for worker misclassification that applies to contractors and subcontractors providing services to government entities. The bill, which took effect on January 1, 2014, requires that these employers properly classify their employees and independent contractors. Failing to do so is punishable by a $200 penalty per misclassified employee. The bill did not establish penalties for misclassification in the private markets. Current statutory provisions and penalties address the underreporting of employee wages in the private market, but not misclassification. While employers in the private market are charged interest on past due unemployment insurance contributions, there is no penalty for misclassification. Amending statute to more 8 EXECUTIVE SUMMARY OF LEGISLATIVE BUDGET BOARD REPORTS – JANUARY 2015 – ID: 1902 DEFINE AND ESTABLISH PENALTIES FOR WORKER MISCLASSIFICATION clearly define an independent contractor and to establish a penalty for misclassification in the private market would help protect both good-faith business owners and workers. The full text of this report can be found in the Texas State Government Effectiveness and Efficiency Report (Legislative Budget Board, January 2015), page 46. EXECUTIVE SUMMARY OF LEGISLATIVE BUDGET BOARD REPORTS – JANUARY 2015 – ID: 1902 9 IMPROVE ACCOUNTABILITY OF LOCAL WORKFORCE BOARD AND JOB TRAINING PROGRAMS LBB RECOMMENDATIONS 1 Amend statute to require TWC to report each local workforce board’s annual perfor mance measure results compared to established targets and mate rial findings from current financial monitoring reviews. The report should be featured prominently on the agency’s website in a format that includes explanations, where necessary, and is readily under standable by the public. 2 Amend statute to require that each local workforce board’s website provides a prominent link to TWC’s performance and funds management report web page. 3 Amend statute to require all local workforce boards, and job training providers in the statewide list of certified training providers database, to provide TWC with sufficient data to determine each training program’s completion rates, employment rates, and average starting wages. These recommendations would not have a significant fiscal impact for the 2016–17 biennium, but would provide job seekers, stakeholders, and policy makers with better information about the effectiveness of local workforce boards and job training providers. Texas’ local workforce development boards promote and oversee employment and human resource services for job seekers and employers. To ensure the quality of these services, the Texas Workforce Commission (TWC) holds local boards accountable by monitoring their program and fiscal functions. Although the agency has developed comprehensive monitoring systems, its online local board ratings offer insufficient information to allow policy makers and the public to assess the performance of local boards. To maximize the utility of the agency’s local board ratings, information should be added showing whether local boards are successful in providing effective workforce services such as employment placement and training. Job training programs give job seekers the skills needed to obtain employment. Federal law requires state and local workforce agencies to maximize consumer choice in selecting the appropriate job training program. The same law supports this consumer-oriented approach by requiring state workforce agencies to maintain an online database showing local board- and state agency-approved training programs. TWC’s job training program database, however, does not contain training outcomes data for 77.4 percent of all training programs. As a result, job seekers cannot make an informed decision about which training programs will most effectively meet their needs. To maximize the utility of the job training program database, job training providers should be required to assist TWC in showing performance data in the database to enable adequate consumer choice. The full text of this report can be found in the Texas State Government Effectiveness and Efficiency Report (Legislative Budget Board, January 2015), page 53. 4 Amend statute to require TWC to add program performance data to the statewide list of certified training providers to improve consumer information for choosing a job training provider. The introduced 2016–17 Gen eral Appropriations Bill does not include any adjustments as a re sult of these recommendations. These recommendations require statutory changes. 10 EXECUTIVE SUMMARY OF LEGISLATIVE BUDGET BOARD REPORTS – JANUARY 2015 – ID: 1901 MODIFY EQUITY APPEALS FOR PROPERTY APPRAISALS TO ENSURE UNIFORMITY LBB RECOMMENDATIONS 1 Amend statute to use deviation from the median appraisal ratio instead of median appraised value as the basis to determine equal and uniform appraisal. 2 Amend statute to establish standards for what defines comparable property, limit comparable properties to those in the same appraisal district, require adjustments to be based on general appraisal standards, and establish which appraised value is used at each stage of protest and appeal. 3 Amend statute to require the Texas Comptroller of Public Accounts to establish standards for development and calibration of adjustments for industrial, petrochemical refining and processing, utility properties, and other unique properties by rule. 4 Amend statute to require a property owner who loses an equity lawsuit to pay an appraisal district’s attorney fees to make this requirement consistent for both property owners and appraisal districts. The introduced 2016–17 Gen eral Appropriations Bill does not include any adjustments as a re sult of these recommendations. These recommendations require statutory changes. The fiscal impact for these recommendations cannot be determined, although they would likely result in a reduction of the state’s Foundation School Program obligation. The recommendations would ensure that appeals of equal and uniform appraisals are considered consistently across the state. Property owners in Texas have the right to protest property appraisals if they believe their property has been appraised above market value, or if they believe they have been affected negatively by appraisals that are not equal and uniform. For equity appeals, the Texas Tax Code provides three bases for relief. Two of these relief provisions require equity to be determined using market value and standards consistent with generally accepted appraisal standards. However, one provision specifies that a property owner is entitled to relief if the appraised property value exceeds the median appraisals of a reasonable number of comparable properties with appropriate adjustments. Neither statute nor professional standards define what constitutes a reasonable number of properties, what makes properties comparable, or what constitutes appropriate adjustments. Some properties are particularly difficult for districts to appraise because there are few comparable properties, or information about the income generated by the properties is difficult to obtain. These are typically highly valuable parcels of land, such as refineries and other industrial properties. Lack of agreement on the proper appraisal methods for these unique properties can result in litigation that is expensive for property owners and taxpayers. An appraisal district that loses a lawsuit or administrative hearing is required to pay a property owner’s attorney fees. A property owner is not subject to the same requirement, thus establishing an unequal obligation. This disparity may provide some property owners with an incentive to sue. Appraisal districts typically settle cases, rather than defend appraisals in court, to avoid the risk of being ordered to pay attorney’s fees. Modifying the relief provision for equity appeals and providing more consistent guidance for property owners and appraisal districts to determine property values for unique properties would help ensure appeals of equal and uniform appraisals are considered consistently across the state. The full text of this report can be found in the Texas State Government Effectiveness and Efficiency Report (Legislative Budget Board, January 2015), page 61. EXECUTIVE SUMMARY OF LEGISLATIVE BUDGET BOARD REPORTS – JANUARY 2015 – ID: 1904 11 MODIFY AGRICULTURAL LAND APPRAISAL PROTOCOLS LBB RECOMMENDATIONS 1 Amend statute to require the CPA to establish minimum acreage requirements by land classification and region to qualify as open space by rule. 2 Amend statute to require the CPA to update the Texas Property Tax Manual for the Appraisal of Agricultural Land by December 31, 2016, and at least once every 10 years thereafter, and remove certain approval requirements. The introduced 2016–17 Gen eral Appropriations Bill does not include any adjustments as a re sult of these recommendations. These recommendations require statutory changes. These recommendations would not have a fiscal impact for the 2016–17 biennium, and the fiscal impact thereafter cannot be determined. The recommendations would update state policy to accurately reflect agricultural policy and the economic environment in which agriculture producers operate. The Texas Constitution permits a reduction in property value for agricultural and open space land uses. These provisions were added to ensure that farmers could afford to retain land for agricultural use as the state became more urbanized in the 1960s and 1970s, and land value increased. The Texas Tax Code requires that the land eligible for the alternative valuation be devoted principally to agricultural use at the intensity that is generally accepted in the area. This measure is based on an acreage that is necessary for economically viable production. Qualifying properties receive a special appraisal method that results in a productivity valuation. According to the Texas Comptroller of Public Accounts (CPA), these special appraisals reduced school district property tax collections for fiscal year 2013 by $2.8 billion. There are no statewide minimum acreage or intensity standards for any agricultural uses other than beekeeping. The Texas Tax Code gives appraisal districts the authority to set local acreage and intensity standards. Because there are no statewide minimum acreage requirements, appraisal districts that include smaller tracts have difficulty defending a disapproval of an open space application. The CPA adopted the Texas Property Tax Manual for the Appraisal of Agricultural Land, which contains the guidelines for implementing the special appraisal methods. The manual has not been revised since 1990 and does not reflect current state and federal laws, market conditions, and federal government programs. This outdated information results in a lack of guidance and conflicting requirements for appraisal districts as they attempt to implement the special appraisal method. The Texas Property Tax Manual for the Appraisal of Agricultural Land was published by the State Property Tax Board. The State Property Tax Board was dissolved and its functions were moved to the CPA. A 2014 appellate court ruling found that because the State Property Tax Board no longer exists, the manual is no longer in existence and cannot be used by an appraisal district as the basis for denying a property owner’s application for open space appraisal. Modifying the agricultural special appraisal protocols for open space land would update state policy to accurately reflect agricultural policy and the economic environment in which agricultural producers operate. The full text of this report can be found in the Texas State Government Effectiveness and Efficiency Report (Legislative Budget Board, January 2015), page 70. 12 EXECUTIVE SUMMARY OF LEGISLATIVE BUDGET BOARD REPORTS – JANUARY 2015 – ID: 1905 INCREASE FUNDING TO IMPROVE LONG-TERM DISASTER RECOVERY LBB RECOMMENDATIONS 1 Appropriate $1.9 million in General Revenue Funds directly to the Texas Department of Public Safety to continue a Regional Recovery Coordination Program. 2 Amend statute to establish a new General Revenue– Dedicated account for disaster recovery. 3 Adopt one of these options to fund a new General Revenue– Dedicated account for disaster recovery and appropriate funds to the Texas Department of Public Safety, the account’s proposed administering agency, through one of the following options: º Option 1: Amend statute to allow funds from the Volunteer Fire Department Assistance Fund to be used for disasters and transfer $30.0 million to a new General Revenue–Dedi cated account for disaster recovery. Include a contin gency rider to appropriate $30.0 million from the new General Revenue–Dedi cated account for disaster recovery. (LBB Recommendations tinued on next page) con These recommendations have different fiscal impacts for providing disaster assistance. The recommendation to continue a Regional Recovery Coordination program would cost $1.9 million in General Revenue Funds for the 2016–17 biennium. The recommendation to fund a disaster recovery fund would cost $30.0 million in General Revenue Funds or General Revenue–Dedicated Funds for the 2016–17 biennium, depending on the method of finance adopted for providing disaster relief. In the past decade, Texas has responded to many large-scale disasters. From 2005 to 2008, hurricanes Katrina, Rita, Dolly, and Ike caused great damage to the Gulf Coast. More recently, extreme drought, wildfires, and an explosion at a West fertilizer plant gained national attention. These events negatively affected the state’s economy and increased the need for state services and federal aid. Local entities requested state and federal aid to recover from various disasters. Given Texas’ geography, weather patterns, and population growth, the state should plan for future disaster recovery. Texas has disaster funding mechanisms, but they could be more effective and efficient. The state model relies heavily on supplemental appropriations and federal reimbursement—in effect, reimbursing costs months or years after the disaster. Sources of immediate recovery funds are limited. Local entities face additional challenges. For example, many do not receive federal aid when a disaster does not meet a federally required loss threshold. A new, revolving state disaster recovery fund could provide small-scale disaster aid such as grants or loans to local entities. It would establish a formal application process that takes into account applicants’ finances and disaster preparedness. It also could provide state agencies with greater flexibility to manage disaster costs. FIGURE 1 FIVE-YEAR FISCAL IMPACT OF RECOMMENDATION 1 FISCAL YEARS 2016 TO 2020 YEAR PROBABLE SAVINGS/(COST) IN GENERAL REVENUE FUNDS PROBABLE ADDITION/(REDUCTION) IN FULL-TIME-EQUIVALENT POSITIONS 2016 ($952,500) 9 2017 ($952,500) 9 2018 $0 0 2019 $0 0 2020 $0 0 NOTES: (1) Impact assumes the Office of the Governor will not fund the program for the 2016–17 biennium. (2) Impact does not include any Federal Funds dedicated to the administration of federal disaster grants. SOURCES: Legislative Budget Board; Texas Department of Public Safety. EXECUTIVE SUMMARY OF LEGISLATIVE BUDGET BOARD REPORTS – JANUARY 2015 – ID: 1907 13 INCREASE FUNDING TO IMPROVE LONG-TERM DISASTER RECOVERY LBB RECOMMENDATIONS (CONTINUED) º Option 2: Of the $70.6 million recommended reduction to 2016–17 appropriations to Trusteed Programs within the Office of the Governor, Strategy A.1.1., Disaster Funds, appropriate $30.0 million to the new General Revenue– Dedicated account for disaster recovery. Include a contingency rider to appropriate $30.0 million from the new General Revenue–Dedicated account for disaster recovery. FIGURE 2 FIVE-YEAR FISCAL IMPACT OF RECOMMENDATION 3, OPTION 1 FISCAL YEARS 2016 TO 2020 YEAR PROBABLE REVENUE GAIN/(LOSS) TO GENERAL REVENUE– DEDICATED ACCOUNT 5064 PROBABLE REVENUE GAIN/(LOSS) TO PROPOSED GENERAL REVENUE–DEDICATED DISASTER RECOVERY FUND PROBABLE SAVINGS/ (COST) TO PROPOSED GENERAL REVENUE– DEDICATED DISASTER RECOVERY FUND 2016 ($15,000,000) $15,000,000 ($15,000,000) 2017 ($15,000,000) $15,000,000 ($15,000,000) 2018 $0 $0 $0 2019 $0 $0 $0 2020 $0 $0 $0 SOURCE: Legislative Budget Board. FIGURE 3 FIVE-YEAR FISCAL IMPACT OF RECOMMENDATION 3, OPTION 2 FISCAL YEARS 2016 TO 2020 YEAR PROBABLE SAVINGS/ (COST) IN GENERAL REVENUE FUNDS PROBABLE REVENUE GAIN/(LOSS) TO PROPOSED GENERAL REVENUE–DEDICATED DISASTER RECOVERY FUND PROBABLE SAVINGS/ (COST) TO PROPOSED GENERAL REVENUE– DEDICATED DISASTER RECOVERY FUND 2016 ($15,000,000) $15,000,000 ($15,000,000) 2017 ($15,000,000) $15,000,000 ($15,000,000) 2018 $0 $0 $0 2019 $0 $0 $0 2020 $0 $0 $0 4 Include a contingency rider that requires the Texas Department of Public Safety to submit any expenditure of at least $1.0 million from a new General Revenue–Dedicated account for disaster recovery to the Legislative Budget Board and the Office of the Governor for approval. SOURCE: Legislative Budget Board. The introduced 2016–17 Gen eral Appropriations Bill includes an appropriation to implement Recommendation 1. Recommen dations 2 and 3 require statutory changes, and Recommendations 3 and 4 require a contingency rider. 14 The full text of this report can be found in the Texas State Government Effectiveness and Efficiency Report (Legislative Budget Board, January 2015), page 77. EXECUTIVE SUMMARY OF LEGISLATIVE BUDGET BOARD REPORTS – JANUARY 2015 – ID: 1907 IMPROVE OVERSIGHT OF FUNDS RELATED TO THE DEEPWATER HORIZON OIL SPILL LBB RECOMMENDATIONS 1 Include a rider that requires agencies that receive, expend, or conduct projects using Deepwater Horizon oil spill-related funds to submit quarterly reports to the Legislative Budget Board. These reports will identify amounts, funding sources, and projects. 2 Include a rider that requires any agency that intends to expend at least $1.0 million for a project or program using Deepwater Horizon oil spill-related funds deposited to the state Treasury to submit an expenditure request to the Legislative Budget Board and the Office of the Governor for approval. 3 Within each chamber’s finance or appropriations committee, the Legislature should consider establishing a standing subcommittee to provide over sight for exceptional fiscal or policy matters such as the influx of oil spill-related funds. The subcommittees could meet with relevant policy committees as necessary to receive testimony and updates from agencies. These recommendations would not have a fiscal impact for the 2016–17 biennium. They would improve oversight of funds related to the Deepwater Horizon oil spill and provide greater transparency regarding the use of these funds. In April 2010, after an explosion, the Deepwater Horizon oil rig sank in the Gulf of Mexico. The rig was located in the Macondo prospect, southeast of the Louisiana coast. By the time it was capped nearly three months later, the rig released nearly five million barrels of oil. There were many responsible parties, according to the Congressional Research Service. Some of the parties include BP, an energy company that had leased and operated the rig; MOEX Offshore 2007 LLC, a partial investor in the well; and Transocean, an offshore drilling company that owned the rig. Due to the oil spill, the state of Texas will receive funds from various sources. Five main sources will provide funds for ecological or economic projects. Although they stem from the same event, each source is different. They differ by amounts, funding mechanisms, and rules. Figure 1 shows the following funding sources: • MOEX Offshore 2007 LLC settlement; • Natural Resource Damage Assessment (NRDA); • National Fish and Wildlife Foundation (NFWF); • Resources and Ecosystems Sustainability, Tourist Opportunities, and Revived Economies of the Gulf Coast States Act (RESTORE Act); and • an agreement between the state of Texas and BP. Oil spill-related funds represent a new, significant source of revenue. Given the influx of funds to Texas and unresolved legal and procedural issues, greater legislative oversight is needed to ensure a high degree of accountability and transparency from agencies that administer these funds. The full text of this report can be found in the Texas State Government Effectiveness and Efficiency Report (Legislative Budget Board, January 2015), page 85. The introduced 2016–17 Gener al Appropriations Bill includes a rider implementing Recommen dations 1 and 2. Recommenda tion 3 could be implemented by each legislative chamber’s finance or appropriations committee. EXECUTIVE SUMMARY OF LEGISLATIVE BUDGET BOARD REPORTS – JANUARY 2015 – ID: 1906 15 IMPROVE OVERSIGHT OF FUNDS RELATED TO THE DEEPWATER HORIZON OIL SPILL FIGURE 1 DEEPWATER HORIZON OIL SPILL-RELATED FUNDS, SEPTEMBER 2010 TO JULY 2014 SOURCE TYPE AMOUNT AVAILABLE TO TEXAS MOEX Offshore 2007 LLC Settlement $6.5 million • Supplemental Environmental Projects: Land acquisition and habitat protection. • Civil Penalties Direct Payment: General Revenue Fund; Coastal Protection Fund (General Revenue– Dedicated Fund); and attorney fees. Natural Resource Damage Assessment: Early Restoration Framework agreement Up to $100.0 million • Restore, rehabilitate, or replace injured natural resources. • Address an injury due to the spill. National Fish and Wildlife Foundation: Gulf Environmental Benefit Fund Criminal plea agreements $203.5 million • Remedy harm and eliminate or reduce risk of future harm to natural resources. • Remedy resources that were injured, destroyed, lost, or lost use due to the spill. Resources and Ecosystems Sustainability, Tourist Opportunities, and Revived Economies of the Gulf Coast States Act (RESTORE Act) Federal Funds To be determined • Direct Component: Restoring and protecting natural resources; mitigating damage; implementing a marine, coastal, or conservation management plan; workforce development/job creation; state park improvements; infrastructure; flood protection; tourism and seafood promotion; and planning/ administration. • Spill Impact Component: Similar to Direct Component. Projects must contribute to Gulf economic and ecological recovery. • Comprehensive Plan Component: Projects must meet Comprehensive Plan objectives. • Centers of Excellence: Science and research related to coastal issues at select institutions. BP-State of Texas Agreement Agreement $5.0 million Costs related to the spill. ALLOWABLE USES NOTES: (1) Due to pending regulations and litigation, RESTORE Act funding cannot be determined. (2) Not all funds available to Texas will be deposited to the state Treasury. SOURCES: Legislative Budget Board; U.S. Department of Justice; Gulf Coast Ecosystem Restoration Council; National Fish and Wildlife Foundation; Resources and Ecosystems Sustainability, Tourist Opportunities, and Revived Economies of the Gulf Coast States Act; Office of the Governor. 16 EXECUTIVE SUMMARY OF LEGISLATIVE BUDGET BOARD REPORTS – JANUARY 2015 – ID: 1906 OVERVIEW OF THE ECONOMIC STABILIZATION FUND LBB FACTS AND FINDINGS The balance of the ESF on December 15, 2014, was $8.5 billion, equivalent to 17.5 percent of the fiscal year 2015 General Revenue Funds budget. Transfers from the General Revenue Fund to the ESF linked to oil production tax and natural gas tax collections have contributed 86.8 percent of all revenue deposited to the fund. The transfer to the ESF based on the unencumbered General Revenue Fund balance at the end of each biennium has not been a reliable source of revenue. The ESF cap for the 2014–15 biennium is $14.1 billion, equivalent to 29.1 percent of the fiscal year 2015 General Revenue Funds budget. Appropriations from state stabilization funds during economic downturns do not necessarily affect state bond ratings. During the last recession, states that had the highest bond ratings and appropriated significant portions of their stabilization funds did not receive lower bond ratings. This report would not have a fiscal impact for the 2016–17 biennium. It provides an overview of the structure of the Texas Economic Stabilization Fund (ESF), revenue sources deposited to the fund, and appropriations made from the fund since its establishment. The ESF, commonly referred to as the Rainy Day Fund, was established by the passage of a constitutional amendment in 1988. Since its establishment, deposits to the fund have totaled $19.1 billion. Figure 1 shows the seven ways revenue can be deposited to the fund. The Texas Legislature has passed seven bills appropriating $10.7 billion from the fund. Figure 2 shows the provisions governing appropriations from the fund. The ESF currently has one of the highest balances among state stabilization funds both in absolute terms and as a percent of the state budget. The accumulation of significant balances is a recent development. Before fiscal year 2008, the balance had never reached 5 percent of the annual General Revenue Funds budget. The recent increase in the balance is linked to historically high oil production tax and natural gas tax receipts generated by enhanced oil and natural gas recovery methods. A constitutional amendment adopted in November 2014 redirects to the State Highway Fund as much as half of the oil and natural gas tax-related transfers that previously would have been transferred to the ESF. The allocation of oil and natural gas-related transfers for fiscal year 2015 was divided equally between the ESF and the State Highway Fund, with each fund receiving $1.7 billion. The future health of the ESF remains heavily dependent on oil and natural gas tax collections. More detailed information is available on this subject at the Interactive Graphics link of the Legislative Budget Board’s website http://www.lbb.state.tx.us/Interactive. aspx. The full text of this report can be found in the Texas State Government Effectiveness and Efficiency Report (Legislative Budget Board, January 2015), page 93. The introduced 2016–17 Gen eral Appropriations Bill does not include any adjustments as a result of this report. This report does not include any recommen dations. EXECUTIVE SUMMARY OF LEGISLATIVE BUDGET BOARD REPORTS – JANUARY 2015 – ID: 1925 17 OVERVIEW OF THE ECONOMIC STABILIZATION FUND FIGURE 1 HOW REVENUE IS DEPOSITED TO THE ECONOMIC STABILIZATION FUND, FISCAL YEARS 2014 TO 2025 PROVISION OF THE TEXAS CONSTITUTION, ARTICLE III, SECTION 49-G SUBSECTION CIRCUMSTANCE AMOUNT 1 Oil Tax-Related (d) When oil tax collections in a fiscal year exceed fiscal year 1987 collections General Revenue Fund transfer equal to at least 37.5 percent of the amount above fiscal year 1987 collections 90th day of the next fiscal year 2 Natural Gas Tax-Related (e) When natural gas tax collections in a fiscal year exceed fiscal year 1987 collections General Revenue Fund transfer equal to at least 37.5 percent of the amount above fiscal year 1987 collections 90th day of the next fiscal year 3 Unencumbered Balance (b) When there is a General Revenue Fund unencumbered balance at the end of a biennium One-half of any General Revenue Fund unencumbered balance 90th day of the biennium 4 Appropriations to the Fund (f) When the Texas Legislature makes an appropriation to the fund Amount appropriated Effective date of appropriation or as directed by the appropriation 5 Interest on Deposits (i and j) When there is a cash balance in the fund and ESF balance is less than the cap Interest earned on average daily balance (calculated as if no interfund borrowing from ESF has occurred) Monthly 6 Repayment of Interfund Borrowing (j) After revenue is borrowed from the ESF to prevent or eliminate a temporary cash deficiency in the General Revenue Fund Amount borrowed Not later than August 31 of each odd-numbered year 7 Recoupment of Excess Appropriation (l) When the actual biennium-to-biennium decrease in revenue is less than appropriations made pursuant to subsection (l) Amount by which appropriations pursuant to subsection (l) exceed the actual biennium-tobiennium decrease in revenue After the end of the fiscal year WHEN/NOT LATER THAN NOTES: (1) ESF = Economic Stabilization Fund. (2) The allocation pursuant to subsections (d) and (e) can be increased to as high as 75 percent through legislative actions, pursuant to the Texas Government Code, Section 316.092. By statute, the allocation to the ESF increases to 75 percent after fiscal year 2025. SOURCE: Legislative Budget Board. FIGURE 2 CONSTITUTIONAL PROVISIONS GOVERNING APPROPRIATIONS FROM THE ECONOMIC STABILIZATION FUND AS OF FISCAL YEAR 2015 SUBSECTION CIRCUMSTANCE RESTRICTION VOTE (k) Deficit in current biennium • Not greater than deficit • Regular Session: only for a purpose funded by previous Legislature • Special Session: for a purpose funded by earlier session of same Legislature • Only for the current biennium 3/5 of members present (l) CPA estimates that revenue decreases from current biennium to the next biennium Not greater than revenue decrease/recoupment of over-appropriation 3/5 of members present (m) Any time, any purpose None 2/3 of members present NOTE: CPA = Texas Comptroller of Public Accounts. SOURCE: Legislative Budget Board. 18 EXECUTIVE SUMMARY OF LEGISLATIVE BUDGET BOARD REPORTS – JANUARY 2015 – ID: 1925 THE AFFORDABLE CARE ACT’S EFFECTS ON TEXAS EMPLOYERS LBB FACTS AND FINDINGS The ACA affects employers through reforms to the health insurance market, tax provisions, the expansion of health insurance coverage, and reporting requirements. According to the U.S. Agency for Healthcare Research and Quality, there were more than 490,000 private-sector employers in Texas in 2012. In September 2014, the state employee benefit systems (Employees Retirement System, Teacher Retirement System, the University of Texas System and the Texas A&M System) identified the costs of the following tax and fee provisions to be $75.2 million in All Funds for fiscal year 2016: Patient-Centered Outcomes Research Fee, the Transitional Reinsurance Program, and the Annual Fee on Health Insurance Providers. Starting in January 2015, the ACA requires employers with 100 or more fulltime equivalents to provide affordable health coverage to their full-time employees, or pay a penalty. This requirement will include employers with more than 50 full-time-equivalent positions, starting in 2016. According to a 2012 survey conducted by the U.S. Agency for Healthcare Research and Quality, 28.9 percent of privatesector businesses in Texas had 50 or more employees. This report would not have a fiscal impact for the 2016–17 biennium. It provides information on the Affordable Care Act’s effects on Texas employers, including the state. The Affordable Care Act (ACA) of 2010 affects employers through reforms to the health insurance market, tax provisions, the expansion of health insurance coverage, and reporting requirements. While some of the provisions in the law took effect immediately upon its enactment, several provisions did not take effect until January 1, 2014. Some provisions have implementation dates as late as 2018, such as the excise tax on high-cost health plans. Subsequent legislation and federal rules have changed and delayed provisions of the law. These factors have limited the immediate availability of data and information on the ACA’s effects on employers. This report identifies and discusses key Affordable Care Act provisions that affect employers. The report also includes cost estimates related to the effects of some provisions on the state of Texas as an employer. The full text of this report can be found in the Texas State Government Effectiveness and Efficiency Report (Legislative Budget Board, January 2015), page 114. The introduced 2016–17 Gen eral Appropriations Bill does not include any adjustments as a result of this report. This report does not include any recommen dations. EXECUTIVE SUMMARY OF LEGISLATIVE BUDGET BOARD REPORTS – JANUARY 2015 – ID: 1908 19 FURTHER REDUCE RELIANCE ON GENERAL REVENUE–DEDICATED ACCOUNTS FOR CERTIFICATION OF THE STATE BUDGET LBB RECOMMENDATIONS 1 Amend statute to require CPA to publish a report regarding the General Revenue–Dedicated accounts that are counted for certification of General Revenue Fund appropriations after the end of each regular session of the Texas Legislature. This amendment would codify current practice to ensure continued availability of this information. 2 Implement additional ac count-specific measures to reduce reliance on General Rev enue–Dedicated accounts for certifying appropriated General Revenue Funds by adjusting rev enue, increasing appropriations, or modifying uses of dedicated rev enue. Detailed recommendations by account are included in Appen dix A of the report. The introduced 2016–17 Gen eral Appropriations Bill includes adjustments for account-specific measures proposed in Recom mendation 2. Recommendation 1 requires a statutory change. Additional account-specific mea sures proposed in Recommen dation 2 could be implemented through statutory changes or changes to the General Appro priations Bill. 20 These recommendations would reduce the balance counted toward certification of the state budget by approximately $1.5 billion for the 2016–17 biennium. These recommendations provide the Legislature with measures to further reduce reliance on General Revenue–Dedicated account balances for certification of the General Appropriations Bill. General Revenue–Dedicated accounts are subaccounts within the General Revenue Fund that are for the deposit and accounting of revenues dedicated for a particular purpose. Since 1991, unappropriated General Revenue–Dedicated account balances have been counted as available to certify General Revenue Funds appropriations. Certification of appropriations is required by the Texas Constitution, Article III, Section 49a, commonly referred to as the “pay as you go limit.” The practice of counting unappropriated General Revenue–Dedicated balances as available for certification allows the Legislature to appropriate smaller amounts from these dedicated accounts for their statutory purpose, leaving fund balances to facilitate compliance with the pay as you go limit and to help fund budget priorities. In 1991, the Texas Comptroller of Public Accounts (CPA) counted $540.0 million in General Revenue–Dedicated account balances as available to certify appropriations from General Revenue Funds. Reliance on General Revenue–Dedicated accounts for certification increased as accounts were added and revenue collections in many accounts exceeded appropriations. By 2011, the amount of General Revenue– Dedicated revenue available to certify appropriations of General Revenue Funds reached $4.9 billion. Of accounts that are counted toward certification, not all are affected by this practice. This includes: • university current accounts; • self-leveling accounts; • accounts designated as federal; • accounts that require a balance for cash flow needs; and • accounts that fund long-term obligations. These accounts should be considered a lower priority for modifying current practices or statute. The Eighty-third Legislature, 2013, reduced the amount of General Revenue– Dedicated account balances that counted for certification to $4.2 billion. The Eighty-third Legislature also required the Legislative Budget Board to monitor and evaluate counting of dedicated revenue for certification and to develop recommendations to further reduce reliance on these accounts for certification. Account-specific recommendations in this report would reduce reliance on General Revenue–Dedicated accounts for certification of the 2016–17 budget by EXECUTIVE SUMMARY OF LEGISLATIVE BUDGET BOARD REPORTS – JANUARY 2015 – ID: 1913 approximately $1.5 billion. Almost all of these recommendations would require statutory changes or changes to the General Appropriations Bill. Reducing the amount of General Revenue–Dedicated account balances that may be counted toward certification has consequences both in terms of complying with the Constitutional provision that limits appropriations in any biennium to revenue estimated to be available by CPA and appropriation and revenue decisions the Legislature may choose to make. The full text of this report can be found in Further Reduce Reliance on General Revenue–Dedicated Accounts for Certification of the State Budget (Legislative Budget Board, January 2015.) EXECUTIVE SUMMARY OF LEGISLATIVE BUDGET BOARD REPORTS – JANUARY 2015 – ID: 1913 21 22 EXECUTIVE SUMMARY OF LEGISLATIVE BUDGET BOARD REPORTS – JANUARY 2015 – ID: 1913 OVERVIEW OF STATE OFFICE SPACE PLANNING LBB FACTS AND FINDINGS TFC manages more than 28 million square feet of owned and leased real estate assets on behalf of the state at a total annual cost of $218.0 million. This space includes property ranging from cemeteries to laboratories. The state owns approximately 100 buildings, covering nearly 11 million square feet spread throughout 8 cities. More than 18,000 employees work in these buildings. TFC maintains more than 800 leases, covering more than 10 million square feet spread throughout 253 cities and providing office space for more than 41,200 employees. Since 1989, state-leased office space has increased by 14 percent, and the cost of leased space has increased 138 percent. Although state office buildings are at capacity, no new state office buildings have been authorized since 2000. In 2013, the Legislature appropriated funds to begin building office space in the Capitol Complex and Austin, but appropriations were vetoed because the Capitol Complex changes were not made with input from other agencies as required by new legislation. TFC has requested appropriations for buildings in Austin for fiscal years 2016 and 2017. This report would not have a fiscal impact for the 2016–17 biennium. It provides an overview of the state’s procurement of owned and leased space, the methodologies the Texas Facilities Commission (TFC) uses when determining how to meet space needs, and how other jurisdictions perform facility acquisition functions. This report focuses primarily on office space in the Austin area, including the Capitol Complex. The State of Texas employs more than 300,000 full-time-equivalent employees in more than 250 towns and cities throughout the state. While higher education institutions and certain other state entities may purchase, build, or lease their own office space, TFC assists approximately 100 agencies in locating office space for employees. Statute requires the commission to give preference to state-owned office space when finding space for agencies. However, as of calendar year 2014, approximately 60 percent of the state’s occupied office space is leased. It is common throughout the United States for the federal and state governments to both own and lease office space. Jurisdictions use owned and leased space to perform mandated functions, conduct administrative work, and provide services to the public. Efficiently and effectively placing agencies in office space generally requires knowledge of agencies and their functions, an understanding of the real estate market and projected changes to the market, and an understanding of current and projected needs in the state. This report provides an overview of the history of the state’s procurement of owned and leased space, the methodologies TFC uses when determining how to meet space needs, and a synopsis of how other jurisdictions perform facility acquisition functions. Experts contend that changing work schedules and alternative work strategies will continue to change organizations’ office space needs, both in the private and public sectors. The Legislature demonstrated interest in and appropriated funds for building in the Austin area during the 2014–15 biennium; however, these appropriations were vetoed. Therefore, this report focuses primarily on office space in the Austin area, including the Capitol Complex. Figure 1 shows a summary of TFC’s building plan for the Capitol Complex and North Austin as of calendar year 2014. The full text of this report can be found in the Texas State Government Effectiveness and Efficiency Report (Legislative Budget Board, January 2015), page 127. (LBB Facts and Findings con tinued on next page) EXECUTIVE SUMMARY OF LEGISLATIVE BUDGET BOARD REPORTS – JANUARY 2015 – ID: 1984 23 OVERVIEW OF STATE OFFICE SPACE PLANNING LBB FACTS AND FINDINGS (CONTINUED) When agencies request ad ditional office space, statute requires TFC to first consider existing state-owned space, as well as historical buildings. If none are available or appropri ate, the commission considers leased space. TFC utilizes a best value standard when obtaining leases. The introduced 2016–17 Gen eral Appropriations Bill does not include any adjustments as a result of this report. This report does not include any recommen dations. FIGURE 1 TEXAS FACILITIES COMMISSION’S CAPITOL COMPLEX AND NORTH AUSTIN BUILDING PLAN, CALENDAR YEAR 2014 PROJECT PHASE PROJECT Phase 1 1 Capitol Complex building 1 Capitol Complex parking structure 1 North Austin building 1 North Austin parking structure Phase 2 1 Capitol Complex building with underground parking 3 North Austin buildings 1 North Austin parking structure TOTAL COST $174.5 million (Capitol Complex) $186.5 million (North Austin) RETIRED LEASES (AT COMPLETION OF PROJECT) RETIRED LEASE EXPENSES (ANNUAL) 5 (Capitol Complex) 6 (North Austin) $4.4 million (Capitol Complex) $6.0 million (North Austin) 2 (Capitol Complex) 7 (North Austin) $3.8 million (Capitol Complex) $5.0 million (North Austin) 20 leases $19.2 million Future Phases (as necessary) TOTAL 2 Capitol Complex buildings (1 with underground parking) 1 Capitol Complex parking structure 4 North Austin buildings 2 North Austin parking structures NOTE: Information relating to costs of Phase 2 and specific details of additional phases are not yet available. SOURCE: Texas Facilities Commission. 24 EXECUTIVE SUMMARY OF LEGISLATIVE BUDGET BOARD REPORTS – JANUARY 2015 – ID: 1984 ALIGN NEW GRADUATE MEDICAL EDUCATION FUNDING WITH THE HEALTHCARE NEEDS OF THE STATE LBB RECOMMENDATIONS 1 Amend statute to establish a critical shortage physician program at THECB. 2 Include a contingency rider to appropriate $19.8 million in All Funds to THECB to implement a critical shortage physician program. 3 Increase appropriations by $500,000 in General Revenue Funds to the Texas Department of State Health Services and include a rider to direct the Health Professions Resource Center to conduct research about the physician workforce. 4 Increase funding to THECB for the Primary Care and Fam ily Medicine Residency programs by $15.4 million in All Funds. 5 Amend statute to establish a teaching health center GME program at THECB. 6 Include a contingency rider to appropriate $16.2 million in All Funds to THECB to implement a teaching health center GME program. 7 These recommendations would result in a cost of $59.3 million in All Funds for the 2016–17 biennium and would better align Graduate Medical Education (GME) state funding with the state’s healthcare needs. GME is the supervised training that medical school graduates enter to gain clinical and practical experience in a specific field of medicine before becoming licensed doctors. State and federal funding for GME is not optimally aligned with the healthcare needs of Texas. GME is financed primarily with federal funding from the Medicare program. State funds are also used and distributed through three funding mechanisms: (1) General Revenue Funds trusteed to the Texas Higher Education Coordinating Board (THECB) for GME-related grant programs; (2) General Revenue Funds allocated through GME formula funding to health-related institutions (HRI); and (3) Medicaid payments to certain state-owned teaching hospitals. The General Revenue Funds allocated through the GME formula to HRIs does not encourage a balanced geographic distribution and mix of primary and specialty physicians. Historically, the trusteed programs have provided funding for primary care residency programs. Both HRIs and non-HRI institutions may apply for trusteed program funding. However, the GME formula funding is exclusive to HRIs, and it may be used for all types of accredited residency programs. Since the GME formula’s establishment, a larger proportion of state funds has been allocated to HRIs where two-thirds of filled residency slots are for training other than primary care. Texas, along with the rest of the country, is experiencing an imbalance of primary care and non-primary care doctors. State funding has decreased or been eliminated for primary care residency programs, which limits the state’s ability to incentivize entities to continue to train doctors to practice in this field. Texas continues to have a geographic maldistribution of healthcare practitioners. Sixty-nine percent of Texas counties are designated as a whole or partial Primary Care Health Professional Shortage Area. Texas may soon be losing doctors to other states that could help address this shortage because there are not sufficient residency slots to accommodate all Texas medical school graduates. Amend statute to establish a GME partnership grant program at THECB for community health clinics to receive guidance from medical schools or other established institutions when beginning the accreditation process for a new medical residency program. Graduation from Texas medical schools has increased, and three new medical schools (two public and one private) are expected to open by 2016, which will increase the need for residency slots. Because the location of residency training influences where doctors practice, it is important that more residency slots are established so that the state retains its educational investment in medical students and does not lose them to other states. Without faculty to teach medical residents, the ability of residency programs to expand or add new slots may be constrained. Few programs exist in the state to train doctors who are not medical school faculty to supervise and train residents. (LBB Recommendations tinued on next page) To address these concerns, recommendations in this report would do the following: (1) improve the mix and geographic distribution of doctors by identifying the types of doctors that are in critical supply and fund residency programs in these disciplines; con EXECUTIVE SUMMARY OF LEGISLATIVE BUDGET BOARD REPORTS – JANUARY 2015 – ID: 1934 25 ALIGN NEW GRADUATE MEDICAL EDUCATION FUNDING WITH THE HEALTHCARE NEEDS OF THE STATE LBB RECOMMENDATIONS CONTINUED) 8 Include a contingency rider to appropriate $6.0 million in All Funds to THECB to implement the GME partnership grant program. 9 Increase appropriations by $1.4 million in All Funds to THECB to develop physician faculty. 10 Include a rider to require THECB to provide a report about the impact of new funding for graduate medical education and submit this report to the Legislative Budget Board and the Office of the Governor. (2) add more residency slots, with a focus on rural and underserved areas; (3) bring together established residency programs with new and developing residency programs so that the established programs can mentor the new programs during the accreditation process, which can be difficult to navigate; and (4) ensure that welltrained faculty are available to teach residents. Lastly, THECB would be required to provide a report about the effects of any new funding the Legislature chooses to provide to the GME system. These recommendations would cost $59.3 million in All Funds for the 2016–17 biennium and would add an estimated 458 new GME slots statewide. FIGURE 1 FIVE-YEAR FISCAL IMPACT OF RECOMMENDATIONS FISCAL YEARS 2016 TO 2020 YEAR PROBABLE SAVINGS/(COST) IN ALL FUNDS PROBABLE ADDITION/ (REDUCTION) OF FULL-TIMEEQUIVALENT POSITIONS 2016 ($23,692,080) 1.0 2017 ($35,692,080) 1.0 2018 ($47,692,080) 1.0 2019 ($47,692,080) 1.0 2020 ($47,692,080) 1.0 SOURCE: Legislative Budget Board. The introduced 2016–17 Gen eral Appropriations Bill does not include any adjustments as a re sult of these recommendations. Recommendations 1, 5, and 7 require statutory changes. The remaining recommendations re quire appropriations or riders. 26 The full text of this report can be found in the Texas State Government Effectiveness and Efficiency Report (Legislative Budget Board, January 2015), page 139. EXECUTIVE SUMMARY OF LEGISLATIVE BUDGET BOARD REPORTS – JANUARY 2015 – ID: 1934 STRENGTHEN THE RETURNED VALUE FUNDING APPROACH FOR THE TEXAS STATE TECHNICAL COLLEGE SYSTEM LBB RECOMMENDATIONS 1 Amend the allocation of appropriations through the TSTC instruction and admin istration funding formula so that half of the funding is based on contact hours and the other half is based on the number of currentyear graduates with certificates and degrees. 2 Amend the Special Provisions Relating Only to Components of Texas State Technical College System rider on returned value funding to remove the restrictions on funding time in instruction. The introduced 2016–17 General Appropriations Bill does not in clude any adjustments as a result of these recommendations. Rec ommendation 1 would require changing how appropriations are allocated. Recommendation 2 would require amending a rider. These recommendations would not have a fiscal impact for the 2016–17 biennium. They would ensure state funding is better aligned with the state’s policy goals as they relate to the Texas State Technical College (TSTC) system. The Eighty-third Legislature, Regular Session, 2013, amended how the state allocates instruction and administration formula funds to the TSTC system. For the 2014–15 biennium, the Legislature appropriated $89.8 million to TSTC through a method known as returned value. Returned value seeks to reward performance by funding the system based on the total wages and job placement of a select group of former students. Previously, the appropriation was based on contact hours, which refers to the hours of scheduled academic and technical instruction provided to students during a semester. The new funding approach aligns TSTC’s funding with the system’s primary mission of meeting the high-tech challenges of today’s economy and placing students into well-paying jobs. However, there are consequences as a result of this approach. The returned value funding approach: discourages the institutions from providing dualcredit programs, which are important to helping the state reach its public education goals; penalizes the institutions for students who transfer to four-year institutions; disproportionately rewards the colleges for admitting students who had previously graduated from a four-year institution; provides funding for the institutions based largely on factors outside of the colleges’ control; and does not consider the institutions’ cost of providing training services, which limits the state’s ability to realize savings if costs decrease. Amending TSTC’s funding formula so that funding is based on time in instruction and the number of degrees and certificates awarded would ensure that the system’s funding is better aligned with the state’s policy goals. The full text of this report can be found in the Texas State Government Effectiveness and Efficiency Report (Legislative Budget Board, January 2015), page 157. EXECUTIVE SUMMARY OF LEGISLATIVE BUDGET BOARD REPORTS – JANUARY 2015 – ID: 1941 27 CLARIFY ELIGIBILITY FOR PROFESSIONAL NURSING SHORTAGE REDUCTION PROGRAM FUNDS TO INCREASE AWARDS FOR TEXAS STUDENTS LBB RECOMMENDATION 1 Amend the Professional Nursing Shortage Reduction Program rider to prohibit nonresident students who are enrolled in online professional nursing programs while residing out-of-state from being included in methodologies used to calculate program awards. The introduced 2016–17 Gener al Appropriations Bill includes a rider implementing Recommen dation 1. This recommendation would not have a significant fiscal impact for the 2016–17 biennium. It would clarify that nonresident students living out of-state would not be included in the data used to calculate awards for the Professional Nursing Shortage Reduction Program. Texas has a shortage of registered nurses. According to the Texas Center for Nursing Workforce Studies, the demand for nursing services is expected to increase as the Texas population ages and as more of the aging nurse population retires. The Professional Nursing Shortage Reduction Program was established to provide institutions funding to prepare more students for initial licensure as registered nurses. From fiscal years 2010 to 2015, the Texas Legislature appropriated approximately $89.0 million in General Revenue Funds to the program to incentivize institutions to expand nursing education in Texas. Since the program was enacted, the number of nursing degrees and certificates granted from professional nursing programs in Texas has increased by 113 percent. Some institutions that receive funds offer online nursing degree programs. The online programs have been valuable for many nurses who must remain employed during their education. However, online program enrollment may include nonresident students who reside outside of Texas and who do not intend to practice nursing in Texas. Unlike methodologies used to distribute formula funding for electronic distance education, funding methodologies used to distribute funds from the Professional Nursing Shortage Reduction Program do not consider the location at which students who are enrolled in online courses reside. Including nonresident students residing outside of Texas in data that is used to distribute awards prevents the state from maximizing funds to address Texas’ nursing shortage. Clarifying that online nonresident students residing in other states should be excluded from award calculations and improving data collection would maximize funding available to meet the Legislature’s goal of reducing the state’s nursing shortage. The full text of this report can be found in the Texas State Government Effectiveness and Efficiency Report (Legislative Budget Board, January 2015), page 166. 28 EXECUTIVE SUMMARY OF LEGISLATIVE BUDGET BOARD REPORTS – JANUARY 2015 – ID: 1922 EVALUATE THE NURSING FIELD OF STUDY CURRICULUM TO INCREASE THE NUMBER OF NURSES WITH ADVANCED DEGREES LBB RECOMMENDATION 1 Include a rider to direct THECB to evaluate the nursing field of study curricula using processes developed by the Texas Tuning Project and best practices in nursing curriculum to enhance the effectiveness of field of study curricula in reducing barriers for students who transfer between nursing programs. The introduced 2016–17 Gener al Appropriations Bill includes a rider implementing Recommen dation 1. This recommendation would not have a significant fiscal impact for the 2016–17 biennium. It would direct the evaluation of the nursing field of study curricula to improve its implementation by community colleges. From fiscal years 2007 to 2014, the number of registered nurses in Texas who have earned a diploma, associate degree, or bachelor’s degree in nursing grew by 42 percent. While the number of nurses available to meet the state’s healthcare needs is increasing, trends are shifting toward registered nurses with baccalaureate degrees. As of 2014, approximately 209,000 positions for registered nurses were available in the state, and the demand is expected to grow 33 percent by 2020. Nationally there has been a call for 80 percent of the nursing workforce to hold at least a bachelor’s degree by 2020, and the Texas Team Advancing Health Through Nursing action coalition, which includes several state agencies and institutions of higher education, has been working to implement these recommendations in Texas. Encouraging registered nurses with associate degrees to obtain advanced degrees is one strategy to increase the number of registered nurses with baccalaureate degrees in Texas. However, a majority of registered nurses who have associate degrees do not obtain baccalaureate degrees. Differences in nursing education program curricula are one obstacle that hinders students from transitioning between nursing education levels. To facilitate the transfer of students’ credits between two-year and four-year institutions, a nursing field of study curriculum was developed by the Texas Higher Education Coordinating Board (THECB) in 2002. However, it is offered by few Texas institutions and may be obsolete. To facilitate student transfers in other academic discipline areas, institutions have jointly developed, using the Texas Tuning Project, voluntary agreements to accept transferred credits. Applying a similar process to nursing curricula could refine and expand implementation of Texas’ field of study curriculum in nursing. This change would address one of the factors that prevent nursing students from continuing their education to obtain baccalaureate degrees. The full text of this report can be found in the Texas State Government Effectiveness and Efficiency Report (Legislative Budget Board, January 2015), page 170. EXECUTIVE SUMMARY OF LEGISLATIVE BUDGET BOARD REPORTS – JANUARY 2015 – ID: 1889 29 OVERVIEW OF CURRENT PRACTICES AND ALTERNATIVES FOR HIGHER EDUCATION CAPITAL FUNDING LBB FACTS AND FINDINGS A total of $4.7 billion in TRB debt has been authorized by the Legislature since the inception of the tuition revenue bond program in the early 1970s. As of August 31, 2014, $2.2 billion of this amount was outstanding. Texas institutions have request ed $5.6 billion in new TRB authorizations for the 2016–17 biennium. Debt service for these authorizations would to tal an additional $960.5 million for the 2016–17 biennium. No new TRBs have been authorized since 2009, when the Legislature authorized $155.0 million, mostly for repairs at the University of Texas Medical Branch at Galveston due to damage from Hurricane Ike. The last major statewide authorization occurred in 2006, when $1.9 billion was authorized for 63 projects at 47 institutions. The Legislature has several options that it could implement as an alternative to the current practice of TRBs for higher education capital funding. This report would not have a fiscal impact for the 2016–17 biennium. It provides an overview of higher education capital funding in Texas, with a specific focus on the tuition revenue bond (TRB) program. The report also examines the benefits and drawbacks associated with five alternatives for financing capital projects at public institutions of higher education in Texas. Texas uses TRBs as a state-supported funding source for capital projects at public higher education institutions. Public universities, health-related institutions, Texas State Technical Colleges, and Lamar State Colleges are eligible to issue these types of bonds. Bonds are authorized by the Legislature in statute and are backed by tuition, fees, and other revenue collected by the institutions. The Legislature typically appropriates General Revenue Funds to reimburse institutions for their debt service on the bonds. TRB debt is backed by tuition and fees from institutions, and General Revenue Funds are used to reimburse the institutions; therefore, the program is not subject to the provision in the Texas Constitution restricting use of General Revenue Funds to finance higher education capital projects. TRBs also are not subject to the state’s constitutional debt limit, which limits the amount of general obligation debt that the state can authorize. While a total of $4.7 billion in tuition revenue bond debt has been authorized by the Legislature since the inception of the TRB program in the early 1970s, no new TRBs have been authorized since 2009. Figure 1 shows the history of TRB authorizations. This report highlights five policy alternatives for funding capital projects at higher education institutions and discusses the benefits and challenges associated with each proposal. These alternatives include: enacting a General Obligation bond program for higher education capital funding; merging the Permanent University Fund and the Higher Education Fund; prioritizing tuition revenue bonds for projects at institutions that do not have access to Permanent University Fund-backed bonds; reimbursing institutions for only a portion of their tuition revenue bond debt service; and establishing a cap on tuition revenue bond debt service. The full text of this report can be found in the Texas State Government Effectiveness and Efficiency Report (Legislative Budget Board, January 2015), page 176. The introduced 2016–17 Gen eral Appropriations Bill does not include any adjustments as a result of this report. This report does not include any recommen dations. 30 EXECUTIVE SUMMARY OF LEGISLATIVE BUDGET BOARD REPORTS – JANUARY 2015 – ID: 1937 OVERVIEW OF CURRENT PRACTICES AND ALTERNATIVES FOR HIGHER EDUCATION CAPITAL FUNDING FIGURE 1 TUITION REVENUE BONDS AUTHORIZATIONS FOR TEXAS INSTITUTIONS, FISCAL YEARS 1971 TO 2015 LEGISLATION House Bill 1657, Sixty-second Legislature, Regular Session, 1971 AUTHORIZATION $185.0 Senate Bills 2 and 129, Sixty-third Legislature, Regular Session, 1973 57.5 House Bill 2102, Seventy-second Legislature, Regular Session, 1991 30.0 Senate Bill 3, Seventy-second Legislature, First Called Session, 1991 30.0 House Bill 2058, Seventy-third Legislature, Regular Session, 1993 House Bill 2747, Seventy-fourth Legislature, Regular Session, 1995 House Bill 1235, Seventy-fifth Legislature, Regular Session, 1997 House Bill 658, Seventy-seventh Legislature, Regular Session, 2001 House Bills 1941 and 2522, and Senate Bill 800, Seventy-eighth Legislature, Regular Session, 2003 352.4 9.0 638.5 1,081.8 220.4 House Bill 28, Seventy-eighth Legislature, Third Called Session, 2003 48.5 House Bill 153, Seventy-ninth Legislature, Third Called Session, 2006 1,858.8 House Bill 1775, Eightieth Legislature, Regular Session, 2007 13.0 House Bill 51, Eighty-first Legislature, Regular Session, 2009 155.0 TOTAL $4,679.8 NOTE: Amounts shown in millions. SOURCE: Legislative Budget Board. EXECUTIVE SUMMARY OF LEGISLATIVE BUDGET BOARD REPORTS – JANUARY 2015 – ID: 1937 31 OVERVIEW OF RESEARCH ACTIVITIES AT EDUCATION RESEARCH CENTERS LBB FACTS AND FINDINGS The ERC structure appears to be an effective mechanism for dealing with data linkage limitations imposed by federal privacy laws. The three ERCs initiated 107 projects from the time they were established in 2007 through August 2014. A majority of the initiated projects (84.1 percent) used data from the Texas Education Agency. A majority of projects also used data from THECB (57.9 percent). Use of other datasets, such as those from the Texas Workforce Commission, was less common. Of initiated projects, 60 fit within one of the four areas included in the Request for Proposal (56.1 percent) for the ERCs. All of the remaining projects fit within both the statutory authorization for the centers and the additional areas of research detailed by THECB in the Request for Proposal. The University of Texas at Austin and The University of Texas at Dallas Education Research Centers reported publishing 22 book chapters, 11 dissertations, and 76 research reports tied to initiated projects, with several journal articles in pre-publication stages and expected to be published in the future. This report would not have a fiscal impact for the 2016–17 biennium. It summarizes the legislative history and implementation of Education Research Centers and provides information regarding the quantity and type of publications they have generated. The K–12 educational system prepares young adults for the workplace and higher education. Understanding how effective these systems are requires the analysis of data from across the public education, higher education, and workforce systems. However, federal educational privacy laws restrict the exchange of data among state agencies and make these analyses difficult or impossible to achieve. As a result, in 2007, the Texas Legislature established three Education Research Centers (ERCs) to function as federally approved central data repositories that allow researchers to examine education policy and program effectiveness. As required by statute, the Texas Higher Education Coordinating Board (THECB) selected three universities— Texas A&M University, The University of Texas at Austin, and The University of Texas at Dallas—as ERCs. In 2013, following changes to their authorizing statute, the centers at The University of Texas at Austin and The University of Texas at Dallas were granted continuation contracts for an additional 10 years. The full text of this report can be found in the Texas State Government Effectiveness and Efficiency Report (Legislative Budget Board, January 2015), page 186. The introduced 2016–17 Gen eral Appropriations Bill does not include any adjustments as a result of this report. This report does not include any recommen dations. 32 EXECUTIVE SUMMARY OF LEGISLATIVE BUDGET BOARD REPORTS – JANUARY 2015 – ID: 1929 REPORT ON THE HAZLEWOOD EXEMPTION LBB FACTS AND FINDINGS Waived tuition and fee revenue at institutions of higher edu cation for the Hazlewood Ex emption increased from $24.7 million in fiscal year 2009 to $169.1 million in fiscal year 2014. The number of awards increased from approximately 10,000 to 39,000 during the same period. In 2012, there were over 71,000 beneficiaries in Texas that re ceived veterans’ education ben efits from the U.S. Department of Veterans Affairs. The num ber of beneficiaries in Texas has more than doubled since 2000. The most used veterans’ educa tion benefits in Texas are the Post-9/11 G.I. Bill, Montgom ery G.I. Bill, and Survivors’ and Dependents’ Educational As sistance. The highest growth in recipients of the Hazlewood Exemption is occurring in the Hazlewood Legacy Program. Options to limit the amount of waived revenue resulting from the Legacy Program could include incorporating a socioeconomic factor into the benefit, reducing the number of semester credit hours available for transfer, or basing the number of semester credit hours available to transfer on service time. The introduced 2016–17 Gen eral Appropriations Bill does not include any adjustments as a result of this report. This report does not include any recommen dations. This report would not have a fiscal impact for the 2016–17 biennium. The report describes the Hazlewood Exemption offered by public institutions of higher education and federal education benefits available for veterans. In addition, the report provides student characteristics of recipients of the Hazlewood Exemption and the history of the exemption. The report also estimates the future fiscal impact of the exemption. Limiting the eligibility or benefit of the Hazlewood Legacy Program could lower the amount of waived tuition and fee revenue at public institutions of higher education in Texas. The Texas Education Code, Section 54.3411, requires the Legislative Budget Board, in consultation with the Texas Veterans Commission and Texas Higher Education Coordinating Board, to study the tuition and fee exemptions provided by the Texas Education Code, Section 54.341, commonly referred to as the Hazlewood Exemption, and federal education benefits for veterans. Per the requirement to review sustainability and fiscal efficiency of the exemption, the report includes options to limit the eligibility or benefit received through the Hazlewood Legacy Program. The Hazlewood Exemption was established to provide an exemption for veterans and, in certain cases, qualified spouses or dependents, for tuition and required fees to a Texas institution of higher education (IHE). This exemption applies to a maximum of 150 semester credit hours. Spouses and dependents are eligible for this exemption if the veteran spouse or parent is killed in action, died while in service, died as a result of service-related injuries or illness, is classified as missing in action, or became totally and permanently disabled or meets the requirements for unemployability according to the Department of Veterans Affairs due to servicerelated injury or illness. The Hazlewood Exemption applies to all tuition charges, including both statutory tuition and designated tuition, and certain fees and is applicable at any public IHE in Texas. The exemption is available for qualified recipients who do not receive federal veterans’ education benefits or for those individuals with federal veterans’ education benefits whose total award available for tuition and fees is lower than the value of the exemption. The Hazlewood Legacy Act, passed by the Legislature in 2009, authorizes a veteran to transfer this educational benefit to one of his or her children by assigning eligible unused semester credit hours to the child. The Hazlewood Legacy Program allows the qualified child to be exempt from payment of the tuition and required fees for those transferred hours at a public IHE in Texas. Figure 1 shows the number of students across all IHEs receiving the Hazlewood Exemption and the associated amount of tuition and fees waived from fiscal year 2009 through fiscal year 2013. Included in this figure is information for the year before, during, and following implementation of the Hazlewood Legacy Program in fiscal year 2010. In 2012, there were 71,331 beneficiaries in Texas that received veterans’ education benefits from the U.S. Department of Veterans Affairs. The number of beneficiaries EXECUTIVE SUMMARY OF LEGISLATIVE BUDGET BOARD REPORTS – JANUARY 2015 – ID: 1874 33 REPORT ON THE HAZLEWOOD EXEMPTION FIGURE 1 HAZLEWOOD EXEMPTION AWARD RECIPIENTS AND AWARD VALUE FISCAL YEARS 2009 TO 2014 YEAR 2009 STUDENTS VALUE OF AWARDS (IN MILLIONS) 9,882 $24.7 2010 13,837 $34.3 2011 22,585 $71.9 2012 29,003 $110.2 2013 35,769 $146.1 2014 38,946 $169.1 NOTE: Spouses and legacy recipients became eligible for the exemption during fiscal year 2010. Students co-enrolled across institutions and receiving Hazlewood Exemption at two institutions are counted at each institution. SOURCE: Texas Higher Education Coordinating Board. in Texas has more than doubled since 2000. The most used veterans’ education benefits in Texas are the Post-9/11 G.I. Bill, Montgomery G.I. Bill, and Survivors’ and Dependents’ Educational Assistance. The report describes the types of federal education benefits available to veterans, dependents, and spouses. Two key federal agencies administer these benefits: the U.S. Department of Veterans Affairs and U.S. Department of Education. Both the total number of veterans’ education beneficiaries and the federal expenditures for veterans’ education has increased in Texas since the Post-9/11 G.I. Bill went into effect in 2009. The report reviews characteristics related to demographics, coursework, degree information, and cost of attendance for Hazlewood Exemption recipients in fiscal years 2012 and 2013. The report also estimates the future impact of the exemption based on current usage, increased program awareness, and recent tuition increases. According to the Legislative Budget Board staff estimates, the number of awards for the exemption will increase from approximately 39,000 in fiscal year 2014 to 63,000 in fiscal year 2019. This increase would result in estimated waived tuition and fee revenue of $379.1 million in fiscal year 2019. Potential options to reduce the amount of waived tuition and fees could be achieved through a modification of the existing Legacy Program to limit eligibility or the amount of tuition and fees that could be waived through the program. Options to limit the Legacy Program could focus on the following: • incorporate socioeconomic criterion so that the percentage of benefit received by a legacy recipient would incrementally decrease as a student’s family income increased; • reduce the number of semester credit hours eligible for transfer from a veteran to a child depending on the type of institution attending; or • model the program after the Post-9/11 G.I. Bill, whereby service time is linked to a percentage of the benefit. As service time increases, the number of semester credit hours that can be transferred would increase. The full text of this report can be found in Report on the Hazlewood Exemption (Legislative Budget Board, December 2014). 34 EXECUTIVE SUMMARY OF LEGISLATIVE BUDGET BOARD REPORTS – JANUARY 2015 – ID: 1874 IMPROVE THE EVALUATION AND ADMINISTRATION OF THE MEDICAID ADULT SUBSTANCE USE DISORDER TREATMENT BENEFIT LBB RECOMMENDATIONS 1 Amend the existing rider on Medicaid Substance Abuse Treatment to require HHSC to evaluate the impact of the adult Medicaid substance use disorder benefit on overall Medicaid spending and client outcomes. 2 Amend statute to require HHSC to implement efforts to increase awareness of Medicaid substance use disorder treatment services. 3 Amend statute to require HHSC to streamline the process used to authorize Medicaid substance use disorder treatment services. 4 Amend statute to require HHSC to determine whether quantitative limitations on the amount of substance use disorder treatment services can and should apply to adult clients in the Texas Medicaid program. If the agency determines that limitations can and should be applied, the limitations should be properly established in the Medicaid state plan and the Uniform Managed Care Contract by September 1, 2015. The introduced 2016–17 General Appropriations Bill includes a modification to an existing rider to implement Recommendation 1. Recommendations 2, 3, and 4 require statutory changes. These recommendations would not have a significant fiscal impact for the 2016–17 biennium. The recommendations are intended to help ensure that adult Medicaid clients with substance use disorders receive appropriate high-quality services, thus reducing non-treatment Medicaid spending and improving the state’s ability to monitor program performance and make system improvements. A substance use disorder (SUD) is a maladaptive pattern of substance use that leads to clinically significant impairment or distress. Substance use disorders increase the risk of illness and result in greater use of medical care, including services paid for by the Texas Medicaid program. According to the National Institutes of Health, these disorders can be managed successfully, similarly to diseases such as diabetes, asthma, or heart disease. The Legislature directed the Texas Health and Human Services Commission (HHSC) to use existing Medicaid funds to implement a comprehensive Medicaid substance use disorder benefit for adults. This benefit was intended to decrease Texas Medicaid program spending associated with adults with SUDs. The agency began implementing the benefit on September 1, 2010, with full implementation on January 1, 2011. The benefit is available to all adults who have full Medicaid coverage, meet treatment requirements, and are enrolled in either the fee-for-service system or state managed-care programs. One measure of access to care is the adult Medicaid SUD treatment penetration rate. This is a measure of the percentage of adult Medicaid clients with an identified SUD who received treatment services funded by Medicaid. The rate in Texas for fiscal years 2011 and 2012 was 2.2 percent. The low penetration rate diminishes the potential for cost savings. The General Appropriations Act (2014–15 Biennium), Rider 48, page II–101, specifies that HHSC may not provide Medicaid substance use disorder treatment services if the Legislative Budget Board determines that the treatment services have resulted in an increase in overall Medicaid spending. Several factors prevent a definitive assessment of whether the adult Medicaid SUD benefit has resulted in an increase in overall Medicaid spending, or whether the cost has been offset by reductions in other healthcare spending. In addition, the state lacks a consistent process for authorizing Medicaid SUD treatment services and has imposed quantitative limitations, or caps, on the amount of services provided to adult clients. These limitations are in conflict with the Medicaid state plan and the Uniform Managed Care Contract. Inconsistencies in authorization processes and limitations on the amount of services may impact the effectiveness of treatment and may adversely affect clients and providers. To maximize the services’ effectiveness and allow for an evaluation of the benefit, HHSC should improve the administration of these services. Increasing awareness of these services, improving the collection and analysis of data, streamlining the process used to authorize treatment, and reviewing the use of treatment limitations would EXECUTIVE SUMMARY OF LEGISLATIVE BUDGET BOARD REPORTS – JANUARY 2015 – ID: 1932 35 IMPROVE THE EVALUATION AND ADMINISTRATION OF THE MEDICAID ADULT SUBSTANCE USE DISORDER TREATMENT BENEFIT help ensure that Medicaid clients who have a SUD receive appropriate high-quality services and provide the data needed to evaluate the effects of the benefit on overall Medicaid spending and client outcomes. The full text of this report can be found in the Texas State Government Effectiveness and Efficiency Report (Legislative Budget Board, January 2015), page 191. 36 EXECUTIVE SUMMARY OF LEGISLATIVE BUDGET BOARD REPORTS – JANUARY 2015 – ID: 1932 EVALUATE PAY FOR QUALITY MEASURES IN THE TEXAS MEDICAID PROGRAM LBB RECOMMENDATION 1 Include a rider directing HHSC to evaluate how Texas Medicaid providers and MCOs use existing pay for quality measures to improve healthcare delivery and whether the measures result in a higher quality of care and improved health outcomes. The rider also would require HHSC to report findings to the Governor, the Legislative Budget Board, and the appropriate standing committees of the Legislature by December 1, 2016. The report should indicate: (1) efforts undertaken to make the current pay for quality methods more effective; and (2) how HHSC will apply improvements in pay for quality methods if they are expanded into outpatient settings. The introduced 2016–17 Gen eral Appropriations Bill includes a rider implementing this recom mendation. This recommendation would not have a significant fiscal impact for the 2016–17 biennium. It would ensure that the Texas Health and Human Services Commission (HHSC) evaluates existing pay for quality measures in the Texas Medicaid program and uses study findings to improve these programs and their implementation and expansion. In an effort to improve patient safety, Texas has implemented a variety of pay for quality programs that gather data on adverse medical events, beginning in 2007. These programs are intended to provide incentives to hospital providers and managed care organizations (MCO) to improve healthcare delivery and reduce the rate of these events. HHSC first adopted the federal Medicare program’s policy of denying partial payment of Medicaid claims that are coded with healthcare-associated infections and preventable adverse events. Subsequently, HHSC implemented adjustments to Medicaid payments to hospitals and MCOs based on self-reported data regarding potentially preventable readmissions and complications. The Pay-for-Quality program in Medicaid bases a percentage of payment to MCOs on rates of these and other healthcare measures of patient safety and potentially preventable care. Some studies suggest pay for performance initiatives may improve patient outcomes along some health dimensions, but more information about the relationship between payment incentive and provider behavior change is needed. By evaluating the pay for quality initiatives operating in the Texas Medicaid program, policymakers and healthcare administrators could improve their understanding of the effect of payment incentives on healthcare provider behavior. Isolating changes in healthcare delivery can help trace the relationship between state policy and clinical health outcomes. Measuring these effects can inform further implementation and expansion of pay for quality methods. The full text of this report can be found in the Texas State Government Effectiveness and Efficiency Report (Legislative Budget Board, January 2015), page 202. EXECUTIVE SUMMARY OF LEGISLATIVE BUDGET BOARD REPORTS – JANUARY 2015 – ID: 1931 37 IMPROVE TRANSPARENCY IN STAR MANAGED CARE PAYMENT RATE SETTING LBB RECOMMENDATION 1 Amend statute to require HHSC to more clearly describe and demonstrate the methodology by which STAR payment rates are set. The introduced 2016–17 Gen eral Appropriations Bill does not include any adjustments as a result of this recommendation. This recommendation requires statutory change. This recommendation would not have a significant fiscal impact for the 2016–17 biennium. It would require the Texas Health and Human Services Commission (HHSC) to provide more documentation and description of its managed care rate-setting process for policy makers to better assess the rates. In Medicaid managed care programs, the state contracts with private insurers who assume risk to provide and manage medical care for eligible clients. An estimated 82 percent of Texas Medicaid clients received services through managed care in fiscal year 2014; 57 percent of managed care clients were enrolled in the State of Texas Access Reform (STAR) managed care program, which provides acute care benefits primarily to eligible pregnant women and low-income children. The process by which STAR managed care payment rates are set is complex, includes dozens of factors that directly and indirectly affect rates, and changes over time. While the federal Centers for Medicaid and Medicare Services requires that states’ managed care rates be actuarially sound, HHSC and its actuaries have significant discretion in developing the rate-setting methodology. The rate-setting process for STAR payment rates lacks transparency and is poorly documented in the actuarial reports that are prepared to certify and provide supporting evidence for the rates. As a result, it is difficult to evaluate whether rates are reasonable and appropriate. More transparent documentation of the methodology, calculations, and assumptions used in the STAR rate-setting process would provide policy makers and stakeholders more information with which to understand the factors that affect program costs, deliberate program funding needs, and assess the efficacy of the rate-setting process. The full text of this report can be found in the Texas State Government Effectiveness and Efficiency Report (Legislative Budget Board, January 2015), page 207. 38 EXECUTIVE SUMMARY OF LEGISLATIVE BUDGET BOARD REPORTS – JANUARY 2015 – ID: 1926 IMPROVE RATE SETTING AND DATA TO ALLOW COMPARISON OF PACE TO STAR+PLUS LBB RECOMMENDATIONS 1 Amend statute to direct HHSC to modify the Texas Medicaid rate-setting process for PACE to ensure: (1) PACE Medicaid rates are adequate to sustain the program; (2) PACE Medicaid rates do not exceed the reasonable and necessary costs to operate PACE; and (3) the program is cost neutral relative to serving a person in the Medicaid STAR+PLUS managed care program. 2 Amend statute to direct HHSC and DADS to modify data collection for PACE and STAR+PLUS to allow for a comparison of Medicaid client outcomes across these models. 3 Amend statute to direct HHSC, in collaboration with DADS, to evaluate how PACE Medicaid costs and client outcomes compare to STAR+PLUS and to submit a report to the Legislative Budget Board and the Office of the Governor by December 1, 2016. The introduced 2016–17 Gen eral Appropriations Bill does not include any adjustments as a result of these recommendations. These recommendations require statutory changes. These recommendations would not have a fiscal impact for the 2016–17 biennium. They would help ensure that the Texas Program of All-Inclusive Care for the Elderly (PACE) has positive client outcomes and is a cost-effective model in Texas for Medicaid clients. These results would provide more certainty about the fiscal impact of any approved transfer of funds from STAR+PLUS to PACE. PACE is a capitated managed care program that integrates Medicare and Medicaid financing and is designed to help people age 55 or older who would otherwise need nursing facility care continue to live in the community. The program, which the Texas Department of Aging and Disability Services (DADS) administers, features a comprehensive medical and social service delivery system and provides all preventive, primary, acute, and long-term care services. The PACE model in Texas began in 1987 with the establishment of Bienvivir All-Inclusive Senior Health in El Paso. Three PACE programs in Texas serve four Texas counties: El Paso, Potter, Randall, and Lubbock. The Texas Medicaid program funds a fixed number of PACE slots at each site for Medicaid clients. The alternative community-based long-term care option for Texas Medicaid clients age 55 and older is the STAR+PLUS managed care program. STAR+PLUS, which has been expanded statewide, integrates the delivery of acute care and long-term services and supports and serves most of Texas’ aged Medicaid clients. In March 2015, Medicaid clients receiving nursing facility services will also be enrolled in STAR+PLUS. The Texas PACE program has operated for many years as a less expensive alternative to the Medicaid fee-for-service system for certain Medicaid clients who live in a PACE service area and require long-term care services. PACE may also provide a cost-effective alternative to STAR+PLUS. However, the state has not determined whether the PACE model can operate at a cost equal to or less than serving a person in STAR+PLUS. PACE Medicaid rates are currently set at an amount less than the cost of providing services to a comparable population in the Medicaid fee-for-service system, not managed care. As a result, provisions in the General Appropriations Act and in statute that allow the transfer of funds from STAR+PLUS to serve more clients in PACE if certain conditions are met could increase costs to the state. Furthermore, although national evaluations have shown that PACE enrollees have better outcomes than non-PACE populations, current data does not allow the state to compare Medicaid client outcomes across PACE and STAR+PLUS. The Texas Health and Human Services Commission (HHSC) should modify the Texas Medicaid rate-setting process for PACE to make certain that the program is cost neutral relative to serving a person enrolled in STAR+PLUS, and that PACE Medicaid rates are adequate and reasonable. This modification would ensure that any approved transfer of funds from STAR+PLUS to PACE would not increase costs to the state. Data collection efforts for PACE and STAR+PLUS should also be modified to allow for a comparison of Medicaid client outcomes across these models. The agency should evaluate how PACE Medicaid costs and client outcomes compare EXECUTIVE SUMMARY OF LEGISLATIVE BUDGET BOARD REPORTS – JANUARY 2015 – ID: 1916 39 IMPROVE RATE SETTING AND DATA TO ALLOW COMPARISON OF PACE TO STAR+PLUS to STAR+PLUS, including an assessment of future cost implications of the PACE model in Texas if the agency cannot make recommended changes to its rate-setting process. This evaluation would allow the Legislature to weigh the benefits of PACE against potential cost relative to STAR+PLUS. The full text of this report can be found in the Texas State Government Effectiveness and Efficiency Report (Legislative Budget Board, January 2015), page 216. 40 EXECUTIVE SUMMARY OF LEGISLATIVE BUDGET BOARD REPORTS – JANUARY 2015 – ID: 1916 COORDINATE NURSING FACILITY RESIDENT COMPLAINT DATA TO ENHANCE THE QUALITY OF CARE LBB RECOMMENDATIONS 1 Include a rider to designate the Office of the Long-term Care Ombudsman as the state entity responsible for coordinating, collecting, monitoring, and analyzing data about all nursing facility complaints, regardless of payer. The Long-term Care Ombudsman should include in its annual report information or other metrics about the quality of services in nursing facilities that will allow stakeholders to monitor and compare managed care organizations performance related to service delivery and complaint resolution. 2 Include a rider to require HHSC and DADS to form an interagency workgroup to share nursing facility resident complaint data and to determine standard definitions for the data to be shared between the two state agencies. 3 Include a rider to direct HHSC to collect certain consumer complaint information and data from Medicaid managed care organizations and to share the data with DADS. 4 Include a rider to require HHSC’s Office of the Ombudsman to report certain consumer complaint data no less than annually to HHSC’s Executive Commissioner, the Health and Human Services Council, and consumers of the respective health and human services programs. These recommendations would not have a fiscal impact for the 2016–17 biennium. They would ensure that the state has access to comprehensive data regarding nursing facility resident complaints, would ensure that trends in complaint data can be identified and recommendations to improve services in Medicaid managed care can be made, and would allow nursing facility residents to make informed choices about their care. As of 2014, 26 states have added nursing facility services to Medicaid managed care initiatives. With the enactment of legislation in 2013 to reform the Medicaid program, Texas nursing facility residents will receive their services from a managed care organization that contracts with the state. Starting March 1, 2015, nursing facility residents enrolled in Medicaid will receive their services through STAR+PLUS managed care. STAR+PLUS is the state Medicaid managed care program for people who have disabilities or are age 65 or older through which they receive health care services. Adding a managed care organization between the state and nursing facility residents adds a new layer of complexity that may be challenging for consumers to navigate when reporting a complaint about care. With this change, two state agencies, the Texas Health and Human Services Commission (HHSC) and the Texas Department of Aging and Disability Services (DADS), and managed care organizations may receive nursing facility resident complaints. Multiple avenues to accept complaints are beneficial; however, without interagency coordination to track and exchange resident complaint data, some complaints may go unresolved and critical trends may go unnoticed. Designating one entity to analyze and report nursing facility complaint data would ensure a comprehensive record and picture of residents’ concerns exists. Collecting sufficiently detailed complaint data from managed care organizations will allow the state to analyze the frequency and nature of complaints so it can recommend continuous improvements to enhance the quality of nursing facility services in Medicaid managed care. Furthermore, distributing the analysis of resident complaint data to consumers and advocates would ensure nursing facility residents can make informed choices regarding their care. The full text of this report can be found in the Texas State Government Effectiveness and Efficiency Report (Legislative Budget Board, January 2015), page 226. The introduced 2016–17 General Appropriations Bill includes a rider implementing these recommendations. EXECUTIVE SUMMARY OF LEGISLATIVE BUDGET BOARD REPORTS – JANUARY 2015 – ID: 1936 41 IMPROVE DATA AND OVERSIGHT TO REDUCE THE PREVALENCE OF EARLY ELECTIVE DELIVERIES OF NEWBORNS 1 These recommendations would not have a significant fiscal impact for the 2016–17 biennium, but would strengthen efforts to reduce early elective deliveries by improving the quality and reporting of related data and increasing audits of Medicaid claims. To the extent that the recommendations reduce early elective deliveries in the Texas Medicaid program, and thereby reduce spending related to negative maternal and infant health outcomes that result from these deliveries, there would be savings to the state. 2 Early elective deliveries of infants occur after 37 but before 39 completed weeks of gestation and are not medically necessary. Nonmedical reasons for an early elective delivery may include wanting to schedule the birth of the infant on a specific date, living far away from a hospital, or relief of discomfort in the last weeks of pregnancy. Early elective deliveries may occur either by induction of labor that results in a vaginal or cesarean delivery, or by a scheduled cesarean delivery. Research has shown that early deliveries without medical or obstetrical indication are linked to maternal and infant complications. Since 1979, the American College of Obstetricians and Gynecologists has promoted a clinical guideline discouraging deliveries before 39 weeks of gestation without medical or obstetrical need. LBB RECOMMENDATIONS Include a rider requiring DSHS to modify the methodology it uses to estimate the rate of early elective deliveries in Texas to include the use of administrative claims for all payer types contained in the Texas Health Care Information Collection data combined with birth certificate data. Include a rider requiring DSHS to annually report on its website state-estimated summary data regarding the rate of elective early deliveries. The rate should be reported by payer type and health service region, and by facility if allowed by state and federal law. Include a rider requiring the Texas Health and Human Services Commission to regularly audit claims submitted in the Texas Medicaid fee-for-service and managed care programs for obstetric delivery procedures that include a modifier indicating that the delivery was medically necessary and before 39 weeks of gestation. Include a rider requiring the Texas Health and Human Ser vices Commission, in collabora tion with DSHS, to evaluate the effectiveness of strategies to reduce early elective deliveries using im proved data and audit results and submit a report to the Legislative Budget Board and the Office of the Governor by December 1, 2016. 3 4 State health and human service agencies in Texas have implemented strategies to reduce early elective deliveries. However, data sources used by the state to estimate the rate of early elective deliveries have limitations and may over- or underestimate the rate. As a result, it is difficult for the state to evaluate the effects of efforts to reduce these deliveries. In 2014, the Texas Department of State Health Services began disseminating hospital-specific performance data to hospital administrators to educate them about their hospital’s performance on early elective deliveries compared to regional and state summary data. However, the agency does not publicly report its summary or facility-level data on these deliveries, due in part to restrictions on the primary data source used to estimate the rate of early elective deliveries. Furthermore, the Texas Health and Human Services Commission does not regularly audit Medicaid claims for early deliveries and may fail to identify provider payments that should be recouped. Managed care organizations participating in the Texas Medicaid program may also perform reviews of these claims and initiate recoupment of funds, but the number and frequency of their reviews varies. To improve maternal and infant health outcomes and reduce associated healthcare spending, the state should strengthen efforts to reduce early elective deliveries by improving the quality and reporting of related data and increasing audits of Medicaid claims. The full text of this report can be found in the Texas State Government Effectiveness and Efficiency Report (Legislative Budget Board, January 2015), page 237. The introduced 2016–17 Gener al Appropriations Bill includes a rider implementing these recom mendations. 42 EXECUTIVE SUMMARY OF LEGISLATIVE BUDGET BOARD REPORTS – JANUARY 2015 – ID: 1933 OVERVIEW OF FAMILY PLANNING SERVICES IN TEXAS LBB FACTS AND FINDINGS The family planning programs at DSHS and HHSC help con tain pregnancy-related Medicaid costs. In fiscal year 2013, preg nancy-related Medicaid services cost the state approximately $2.4 billion in All Funds, in cluding $971.0 million in Gen eral Revenue Funds. From fiscal years 2010 to 2014, expenditures of General Rev enue Funds for family plan ning services provided through HHSC’s Women’s Health Pro gram and DSHS’s Family Plan ning and Community Primary Care programs have increased approximately $84.4 million. Federal Funds in the programs have decreased $71.9 million. The Texas Women’s Health Pro gram is estimated to have avert ed 6,160 pregnancies in fiscal year 2013, resulting in a savings to the state of $72.0 million in All Funds, including $29.3 mil lion in General Revenue Funds. Although the Texas Women’s Health Program eligibility guidelines excludes some wom en who would be eligible for Medicaid coverage for a preg nancy, the DSHS family plan ning program eligibility level ensures that all women in Texas who would qualify for Medic aid, including Emergency Med icaid, if pregnant can receive pregnancy prevention services. This report would not have a fiscal impact for the 2016–17 biennium. It provides information regarding family planning services provided through the Women’s Health Program at the Texas Health and Human Services Commission (HHSC) and family planning services through the Texas Department of State Health Services (DSHS). Family planning programs provide low-income women in the U.S. with preventive health screening and contraceptive services. The federal and state governments have funded family planning services since the 1960s, both for their public health benefits and to help contain pregnancy-related Medicaid costs. The DSHS and HHSC family planning services include cervical and breast cancer screenings, and screenings for diabetes, hypertension, high cholesterol, and sexually transmitted infections. Clients are also offered counseling for a method of contraception, which may include abstinence; natural family planning; short-term prescriptions, such as contraceptive pills or injections; longer-term methods, such as intrauterine devices and subdermal implants; and options for permanent contraception. For all family planning spending in the HHSC Women’s Health Program and DSHS family planning program, the net change in General Revenue Funds between fiscal years 2010 and 2014 is an increase of approximately $34.4 million. An additional $50.0 million for each year of the 2014–15 biennium was allocated to women’s health services, which include but are not limited to family planning, in the DSHS Community Primary Care Services program. The net change in Federal Funds for family planning services at both HHSC and DSHS is a decrease of approximately $71.9 million. Fiscal year 2014 estimates of women served by the Texas Women’s Health Program are not available, but the DSHS family planning program projections for fiscal year 2014 are 56,879, a decrease from 211,980 clients for fiscal year 2010. The full text of this report can be found in the Texas State Government Effectiveness and Efficiency Report (Legislative Budget Board, January 2015), page 243. The introduced 2016–17 Gen eral Appropriations Bill does not include any adjustments as a result of this report. This report does not include any recommen dations. EXECUTIVE SUMMARY OF LEGISLATIVE BUDGET BOARD REPORTS – JANUARY 2015 – ID: 1935 43 HEALTHCARE REFORM, LEGISLATIVE PRIMER REPORT HIGHLIGHTS During the Affordable Care Act’s federal Marketplace’s first open enrollment period from October 1, 2013, to March 31, 2014, approximately 23.3 percent of the potential Mar ketplace population in Texas enrolled in a health insurance plan through the federal Mar ketplace. In September 2014, the state employee benefit systems (Em ployees Retirement System, Teacher Retirement System, University of Texas System and the Texas A&M System) identified the costs of the fol lowing three insurance market reforms to be $100.1 million in All Funds for fiscal year 2016: expansion of coverage to depen dent children up to age 26, cov erage of preventive care at 100 percent, and coverage of contra ceptives at 100 percent. This report would not have a fiscal impact for the 2016–17 biennium. It provides reference information on key provisions of the Affordable Care Act that affect the state. This report discusses key provisions of the Affordable Care Act (ACA) and its effects on state agencies and the state budget. The ACA affects the state through reforms in the insurance industry, expansion of health insurance coverage, and new investments in public health. Key provisions of the ACA that directly affect various state agencies, their employees, and the state budget include: • health insurance market reforms; • health insurance marketplaces and subsidies; • individual shared responsibility; • Pre-existing Condition Insurance Plan; • employer shared responsibility; • select ACA tax and fee provisions; • Medicaid and CHIP eligibility and payment changes; and • healthcare workforce capacity. Provisions of the law have varying effective dates, and changes continue to be made to the law by subsequent legislation and federal rules. The full text of this report can be found in Healthcare Reform, Legislative Primer (Legislative Budget Board, January 2015). Effective January 1, 2014, the ACA expanded Medicaid eligi bility to non-disabled children ages 6 to 19 years with family incomes from 100 to 133 per cent of the federal poverty level (FPL). The Health and Human Services Commission requested $93.7 million in General Rev enue Funds for the 2016–17 biennium for the cost of pro viding services to these newly eligible children in Medicaid. The introduced 2016–17 Gen eral Appropriations Bill does not include any adjustments as a result of this report. This report does not include any recommen dations. 44 EXECUTIVE SUMMARY OF LEGISLATIVE BUDGET BOARD REPORTS – JANUARY 2015 – ID: 1947 OVERVIEW OF THE TEXAS JUVENILE JUSTICE DEPARTMENT’S SECURE INSTITUTIONS AND PLACEMENT PROCESS LBB FACTS AND FINDINGS Responsibility for the Texas ju venile justice system is shared by the state and local govern ments. Counties provide pro bation services, and the state operates a system of five secure institutions, and owns another that is not operational. New commitments to TJJD de creased 70 percent from fiscal years 2006 to 2013. As of September 2014, TJJD had 1,174 permanent assign ment beds on-line. These are beds that are currently available to assign to youth. TJJD considers offense sever ity, youth risk level, proximity to home, and treatment needs when determining which insti tution is appropriate for a juve nile. As of September 2014, TJJD had secure institutions that are operational in four of the state’s seven juvenile probation de partment regions. This report would not have a fiscal impact for the 2016–17 biennium. It provides information on the condition and use of the Texas Juvenile Justice Department’s (TJJD) secure institutions and an overview of how the agency makes placement decisions. In Texas, the state and county governments share responsibility for the juvenile justice system. Before December 2011, the state portion of the juvenile justice system was operated by two separate state agencies. The Texas Juvenile Probation Commission (TJPC) administered grants to county probation departments, managed state data systems, and provided oversight and technical support. The Texas Youth Commission (TYC) operated a system of secure correctional facilities. The Eighty-second Legislature, Regular Session, 2011, passed legislation that abolished TYC and TJPC, and replaced them with TJJD. TJJD is now responsible for all of the functions for which TJPC and TYC were previously responsible. In 2007, the Texas Legislature began the process of reforming the state’s juvenile justice system. The Eightieth Legislature, Regular Session, 2007, mandated a 12:1 youth-to-staff ratio, prevented misdemeanants from being committed to the state’s care, amended the age limit of commitment-eligible youth to age 19, established consistent assessment of youth risk and needs at orientation, and made placing juvenile offenders close to home a priority. These policy changes significantly reduced the state’s juvenile correctional population, and as a result, the state has closed multiple facilities and redirected resources to county-based juvenile probation departments. Figure 1 shows the capacity in TJJD secure institutions by bed type. Legislative requirements; the quality, condition, number, and geographic distribution of facilities; and institutional capacity all influence how TJJD uses its secure institutional space to achieve its mission to create a safer Texas through the establishment of a continuum of services that promotes positive youth outcomes. This report is a summary of TJJD’s secure institutions and placement process. The full text of this report can be found in the Texas State Government Effectiveness and Efficiency Report (Legislative Budget Board, January 2015), page 253. The introduced 2016–17 Gen eral Appropriations Bill does not include any adjustments as a result of this report. This report does not include any recommen dations. EXECUTIVE SUMMARY OF LEGISLATIVE BUDGET BOARD REPORTS – JANUARY 2015 – ID: 1891 45 OVERVIEW OF THE TEXAS JUVENILE JUSTICE DEPARTMENT’S SECURE INSTITUTIONS AND PLACEMENT PROCESS FIGURE 1 TEXAS JUVENILE JUSTICE DEPARTMENT SECURE INSTITUTION CAPACITY, AUGUST 2014 INSTITUTION POPULATION Corsicana Residential Treatment Center PERMANENT ASSIGNMENT ON-LINE PERMANENT ASSIGNMENT SHORT-TERM OFF-LINE PERMANENT ASSIGNMENT LONG-TERM OFF-LINE PHYSICAL CAPACITY 0 0 149 0 170 Evins Regional Juvenile Center 129 136 28 12 209 Gainesville State School 244 288 0 56 396 Giddings State School 215 226 64 8 345 McLennan County State Juvenile Correctional Facility 253 312 48 112 555 Ron Jackson State Juvenile Facility 190 212 56 0 315 1,031 1,174 345 188 1,970 TOTAL NOTE: Physical capacity includes all on-line and off-line temporary and permanent assignment beds. Population reflects number of juveniles as of December 4, 2014. SOURCE: Legislative Budget Board. 46 EXECUTIVE SUMMARY OF LEGISLATIVE BUDGET BOARD REPORTS – JANUARY 2015 – ID: 1891 OVERVIEW OF TEXAS BORDER SECURITY FUNDING AND ACTIVITIES LBB FACTS AND FINDINGS Ports of entry along the TexasMexico border facilitate more than one-third of all trade that occurs between the U.S. and Mexico. Texas is the only state to have experienced an increase in apprehensions of persons crossing between ports of entry from federal fiscal years 2003 to 2013. Since fiscal year 2008, approximately $920.6 million in All Funds has been appropriated to state agencies for border security activities through the General Appropriations Act. For the 2014–15 biennium, about $467.9 million is appropriated for border security activities. The majority of these appropriations consisted of state funds; additional federal funds have been provided outside of sum-certain amounts appropriated by the Legislature. Border security funding primarily has been appropriated to the Texas Department of Public Safety in the General Appropriations Act during several biennia. Additional appropriations for border security have also been appropriated to other agencies that do not have strategies specifically related to border security in the General Appropriations Act. The introduced 2016–17 Gen eral Appropriations Bill does not include any adjustments as a result of this report. This report does not include any recommen dations. This report would not have a fiscal impact for the 2016–17 biennium. It examines state appropriations for border security-related activities and the implementation of related programs at the Texas Department of Public Safety (DPS), Texas Department of Parks and Wildlife (TPWD), Texas Department of Criminal Justice (TDCJ), Trusteed Programs Within the Office of the Governor (Governor’s Office), and Texas Military Department (TMD). The Texas-Mexico border spans 1,241 miles. More traffic that facilitates trade crosses this border than at any other point along the southern U.S. border. In addition to crossings that occur at designated ports of entry, illegal activity occurs between ports of entry. In response to this criminal activity, the Governor’s Office began providing grants, from discretionary funds, to increase law enforcement presence along the border during fiscal year 2006. This was the first state agency to direct funds to enhanced border security activities, and since this time, the agency has continued to make border security-related expenditures primarily in the form of grants to local law enforcement agencies to fund staff, purchase equipment, and prosecute criminals. The Legislature first appropriated state funds specifically for border security during fiscal year 2008. State funds are used to enhance ongoing operations and are in addition to funding provided for other activities related to regular law enforcement or homeland security. In addition to amounts included in the General Appropriations Act, state agencies may use Federal Funds that are paid directly to them by the federal government for border security activities. Border security funding primarily has been appropriated by the Legislature to DPS. DPS’s border security expenditures have included the purchase of equipment, pay for state trooper salaries and overtime, and capital projects such as the construction of command centers and crime labs. Some appropriations to the agency have been directed for grant funding provided to local entities and other state agencies. Funding also is appropriated to other agencies. TPWD has received appropriations for game warden salaries and overtime pay and equipment used during enhanced border security activities. TDCJ appropriations related to border security have been for staff salaries to assist in investigations and apprehensions related to transnational gang activity. TMD historically has not received direct appropriations for border security activities but rather has been funded by the federal government or through reimbursements provided by DPS. During fiscal year 2014, TMD began receiving funds to provide staff and equipment along the border to supplement other state agencies’ activities. Figure 1 shows total appropriations for border security since the 2008–09 biennium. This report provides an overview of funding appropriated by the Legislature for border security and a description of activities for which this funding is used. The full text of this report can be found in the Texas State Government Effectiveness and Efficiency Report (Legislative Budget Board, January 2015), page 269. EXECUTIVE SUMMARY OF LEGISLATIVE BUDGET BOARD REPORTS – JANUARY 2015 – ID: 1924 47 OVERVIEW OF TEXAS BORDER SECURITY FUNDING AND ACTIVITIES FIGURE 1 TOTAL STATE APPROPRIATIONS FOR BORDER SECURITY, 2008–09 TO 2014–15 BIENNIA TRUSTEED PROGRAMS WITHIN THE OFFICE OF THE GOVERNOR TEXAS DEPARTMENT OF CRIMINAL JUSTICE BIENNIUM TEXAS DEPARTMENT OF PUBLIC SAFETY TEXAS PARKS AND WILDLIFE DEPARTMENT 2008–09 $108.2 $2.1 $0.0 $0.0 $0.0 $110.3 2010–11 $102.1 $4.3 $13.3 $0.5 $0.0 $120.2 2012–13 $212.9 $4.7 $4.0 $0.5 $0.0 $222.2 2014–15 $401.6 $9.0 $6.8 $0.5 $50.0 $467.9 TOTAL $824.8 $20.1 $24.1 $1.5 $50.0 $920.6 TEXAS MILITARY DEPARTMENT TOTAL NOTES: (1) Amounts shown in millions. Amounts show border security funding based on legislative intent and with input from agencies regarding their definitions of border security activities. (2) The Texas Military Department (TMD) has not received direct appropriations for border security through the General Appropriations Act. In fiscal year 2014, the Governor used authority provided in the Texas Government Code and General Appropriations Act to access General Revenue-Dedicated account balances which were provided to the Texas Department of Public Safety (DPS) for transfer to TMD. In addition, since fiscal year 2008, DPS has provided funds to TMD at their discretion which are included in totals for DPS. (3) In December 2015, the Legislative Budget Board approved a proposal by the Office of the Governor for budget execution to provide additional funds for border security. As a result, the following amounts, which are included in this figure, were transferred from appropriations made to other agencies for fiscal year 2015 to these agencies: DPS—$64.9 million; the Texas Parks and Wildlife Department—$3.7 million; and TMD—$17.5 million. Amounts transferred from Trusteed Programs Within the Office of the Governor are included in amounts shown only for the agency that received the funds. SOURCE: Legislative Budget Board. 48 EXECUTIVE SUMMARY OF LEGISLATIVE BUDGET BOARD REPORTS – JANUARY 2015 – ID: 1924 IMPROVE TRANSPARENCY, COORDINATION, AND OVERSIGHT OF STATE BORDER SECURITY ACTIVITIES LBB RECOMMENDATIONS 1 Include a rider to require certain information, including outcomes, on border security to be reported to the Legislative Budget Board using specified criteria. 2 Amend statute to reconstitute the Border Security Council as a special advisory council of the Homeland Security Council and require the Homeland Security Council’s annual report to include an assessment of the performance, reporting, and funding amounts for the state’s border security activities that is made available on the Office of the Governor’s website. The introduced 2016–17 Gener al Appropriations Bill includes a rider implementing Recommen dation 1. Recommendation 2 re quires a statutory change. These recommendations would not have a fiscal impact for the 2016–17 biennium. They would ensure the Legislature has consistent information about the impact of state funding for border security and would help to increase oversight of state-funded border security programs. Texas began appropriating funds to supplement federal border security efforts during fiscal year 2006. Since that time, All Funds appropriations for border security operations have more than tripled. In addition to amounts included in the General Appropriations Act, state agencies may use Federal Funds they receive directly from the federal government for border security activities. Border security appropriations have been challenging to track because they are distributed across agencies and strategies. Additionally, no common definition of border security is used to track these funds throughout the budget. Although Texas has no legally established definition of border security, at least three definitions delineate the border region in statute. Additional geographic boundaries are set in statute that apply to specific border-related programs; none of these programs are associated with border security activities. The Texas Department of Public Safety (DPS) previously has designated all of Texas as a border zone and considered funding any items that increased the agency’s general capacity to also indirectly increase border security efforts. Other agencies have limited designation of the border region to smaller geographic areas, and recently DPS has as well. The lack of consistent reporting on border security inhibits tracking of border securityrelated expenditures and activities across agencies and biennia, and the ability to distinguish border security activities from other functions of homeland security, which are funded separately. Without such reporting, including outcomes, the state may not be able to evaluate the strategic value of the allocation of border security resources. Despite the participation of multiple state agencies in border security operations, no formal requirement is in place to ensure cross-agency collaboration or to track the state’s progress across agencies toward achieving a more secure border. The Border Security Council is statutorily required to recommend performance measures, reporting requirements, and the allocation of funds for border security by the Office of the Governor. The Homeland Security Council is required to annually report to the Governor regarding the status of funding state programs for homeland security, recommendations to reduce homeland security threats, and the improvement of agency activities. Neither the Border Security Council nor the Homeland Security Council are required to make recommendations regarding performance standards, reporting requirements, or the allocation of funds for border security that are appropriated to the entities that receive most state appropriations for this function. Additionally, performance measures linked directly to state border security activities previously have not been developed or used in a way that sufficiently allows the monitoring of state spending. EXECUTIVE SUMMARY OF LEGISLATIVE BUDGET BOARD REPORTS – JANUARY 2015 – ID: 1890 49 IMPROVE TRANSPARENCY, COORDINATION,AND OVERSIGHT OF STATE BORDER ACTIVITIES Consistent reporting on border security and modifying requirements of the Texas Border Security Council would ensure coordination among agencies, improve transparency, and enhance oversight of the state’s efforts and progress toward securing the border with Mexico. The full text of this report can be found in the Texas State Government Effectiveness and Efficiency Report (Legislative Budget Board, January 2015), page 289. 50 EXECUTIVE SUMMARY OF LEGISLATIVE BUDGET BOARD REPORTS – JANUARY 2015 – ID: 1890 DEVELOP PLANS TO ADOPT INCIDENT-BASED CRIME REPORTING IN TEXAS LBB RECOMMENDATIONS 1 Amend statute to require DPS to develop a plan for implementing or expanding statewide incident-based crime reporting. The plan should include input from stakeholders and be provided to the Governor, the LBB, and the appropriate standing committees of the Legislature by September 1, 2016. 2 Appropriate $5.0 million in General Revenue–Dedicated Funds to DPS and include a rider directing the agency to provide grants to law enforcement agencies for upgrading technology infrastructure to implement incident-based crime reporting. 3 Amend statute to expand the allowable uses of the Texas Commission on Law Enforcement Account to include grants administered by DPS for training on incident-based crime reporting. 4 Include a contingency rider to appropriate $300,000 in General Revenue–Dedicated Funds to DPS and direct the funds to be used to provide grants for training law enforcement on incident-based crime reporting. (LBB Recommendations tinued on next page) con These recommendations would cost $5.3 million in General Revenue– Dedicated Funds for the 2016–17 biennium. These recommendations would increase incident-based crime reporting in Texas to improve public safety and transparency. In Texas, many local law enforcement agencies voluntarily report crime data to the Texas Department of Public Safety (DPS), which reports the data to the Federal Bureau of Investigation (FBI). The FBI administers a Uniform Crime Reporting (UCR) Program using data reported from states. Nearly 100 percent of Texas’ population is represented by UCR data. Since its inception in 1930, the UCR Program has used summary-based data for up to 10 crimes and arrest-only data for several other crimes. In a summary-based reporting system, certain data regarding the crimes are counted and aggregated. The offenses covered by the UCR summary reporting system are limited and do not include many modern crimes of interest to law enforcement and the public, such as drug offenses and kidnapping. In the 1980s, the law enforcement community developed an incident-based reporting system to collect more data on more kinds of crimes. Instead of summarizing and aggregating data, the incident-based system collects data on individual incidents. It includes more than 50 data elements on 49 crimes, as well as arrest-only data for more crimes. The UCR Program’s incidentbased reporting system is called the National Incident-Based Reporting System (NIBRS). Law enforcement officials report that incident-based crime data allows law enforcement agencies and other interested parties to identify crime trends and atrisk populations. Prevention strategies can be developed, evaluated, and modified with incident-based evidence that is not included in summary reports. Despite the benefits of incident-based reporting, most law enforcement agencies in Texas do not report incident-based data to DPS. Only 59 of the more than 1,000 Texas law enforcement agencies that submit data for the UCR program use incident-based reporting. Agencies may not report incident-based data because of cost, required changes in practice, or misunderstandings about the differences between summary- and incident-based data. No independent readiness assessment has been conducted among Texas agencies to determine the feasibility of expanding incident-based crime reporting across the state to provide more comprehensive data. State resources provided to entities for submitting crime reports do not incentivize or address barriers to incident-based reporting. Providing resources to address these obstacles would help more Texas agencies adopt and realize the benefits of incident-based crime reporting. Increasing the availability of incident-based data would allow DPS, other law enforcement agencies, and stakeholders to better identify crime trends and develop enhanced prevention strategies. EXECUTIVE SUMMARY OF LEGISLATIVE BUDGET BOARD REPORTS – JANUARY 2015 – ID: 1927 51 DEVELOP PLANS TO ADOPT INCIDENT-BASED CRIME REPORTING IN TEXAS LBB RECOMMENDATIONS (CONTINUED) FIGURE 1 FIVE-YEAR FISCAL IMPACT, FISCAL YEARS 2016 TO 2020 5 YEAR PROBABLE SAVINGS/(COST) IN GENERAL REVENUE–DEDICATED FUNDS 2016 ($2,669,174) 2017 ($2,669,174) 2018 ($2,669,174) 2019 ($2,669,174) 2020 ($2,669,174) Amend statute to require DPS to publish a summary of incident-based crime reporting data regularly on its website. The introduced 2016–17 Gen eral Appropriations Bill includes appropriations and riders imple menting Recommendations 2 and 4. Recommendations 1, 3, and 5 require statutory changes. 52 SOURCE: Legislative Budget Board. The full text of this report can be found in the Texas State Government Effectiveness and Efficiency Report (Legislative Budget Board, January 2015), page 297. EXECUTIVE SUMMARY OF LEGISLATIVE BUDGET BOARD REPORTS – JANUARY 2015 – ID: 1927 IMPROVE DRIVER RESPONSIBILITY PROGRAM COMPLIANCE AND PROMOTE GOOD DRIVING BEHAVIOR LBB RECOMMENDATIONS 1 Include a rider directing DPS to improve DRP outreach by: (1) including a DRP statement in TexasSure letters, driver license renewal notices, and on websites that allow for electronic payment of DRP surcharges; and (2) developing information regarding DRP that can be incorporated into peace officer training curricula. 2 Amend statute to intercept state lottery winnings and unclaimed property proceeds of individuals with outstanding DRP surcharges. 3 Amend statute to reduce the amount of DRP surcharges for offenses of no insurance or no license by 50 percent if drivers comply with applicable insurance and driver license laws. The introduced 2016–17 Gen eral Appropriations Bill includes a rider to implement Recommen dation 1. Recommendations 2 and 3 require statutory changes. These recommendations would result in a fiscal impact to General Revenue Funds and the Designated Trauma Facility and EMS Account 5111 (General Revenue–Dedicated Funds); however, the net fiscal impact cannot be determined. The recommendations would increase compliance, incentivize good driving behavior, and minimize negative consequences associated with the Driver Responsibility Program (DRP). The DRP, which began on September 1, 2003, is administered by the Texas Department of Public Safety (DPS). In accordance with the program, surcharges are levied on persons convicted of certain driving offenses to both enhance public safety and shift some accident-related costs in the form of uncompensated trauma care from the general population. As of the end of fiscal year 2014, more than $3.6 billion in DRP surcharges had been billed since the program’s inception, but only 51 percent of these surcharges have been collected ($1.4 billion). The majority of the 49 percent of uncollected surcharges represent amounts owed by people who are not in compliance with the program. Figure 1 shows the compliance rates for all DRP surcharge categories for fiscal year 2014. The Legislature has modified provisions of the DRP to improve compliance; however, there continues to be a high rate of noncompliance. Activities such as informing potential violators about the DRP, imposing additional consequences for nonpayment of surcharges, and incentivizing good driving behavior have been limited. These recommendations would expand these types of activities to increase DRP compliance and improve driving behavior. FIGURE 1 TEXAS DRIVER RESPONSIBILITY PROGRAM COMPLIANCE RATES FISCAL YEAR 2014 OFFENSE COMPLIANCE Driving While License Invalid 18.4% Driving Without a License 19.0% No Insurance 22.9% Driving While Intoxicated 37.3% Points 60.6% SOURCE: Legislative Budget Board. The full text of this report can be found in the Texas State Government Effectiveness and Efficiency Report (Legislative Budget Board, January 2015), page 306. EXECUTIVE SUMMARY OF LEGISLATIVE BUDGET BOARD REPORTS – JANUARY 2015 – ID: 1983 53 IMPROVE PUBLIC SAFETY BY AUTHORIZING ALL COUNTIES TO ADOPT FIRE CODES LBB RECOMMENDATION 1 Amend statute to authorize, but not require, the commissioners courts of all counties to adopt fire codes. The introduced 2016–17 Gen eral Appropriations Bill does not include any adjustments as a result of this recommendation. Recommendation 1 requires a statutory change. This recommendation would not have a fiscal impact for the 2016–17 biennium. It would minimize the risk of fires and negative consequences associated with fires such as injury, death, and property damage by authorizing all counties to adopt fire codes. Approximately two-thirds of counties are not authorized to adopt fire codes. U.S. fire statistics during the last 30 years show a decrease in fire-related injuries, deaths, and property damage. From 1985 to 1994, fires caused an annual average of 29,000 injuries, 5,300 deaths, and more than $15 billion in property damage. By 2011, average annual casualties dropped by half, and property damage decreased by $4 billion. Authorities attribute the decrease in part to advances in fire codes, fire education, and construction. In 2013, local jurisdictions in Texas reported to the State Fire Marshal’s Office more than 71,000 fires that caused 866 civilian injuries, 167 deaths, and approximately $622 million in property damage. To improve public safety, all states except Texas and Missouri have adopted statewide fire codes. A fire code prescribes requirements intended to provide a reasonable level of safety and property protection from risks associated with fire, explosions, and other hazards. Codes include standards for building design, construction, maintenance, and occupation. Adoption and enforcement of fire codes has been shown to result in lower insurance rates and fewer fires, and to reduce the loss of life and property when fires occur. Emergency service districts and all municipalities in Texas are authorized to adopt fire codes. However, despite the documented public safety benefits of codes, most counties in Texas are unable to adopt and enforce fire codes to protect public safety. Two-thirds of Texas counties are not authorized to adopt a fire code because state law limits this authority only to counties of a certain size or location. These counties lack a tool that municipalities, emergency service districts, and other counties have to protect public safety. With authorization to adopt fire codes, counties could provide oversight, collaborate with stakeholders, and impose penalties related to fire code violations. Additionally, property owners could realize savings from lower insurance rates through codes and their enforcement. The full text of this report can be found in the Texas State Government Effectiveness and Efficiency Report (Legislative Budget Board, January 2015), page 312. 54 EXECUTIVE SUMMARY OF LEGISLATIVE BUDGET BOARD REPORTS – JANUARY 2015 – ID: 1918 EXPAND THE MARKET TO WHICH TEXAS CORRECTIONAL INDUSTRIES CAN SELL GOODS AND SERVICES LBB RECOMMENDATIONS 1 Amend statute to authorize TCI to sell goods and services to and contract with private prison vendors with whom TDCJ contracts, except in instances in which Texas-based businesses are already selling similar goods or services to a private prison vendor. 2 Amend statute to authorize TCI to sell goods and services to current and retired state employees. The introduced 2016–17 Gen eral Appropriations Bill does not include any adjustments as a re sult of these recommendations. These recommendations require statutory changes. These recommendations would not have a significant net fiscal impact for the 2016–17 biennium. If Texas Correctional Industries’ (TCI) sales grow as a result of these recommendations, the Legislature subsequently could reduce the amount of General Revenue Funds appropriated for the program. The recommendations would authorize TCI to expand its market so that it could better meet its statutory goals of providing offenders with marketable job skills to help reduce recidivism and reduce the Texas Department of Criminal Justice’s (TDCJ) costs. TCI, a department within TDCJ, is charged with two objectives: provide offenders with marketable job skills to help reduce recidivism, and reduce the agency’s costs. To achieve these objectives, programs within TCI train and employ approximately 5,000 incarcerated offenders to manufacture goods and perform services to sell to governmental entities. According to TDCJ, the longer that these offenders work in these TCI programs prior to release, the less likely they are to recidivate. Offenders who work in TCI can gain skills such as welding, braille transcription, and woodworking. Offenders also learn soft skills such as a work ethic, positive attitude, and interpersonal skills. Commonly sold goods made by TCI include uniforms, soap products, road signs, and license plates. Pursuant to current law, TCI generally may sell goods and services only to certain governmental entities. It may not sell goods or services on the open market to private businesses, including private prison vendors that contract with TDCJ. Additionally, TCI may not sell goods to current or retired state employees. These statutory restrictions impede TCI programs from achieving their potential. It is common for correctional industries programs in other states to sell goods and services to private businesses that contract with a state and state employees. Lifting restrictions on selling to private prison vendors and current and retired state employees would provide TCI with additional opportunities to meet its objectives. TCI could realize additional annual sales revenue of more than $2.9 million in General Revenue Funds. These funds would be appropriated to TDCJ to cover the cost of goods and services sold, resulting in an offsetting cost of $2.9 million in General Revenue Funds. In the long term, selling to new markets would allow TCI to generate more revenue, thereby making funding available for other uses. FIGURE 1 FIVE-YEAR FISCAL IMPACT, FISCAL YEARS 2016 TO 2020 YEAR PROBABLE GAIN/(LOSS) TO GENERAL REVENUE FUNDS PROBABLE SAVINGS/(COST) TO GENERAL REVENUE FUNDS 2016 $0 $0 2017 $2,958,298 ($2,958,298) 2018 $2,958,298 ($2,958,298) 2019 $2,958,298 ($2,958,298) 2020 $2,958,298 ($2,958,298) SOURCE: Legislative Budget Board. The full text of this report can be found in the Texas State Government Effectiveness and Efficiency Report (Legislative Budget Board, January 2015), page 317. EXECUTIVE SUMMARY OF LEGISLATIVE BUDGET BOARD REPORTS – JANUARY 2015 – ID: 1900 55 OVERVIEW OF ESTIMATED NET COSTS OF TECHNICAL REVOCATIONS FROM PAROLE LBB FACTS AND FINDINGS In 2013, there were 5,850 revo cations from parole. Approxi mately 6.7 percent of parole revocations were the result of technical revocations. Gross state costs that could have been saved had all 2007 parole technical revocations remained in the community were $27.4 million during a five-year period. Actual budget savings would depend on changes in prison utilization during this time. Estimated direct costs due to technical revocations are $2.9 million in state costs and $2.1 million in local costs would have been generated. In addition to these direct costs, $12.6 million in victimization costs would have been generated. For every $1.00 spent by the state to incarcerate someone who violated the conditions of their parole, 56.0 cents of victimization could have been avoided. The necessary data to conduct a similar estimation for probation revocations is not yet available. This report would not have a fiscal impact for the 2016–17 biennium. The report compares the total cost, both direct and indirect, of revoking a technical violator of parole conditions to prison to the cost of the offense remaining in the community. Texas has the largest population of state-incarcerated offenders in the country and houses more than 150,000 felons. Some individuals convicted of felonies may not serve all of their sentence incarcerated in a prison or state jail and may instead be supervised in the community. This supervision occurs either through probation, which occurs instead of incarceration, or parole, which occurs after incarceration. This period of supervision in the community may be revoked if the convicted felon commits a new offense or fails to comply with the technical terms of the supervision, such as failing to meet with a parole officer. This second type of revocation is called a technical revocation. Incarceration costs over 9 times as much as community supervision. Therefore, revoking a parole violator to prison increases state costs. Balanced against this cost, however, are the costs to the state, local governments, and victims for crimes these individuals may commit if they were not incarcerated. Legislative Budget Board (LBB) staff developed an estimate of the net fiscal impact that would have occurred for a single-year cohort of technical revocations. To determine these costs, LBB staff used an econometric simulation model from the Pew-MacArthur Results First Initiative. The full text of this report can be found in the Texas State Government Effectiveness and Efficiency Report (Legislative Budget Board, January 2015), page 322. The introduced 2016–17 Gen eral Appropriations Bill does not include any adjustments as a result of this report. This report does not include any recommen dations. 56 EXECUTIVE SUMMARY OF LEGISLATIVE BUDGET BOARD REPORTS – JANUARY 2015 – ID: 1919 ADULT AND JUVENILE CORRECTIONAL POPULATION PROJECTIONS, FISCAL YEARS 2015 TO 2020 REPORT HIGHLIGHT This report provides long-term adult and juvenile population projections for incarceration and supervision populations, crime and arrest rates in Texas, and related findings from focus groups with adult and juvenile criminal justice practitioners and officials. The introduced 2016–17 Gen eral Appropriations Bill does not include any adjustments as a result of this report. This report does not include any recommen dations. This report would not have a fiscal impact for the 2016–17 biennium. It provides adult and juvenile population projections to inform biennial funding determinations. This report provides adult and juvenile correctional population projections for fiscal years 2015 through 2020, which serve as a basis for biennial funding determinations for the Texas Department of Criminal Justice and the Texas Juvenile Justice Department. Most projections utilize a discrete-event simulation modeling approach that simulates an individual’s movement into, through, and out of the justice system, based on factors such as offense type, sentence length, and time credited to the current sentence. Projections are based on historical data through fiscal year 2014. The report also includes findings from focus groups with practitioners, clients, and officials in various parts of the adult criminal and juvenile justice systems to obtain a more in-depth understanding of factors affecting adult criminal and juvenile justice populations. The full text of this report can be found in Adult and Juvenile Correctional Population Projections, Fiscal Years 2015 to 2020 (Legislative Budget Board, January 2015). EXECUTIVE SUMMARY OF LEGISLATIVE BUDGET BOARD REPORTS – JANUARY 2015 – ID: 1958 57 58 EXECUTIVE SUMMARY OF LEGISLATIVE BUDGET BOARD REPORTS – JANUARY 2015 IMPROVE AVAILABLE INFORMATION ON BRACKISH GROUNDWATER FOR WATER PLANNING LBB RECOMMENDATIONS 1 Amend statute to require the Texas Groundwater Protection Committee to adopt a standardized groundwater classification system through rulemaking, and require state agencies and groundwater conservation districts to reference this system. 2 Amend statute to require the Railroad Commission of Texas to annually provide electronic well log data to the Texas Water Development Board. 3 These recommendations would not have a fiscal impact for the 2016–17 biennium. They would improve the ability of the state and local water supply interests to coordinate and identify available treatable groundwater resources. The availability of fresh water in Texas is projected to diminish in the coming decades. Water providers are looking for alternative supplies to meet demand. One potential alternative is brackish groundwater, water that has a higher content of salinity and other substances than fresh water. Texas’ water resources are estimated to include approximately 5.4 billion acre feet of fresh groundwater and 2.7 billion acre feet of brackish groundwater. Through desalination, brackish supplies can be converted to a potable drinking source. The 2012 State Water Plan projects that the desalination of brackish groundwater for drinking purposes will increase more than 200 percent by 2060; however, the term brackish groundwater is not defined in state law. Variations in what constitute brackish or treatable water may affect the uniformity of how this resource is referenced, regulated, or permitted by state agencies, groundwater conservation districts, and other involved parties. Amend statute to require the Texas Water Development Board to adopt standards and methodologies to ensure that groundwater conservation districts are using a standardized approach when formulating their individual or shared desired future conditions. In some cases, fresh groundwater sources may be hydrologically connected to brackish groundwater sources. By withdrawing significant volumes of brackish groundwater from an aquifer, the quality and quantity of fresh water in that formation may also be affected. Because these connections are not well-defined, additional data is necessary to ascertain opportunities for and the effects of increased brackish groundwater withdrawals. More definitive information on the nature of these relationships would improve groundwater conservation districts’ ability to adopt unique desired future conditions for portions of an aquifer within their jurisdiction. The introduced 2016–17 Gen eral Appropriations Bill does not include any adjustments as a re sult of these recommendations. These recommendations require statutory changes. The full text of this report can be found in the Texas State Government Effectiveness and Efficiency Report (Legislative Budget Board, January 2015), page 329. EXECUTIVE SUMMARY OF LEGISLATIVE BUDGET BOARD REPORTS – JANUARY 2015 – ID: 1886 59 IMPROVE STATE AND LOCAL DROUGHT PLANNING TO MORE EFFECTIVELY MANAGE WATER RESOURCES LBB RECOMMENDATIONS 1 Amend statute to require entities that are required to notify TCEQ about their drought contingency plan implementation to also notify the agency when they alter or lift drought restrictions. 2 Amend statute to require TCEQ to post certain information on its website related to the condition of drought a public water supplier is undergoing and actions the supplier is taking to mitigate reduced water supplies. 3 Amend statute to expand the powers and duties of the state’s Water Conservation Advisory Council to include the monitoring and development of strategies that address drought conditions, and to assist the Texas Water Development Board and TCEQ with the development of best management practices for drought. These recommendations would not have a fiscal impact for the 2016–17 biennium, but they would allow for improved state oversight and more effective local planning to address drought conditions. In 2011, Texas experienced the worst documented single-year drought on record. According to the Texas A&M AgriLife Extension Service, the estimated economic loss to agriculture attributed to the drought in calendar year 2011 was approximately $7.6 billion. Rainfall since that year has helped improve conditions, but as of August 2014, approximately 40 percent of Texas still was considered in severe drought by the U.S. Drought Monitor. State involvement in drought planning and response, outside of ensuring that senior water-right priority calls are honored, consists primarily of requiring that water suppliers complete and submit drought contingency plans every five years. The Texas Commission on Environmental Quality (TCEQ) sets requirements for what these plans should include, such as: provisions for public education; criteria for initiation and termination of drought stages; and specific, quantified targets for water use reductions. Water suppliers are statutorily required to implement drought contingency plans upon issuance of a Texas Governor’s Emergency Disaster Proclamation for Drought. Local governments’ lack of consistency in reporting their responses to drought impedes the state’s evaluation of how effectively water suppliers are managing reduced water supply conditions. Local entities would benefit from the development of best management practices regarding how to manage water resources most effectively during periods of short supply. The full text of this report can be found in the Texas State Government Effectiveness and Efficiency Report (Legislative Budget Board, January 2015), page 336. 4 Amend statute to require entities that complete drought contingency plans to include detailed information regarding prior drought response and the effectiveness of those measures in additional iterations of their plans. The introduced 2016–17 Gen eral Appropriations Bill does not include any adjustments as a re sult of these recommendations. These recommendations require statutory changes. 60 EXECUTIVE SUMMARY OF LEGISLATIVE BUDGET BOARD REPORTS – JANUARY 2015 – ID: 1894 REVENUE ENHANCEMENT OPTIONS FOR THE WATER RESOURCE MANAGEMENT ACCOUNT LBB RECOMMENDATIONS 1 Include a rider specifying that appropriations to TCEQ, PUC, and OPUC are contingent on balances and available revenues to the Water Resource Management Account being sufficient to cover appropriations from the account for the 2016–17 biennium. The rider also would direct TCEQ to increase fee rates based on an evaluation that TCEQ would conduct pursuant to Recommendation 3, if that recommendation is implemented. 2 Amend statute to redirect some of the fee revenues from the WURA to the General Revenue Fund in an amount necessary to cover appropriations and related employee benefits costs at the PUC and OPUC. 3 Direct TCEQ to conduct a study to determine the level of agency workload related to each group of fee payers and the relative benefit each fee payer group receives from agency water -related activities. Using this analysis, the agency should develop a methodology to determine the appropriate fee rates for water-related fees, which would generate revenue in proportion to agency workload and fee payer benefits. The introduced 2016–17 Gen eral Appropriations Bill includes a rider implementing portions of these recommendations. Some of the recommendations require statutory changes. These recommendations would result in an estimated revenue gain of $4.8 million from increased fees by the Texas Commission on Environmental Quality (TCEQ) to a level that would cover appropriations from the Water Resource Management Account No. 153 (General Revenue–Dedicated Fund) for the 2016–17 biennium. In addition, the recommendations would move fee revenues to support the Public Utility Commission of Texas (PUC) and the Texas Office of Public Utility Counsel (OPUC) to the General Revenue Fund. The recommendations also would direct TCEQ to conduct a study regarding water-related fees. A significant portion of state funding for TCEQ’s water programs are funded out of the Water Resource Management Account No. 153 (General Revenue–Dedicated Fund). In addition, the PUC and the OPUC began receiving funding out of the Water Resource Management Account during the 2014–15 biennium as a result of the enactment of House Bill 1600, Eighty-third Legislature, Regular Session, 2013, which transferred water and wastewater utility rate regulation responsibilities from TCEQ to the PUC. However, revenue in the account is not expected to be sufficient to maintain 2014–15 biennial spending levels in the 2016–17 biennium and subsequent years. Recommended appropriations for TCEQ from the Water Resource Management Account total $112.0 million for the 2016–17 biennium, with estimated employeerelated benefits at $17.6 million. PUC and OPUC have requested $3.2 million and $1.0 million, respectively from the Water Resource Management Account. Thus, the total amount being requested by the three agencies combined is an estimated $133.8 million for the 2016–17 biennium. TCEQ estimates that revenues for the 2016–17 biennium will total $128.9 million, leaving an estimated difference of $4.9 million between revenues and expenditures. Combined with an estimated fund balance of $0.2 million at the end of fiscal year 2015, the total shortfall for the Water Resource Management Account is expected to reach $4.8 million by the end of fiscal year 2017. Multiple options are available to increase revenues to the Water Resources Management Account No. 153 and help ensure that the account has sufficient funds to cover the current level of appropriation if the Legislature does not choose to provide General Revenue Funds to TCEQ for water program funding in place of Water Resource Management Account No. 153 funding. This report examines the relation between fee payer groups and the use of fees deposited to the account, and considers options associated with the three largest fees deposited to the account: the Consolidated Water Quality Fee, the Public Health Service Fee and the Water Utility Regulatory Assessment (WURA). The full text of this report can be found in the Texas State Government Effectiveness and Efficiency Report (Legislative Budget Board, January 2015), page 342. EXECUTIVE SUMMARY OF LEGISLATIVE BUDGET BOARD REPORTS – JANUARY 2015 – ID: 1971 61 REVENUE ENHANCEMENT OPTIONS FOR THE WATER RESOURCE MANAGEMENT ACCOUNT FIGURE 1 FIVE-YEAR FISCAL IMPACT OF RECOMMENDATION 1, FISCAL YEARS 2016 TO 2020 YEAR PROBABLE SAVINGS/(COST) IN GENERAL REVENUE–DEDICATED ACCOUNT 153 PROBABLE REVENUE GAIN/(LOSS) IN GENERAL REVENUE–DEDICATED ACCOUNT 153 2016 ($2,400,000) $2,400,000 2017 ($2,400,000) $2,400,000 2018 ($2,400,000) $2,400,000 2019 ($2,400,000) $2,400,000 2020 ($2,400,000) $2,400,000 SOURCE: Legislative Budget Board. FIGURE 2 FIVE-YEAR FISCAL IMPACT OF RECOMMENDATION 2, FISCAL YEARS 2016 TO 2020 YEAR PROBABLE SAVINGS/ (COST) IN GENERAL REVENUE FUNDS PROBABLE REVENUE GAIN/(LOSS) IN GENERAL REVENUE FUNDS PROBABLE SAVINGS/ (COST) IN GENERAL REVENUE–DEDICATED ACCOUNT 153 PROBABLE REVENUE GAIN/(LOSS) IN GENERAL REVENUE–DEDICATED ACCOUNT 153 2016 ($2,600,000) $2,600,000 $2,600,000 ($2,600,000) 2017 ($2,600,000) $2,600,000 $2,600,000 ($2,600,000) 2018 ($2,600,000) $2,600,000 $2,600,000 ($2,600,000) 2019 ($2,600,000) $2,600,000 $2,600,000 ($2,600,000) 2020 ($2,600,000) $2,600,000 $2,600,000 ($2,600,000) SOURCE: Legislative Budget Board. Completing the study required by Recommendation 3 would have no significant fiscal impact and could be done within existing TCEQ resources. If TCEQ and/or the Legislature were to implement any of the six options identified to generate additional revenue for the Water Resource Management Account No. 153, there would be a gain in General Revenue–Dedicated Funds. The amount of the gain would vary depending on which option(s) was(were) implemented and would range from $2.3 million to $19.5 million annually. 62 EXECUTIVE SUMMARY OF LEGISLATIVE BUDGET BOARD REPORTS – JANUARY 2015 – ID: 1971 OVERVIEW OF RESPONSIBILITIES AND STATE OVERSIGHT OF RIVER AUTHORITIES LBB FACTS AND FINDINGS TCEQ has statutory authority to supervise most activities of river authorities. From the agency’s perspective, there are no gaps in state oversight of river authorities. The board of directors for a river authority is typically appointed by the Governor, with the advice and consent of the Senate. River authority boards range from 5 to 25 members, with approximately 11 members on average. Four of 17 river authorities are permitted the majority of water in their designated basins. Some river authorities are not directly permitted any surface water. TCEQ is the state’s water oversight agency for surface water regulation, including the permitting and usage of water. The agency may also establish a watermaster program in areas of the state where concerns regarding proper water usage may arise. This report would not have a fiscal impact for the 2016–17 biennium. It provides information on the purpose, powers, and duties of river authorities, and various mechanisms of state oversight for these entities. In 1917, Texas voters adopted a constitutional amendment to allow for the establishment of conservation and reclamation districts. At the time, flooding was of greater concern than drought, and local governments were limited in their ability to issue bonds for large, long-term projects such as reservoir construction. Certain districts established through this authorization are now known as river authorities, and their primary purposes are to conserve the state’s water resources and provide water-related services, such as wholesale or retail water service. A river authority’s boundaries typically span multiple counties, and they are governed by a board of directors appointed by the Governor. River authorities are considered governmental agencies and bodies politic and corporate. According to the Texas Commission on Environmental Quality (TCEQ), there are 17 river authorities in Texas, all formed to address challenges unique to their river basins. As is the case for other water providers, state oversight for river authorities includes water rights permitting, water usage reports, and overseeing development of water conservation plans and drought contingency plans. River authorities also submit financial and management audits to TCEQ and are subject to ongoing general supervision by the agency. Additional state oversight varies depending on the activities the particular authority engages in and would apply to any other type of entity engaging in that activity. The full text of this report can be found in the Texas State Government Effectiveness and Efficiency Report (Legislative Budget Board, January 2015), page 351. The introduced 2016–17 Gen eral Appropriations Bill does not include any adjustments as a result of this report. This report does not include any recommen dations. EXECUTIVE SUMMARY OF LEGISLATIVE BUDGET BOARD REPORTS – JANUARY 2015 – ID: 1895 63 OVERVIEW OF FUNDING AND MAINTENANCE NEEDS FOR THE TEXAS STATE PARK SYSTEM LBB FACTS AND FINDINGS Expenditures of All Funds for state park operations fluctuated from $78.2 million to $65.3 million to $84.5 million for fiscal years 2010, 2012, and 2014, respectively. General Revenue Funds provided $57.9 million, or 68.6 percent, of total funding for state park system operations for fiscal year 2014. Funding from the Sporting Goods Sales Tax accounted for 69.5 percent of that amount. To maximize park revenue while also promoting park visitation, TPWD conducts an annual fee modification process. During the process, state park staff analyzes their competition, visitor satisfaction, peak visitation trends, and cost recovery for high-cost amenities. This report would not have a fiscal impact for the 2016–17 biennium. It examines revenue used to fund state parks generated from park fees and the Sporting Goods Sales Tax, and funding for minor and major repairs. The Texas Parks and Wildlife Department (TPWD) manages a state park system that includes 95 parks, natural areas, and historic sites covering about 630,400 acres. The State Parks Division, the agency’s largest, allocated funding for 1,317 full-time equivalent positions to manage the state park system for fiscal year 2014. The state park system does not generate enough revenue to fully support its operations. As a result, a mix of sources fund state park operations, maintenance, and support functions. The Sporting Goods Sales Tax and revenue from state park fees are the system’s two major funding sources. Each has been used in varying degrees to fund state park operations. Fee revenue increased faster than the amount available from the Sporting Goods Sales Tax for state parks from fiscal years 2010 to 2014. The agency conducts annual fee reviews to maximize state park revenue and promote visitor satisfaction. To maintain safe facilities that allow visitors to enjoy state parks, TPWD allocates funding for capital repair projects based on a comprehensive prioritization process. The full text of this report can be found in the Texas State Government Effectiveness and Efficiency Report (Legislative Budget Board, January 2015), page 361. TPWD is requesting an additional $51.0 million for certain state park-related capital projects for the 2016–17 biennium. Of this amount, 56.4 percent is proposed to fund state park repairs that address health and safety and deferred maintenance concerns. The introduced 2016–17 Gen eral Appropriations Bill does not include any adjustments as a result of this report. This report does not include any recommen dations. 64 EXECUTIVE SUMMARY OF LEGISLATIVE BUDGET BOARD REPORTS – JANUARY 2015 – ID: 1896 MANAGEMENT REVIEW OF THE BRAZOS RIVER AUTHORITY LBB RECOMMENDATIONS 1 Merge the strategic plan and long-range financial plan to ensure coordination and provide clarity on long-term direction. This report would not have a fiscal impact for the 2016–17 biennium. It examines various governance and water supply program and performance aspects of the Brazos River Authority (BRA), pursuant to provisions of House Bill 2362, Eighty-third Legislature, Regular Session, 2013. 2 House Bill 2362 authorized the Legislative Budget Board (LBB) to review and analyze the effectiveness and efficiency of the policies, management, fiscal affairs, and operations of a river authority. This legislation requires the LBB to review both the BRA and the Lower Colorado River Authority before reviewing other river authorities. The LBB selected BRA for initial review. 3 Similar to other river authorities, BRA is classified by statute as a river authority, a governmental agency, a municipality, and a body politic and corporate. BRA’s stated mission is to develop, manage, and protect the water resources of the Brazos River Basin, and it is governed by a 21-member board of directors. BRA is primarily a wholesale water provider; it is the owner of three major reservoirs in the basin (Lake Granbury, Lake Limestone, and Possum Kingdom Lake), and it also has contracted with the federal U.S. Army Corps of Engineers to partially manage and receive water from eight smaller reservoirs. Ensure that the role, function, and reporting structure of the internal auditor are consistent with statutory requirements and audit standards, and that planned work is complete. Increase alignment of the water conservation plan with the state’s Best Management Practices for Wholesale Water Providers. 4 Include conservation goals in water sales contracts and evaluate implementation of an additional water rate surcharge for entities not in compliance with BRA conservation goals. 5 Designate a department to maintain a centralized database for public information requests and complaints and for resolution efforts by BRA and the board. LBB staff examined the authority’s governance, planning, and stakeholder engagement. The review also examined components of BRA’s overall approach to water resource management, including water supply strategies and BRA’s adherence to best management practices for water conservation. Significant accomplishments and findings of BRA include: ACCOMPLISHMENTS BRA has adopted financial policies and established reserve funds to provide for the authority’s long-term financial stability and prudent short-term financial management. BRA has developed tools to facilitate project planning and internal review of operational-level deliverables and work products, and effectively uses technology to help keep travel costs low and make communication more efficient. BRA successfully has met all water supply contractual obligations during exceptional drought conditions, despite the significant constraints of reduced supply and increased demand. BRA voluntarily has attempted to reconcile the effects of reduced inflows for stakeholders at Lakes Possum Kingdom, Granbury, and Whitney, while also maintaining the ability to effectively provide water throughout the basin. BRA is pursuing, through several strategies, expansion of water supplies that can be made available to water customers. BRA also participates in the state and regional water planning process. BRA has offered or attended more than 200 stakeholder and customer education and outreach meetings throughout the basin since 2010. BRA holds 6 Increase public awareness for quarterly board meetings by including information in BRA newsletters, streaming board meetings on the BRA website, and making presentation materials available on the website. The introduced 2016–17 Gen eral Appropriations Bill does not include any adjustments as a re sult of these recommendations. Recommendations are for BRA to consider for improvement of its management and operations. EXECUTIVE SUMMARY OF LEGISLATIVE BUDGET BOARD REPORTS – JANUARY 2015 – ID: 1980 65 MANAGEMENT REVIEW OF THE BRAZOS RIVER AUTHORITY and attends in-person meetings and uses the Internet and social media platforms to update the public regarding the authority’s activities. FINDINGS BRA has established, maintains, and monitors eight plans related to the financial and operational aspects of the organization. Limited coordination of these planning documents diminishes the effectiveness and efficiency of the board and BRA administration’s oversight. In addition, the internal audit function has not been an effective tool to help the board ensure that BRA has sufficient management controls in place to meet its mission. BRA has not substantially implemented state-designated Best Management Practices for Wholesale Water Providers, and has not reported any effects from improvements in water conservation in its annual water conservation plan report. As a result, BRA cannot ensure that waters in the basin are being used efficiently. BRA customers have not adhered to goals established by the authority in its water conservation plan. BRA has a decentralized system for responding to questions, complaints, and general input from the public. Although this system provides for regional and personalized interaction with the public, the lack of a central repository to log and access information related to public information requests and complaints can lead to inefficiencies and does not ensure accountability. Notices of upcoming board meetings are not communicated in BRA’s quarterly newsletter or through other online media. Board meetings are not streamed on the BRA website, meetings are archived on the website only in audio format, and materials presented during board meetings are not made available online. In some cases, BRA already has taken action to address LBB review findings and recommendations. The full text of this report can be found in Management Review of the Brazos River Authority (Legislative Budget Board, January 2015). 66 EXECUTIVE SUMMARY OF LEGISLATIVE BUDGET BOARD REPORTS – JANUARY 2015 – ID: 1980 ENSURE SOLVENCY AND ACCOUNTABILITY OF THE TEACHER RETIREMENT SYSTEM RETIREE INSURANCE FUND LBB RECOMMENDATIONS 1 Amend statute to allocate the projected cost to maintain TRS-Care funding solvency as follows: 50 percent to an increase in the state contribution, and 12.5 percent each to increases in active member and school district contributions, for the 2016–17 biennium. 2 Include a contingency rider appropriating additional Gen eral Revenue Funds, reflecting an increase in the state contribution rate that provides 50 percent of the TRS-Care projected solvency cost, and deleting a specific school district contribution rate in the General Appropriations Bill. 3 Delete the rider expressing legislative intent that TRS not increase retiree premiums from the 2016–17 General Appropriations Bill. 4 Include a contingency rider requiring TRS to take appropriate actions, such as premium increases and plan design changes, to offset at least 25 percent of the projected cost to maintain the TRS-Care fund’s solvency for the 2016–17 biennium. Direct TRS to submit a report to the Legislative Budget Board and the Governor describing premium and/or plan design changes prior to implementation. (LBB Recommendations con tinued on next page) These recommendations would result in a cost of $366.7 million in General Revenue Funds for the 2016–17 biennium, based on current projections. This action, combined with recommendations related to retiree plan costs, and school district and active member contribution rates, would ensure solvency of the Teacher Retirement System TRS-Care health insurance fund in the 2016–17 biennium. Also, a new TRS report would provide accountability and transparency in administering TRS-Care. TRS has provided health insurance, known as TRS-Care, for retired public education employees since fiscal year 1987. The agency administers a self-insured preferred provider plan and two fully insured managed care plans. The plans offer a range of options from low-premium, high-deductible to higher-premium, lower-deductible coverage. Most of the contribution sources generating revenue for the TRS-Care fund are tied to public education payroll. Because public education payroll has grown at a slower rate than TRS-Care healthcare claims, annual revenue has been less than expenditures since fiscal year 2012, resulting in a projected negative balance for fiscal year 2016. For the 2016–17 biennium, the TRS-Care fund is projected to need an additional $727.2 million to stay solvent. The Legislature faced a similar problem during the 2003 legislative session. The funding shortfall was addressed by a combination of state and active member contribution rate increases, the establishment of a new school district contribution source, and additional revenue from retiree premiums. By implementing a similar cost sharing approach, Texas could ensure solvency of the TRS-Care fund for at least the next biennium. The cost to maintain TRS-Care fund solvency should be allocated as follows: 50 percent to an increase in the state contribution, 25 percent to an increase in retiree costs, and 12.5 percent each to increases in the active member and school district contributions. This approach would assign half of the solvency cost to the state, and moderate the cost increase to retirees. Also, the Legislature and the public would benefit from more transparency and accountability regarding TRS-Care cost containment features. This could be accomplished through an annual report that describes TRS-Care cost containment features and associated savings. The full text of this report can be found in the Texas State Government Effectiveness and Efficiency Report (Legislative Budget Board, January 2015), page 367. EXECUTIVE SUMMARY OF LEGISLATIVE BUDGET BOARD REPORTS – JANUARY 2015 – ID: 1928 67 ENSURE SOLVENCY AND ACCOUNTABILITY OF THE TEACHER RETIREMENT SYSTEM RETIREE INSURANCE FUND LBB RECOMMENDATIONS (CONTINUED) FIGURE 1 FIVE-YEAR FISCAL IMPACT, FISCAL YEARS 2016 TO 2020 5 YEAR PROBABLE SAVINGS/(COST) IN GENERAL REVENUE FUNDS 2016 ($181,514,000) 2017 ($185,144,000) 2018 ($188,847,000) 2019 ($192,624,000) 2020 ($196,476,000) Amend statute to require TRS to produce an annual report identifying and describing each of its major cost containment features and indicating the savings they generate. The goal of the report will be to inform the public of TRSCare cost containment and fraud prevention efforts that also support high-quality health insurance for retirees and their dependents. SOURCE: Legislative Budget Board. The introduced 2016–17 Gen eral Appropriations Bill does not include any adjustments as a result of these recommenda tions. Recommendations 1 and 5 require statutory changes, Rec ommendation 2 requires appro priations, Recommendations 2 and 4 require contingency riders, and Recommendation 3 requires deletion of a rider. 68 EXECUTIVE SUMMARY OF LEGISLATIVE BUDGET BOARD REPORTS – JANUARY 2015 – ID: 1928 INCREASE FISCAL ACCOUNTABILITY AND TRANSPARENCY OF SCHOOL DISTRICTS’ GENERAL FUND BALANCES LBB RECOMMENDATIONS 1 Amend statute to require TEA to reinstate a requirement that school districts maintain minimum general fund balances and require school districts to publicly report the intended use of general fund balances in excess of a certain percentage of operating expenditures. 2 Amend statute to require school district boards of trustees to formally adopt general fund balance policies. The introduced 2016–17 Gen eral Appropriations Bill does not include any adjustments as a re sult of these recommendations. These recommendations require statutory changes. These recommendations would not have a fiscal impact for the 2016–17 biennium. They would increase the fiscal accountability and transparency of school districts’ general fund balances. School districts use their general fund to pay for operating expenditures related to daily operations. A school district’s general fund balance is the difference between its total assets and liabilities. Districts maintain a balance in their general fund sufficient to cover a portion of operating and unforeseen expenditures and ensure cash flow while waiting for revenue. Neither statute nor the Texas Education Agency (TEA) require Texas school districts to have a general fund balance policy or to maintain a minimum general fund balance. National accounting standards for state and local governments require school districts to report their general fund balances in five categories, including nonspendable, restricted, committed, assigned and unassigned. As of fiscal year 2013, Texas school districts reported a total of $13.7 billion in general fund balances. Of that total, 70 percent ($9.5 billion) was classified as unassigned and is available for any legal expenditure. The Eighty-second Legislature, 2011, reduced Foundation School Program (FSP) entitlement funding for the 2012–13 biennium. This legislative action was in response to a projected budget shortfall for the 2012–13 biennium, along with increasing state costs to the FSP. In total, school district and charter school entitlement for the 2012–13 biennium was $4.0 billion less than the amount that would have been necessary to maintain 2011 entitlement funding levels. Many Texas school districts adjusted to the economic uncertainty by increasing the amounts held in their general fund balances. From fiscal years 2011 to 2012, school districts increased the amounts held in their general fund balances by approximately $1.5 billion, and decreased their total operating expenditures by approximately $1.6 billion. From fiscal years 2011 to 2013, 218 school districts (21 percent) had decreases to their general fund balances. However, during that period, 803 districts (79 percent) had increases in their general fund balance amounts. School districts are not required to disclose the intended use of these public funds. By requiring school districts to maintain minimum general fund balances and publicly report the funds’ intended usage, Texas would increase the districts’ financial accountability and transparency. Figure 1 shows the number of districts whose general fund balances changed, and the percentage changes in those balances from fiscal years 2011 to 2013. More detailed information is available on this subject at the Interactive Graphics link of the Legislative Budget Board’s website http://www.lbb.state.tx.us/Interactive. aspx. The full text of this report can be found in the Texas State Government Effectiveness and Efficiency Report (Legislative Budget Board, January 2015), page 377. EXECUTIVE SUMMARY OF LEGISLATIVE BUDGET BOARD REPORTS – JANUARY 2015 – ID: 1911 69 INCREASE FISCAL ACCOUNTABILITY AND TRANSPARENCY OF SCHOOL DISTRICTS’ GENERAL FUND BALANCES FIGURE 1 TEXAS SCHOOL DISTRICTS’ PERCENTAGE CHANGE IN GENERAL FUND BALANCES, FISCAL YEARS 2011 TO 2013 CHANGE DISTRICTS PERCENTAGE OF TOTAL DISTRICTS <-201% 1 0% -151% to -200% 0 0% -101% to -150% 4 0% -100% to -50% 13 1% -49% to 0% 200 20% 1% to 50% 428 42% 51% to 99% 146 14% 68 7% >=100% to 150% 151% to 200% >200% 39 4% 122 12% NOTE: Number of districts does not include five districts with negative general fund balances for 2011 and one district that has not submitted its annual financial report for 2013. SOURCE: Texas Education Agency. 70 EXECUTIVE SUMMARY OF LEGISLATIVE BUDGET BOARD REPORTS – JANUARY 2015 – ID: 1911 TRENDS IN THE NUMBER AND SALARIES OF ADMINISTRATORS IN TEXAS PUBLIC SCHOOLS LBB FACTS AND FINDINGS From school years 2004–05 to 2012–13, the total number of public school administrators in Texas increased by an average of 1.9 percent annually. This average annual increase was greater than the 1.2 percent average annual increase in total number of school employees during this period. From school years 2004–05 to 2008–09, the rate of growth for the number of school administrators ex ceeded the rate of enrollment growth. That trend reversed in 2009–10, when the annual rate of enrollment growth exceeded the rate of growth among ad ministrators. The average annual increase in the total number of public school administrators statewide was 0.6 percentage points greater than the increase in numbers of teachers, 1.2 percentage points greater than auxiliary staff, and 1.7 percentage points greater than educational aides. However, the increase in number of professional support staff was 1.0 percentage points greater than that of administrators. Statewide, the average salary of public schools’ central office administrators increased by an annual average of 2.3 percent from school years 2004–05 to 2012–13. This increase was greater than the increase in salaries of campus-level administrators (1.7 percent), teachers (2.1 percent), and professional support staff (1.9 percent). The introduced 2016–17 General Appropriations Bill does not in clude any adjustments as a result of this report. This report does not include any recommendations. This report would not have a fiscal impact for the 2016–17 biennium. It provides information on the trends in the number and salaries of administrators in Texas public schools. Public school administrators play key roles in ensuring that schools function smoothly. Administrators are involved in nearly all aspects of school operation, from overseeing the school budget and planning curricula to student behavior management. For school year 2012–13, more than 25,000 administrators served in Texas public schools. During the past 10 school years, the number of administrators increased at a greater annual rate than teachers, auxiliary staff, and educational aides, but at a lesser rate than professional support staff. The average salary of central and campus administrators each increased at greater rates than the average salaries of teachers and professional support staff. The average salary of campus administrators, however, increased at a lower rate than central administrators. From school years 2003–04 to 2012–13, the number of school administrators grew at an average of 1.9 percent annually. During this period, the average annual increase in student enrollment statewide was 1.7 percent. This average 1.9 percent growth rate in the number of administrators was 0.6 percent higher than the average annual increase in the number of teachers. Also during this period, the number of auxiliary staff increased by an average of 0.7 percent annually, while the number of educational aides increased annually by an average of 0.3 percent. The average annual increases of both auxiliary staff and educational aides were less than the 1.9 percent increase in the number of administrators during this period. However, the number of professional support staff increased at a greater average annual rate than that of administrators. Professional support staff increased by an average annual percentage of 2.9 percent. For school year 2012–13, the total salaries of administrators statewide accounted for 7.4 percent of all school staff salaries. This rate compares to 7.1 percent for school year 2003–04. From school years 2003–04 to 2012–13, the total salaries of administrators increased annually by an average of 4.1 percent. The total salaries of all school staff increased by an average of 3.7 percent annually during this period. The statewide average salary of central administrators increased annually by an average of 2.3 percent from school years 2003–04 to 2012–13. The average salary of campus administrators increased by an average of 1.7 percent annually, which was 0.6 percent less than the average annual increase in the average salary among central administrators. The average salary of central administrators increased at a rate greater than the average salaries of teachers, professional support staff, and campus administrators. The average salary of campus administrators, however, increased at a lower rate than those of teachers, professional support staff, and central administrators. The full text of this report can be found in the Texas State Government Effectiveness and Efficiency Report (Legislative Budget Board, January 2015), page 382. EXECUTIVE SUMMARY OF LEGISLATIVE BUDGET BOARD REPORTS – JANUARY 2015 – ID: 1910 71 OVERVIEW OF FUNDING AND ACCOUNTABILITY FOR BILINGUAL AND ENGLISH AS A SECOND LANGUAGE PROGRAMS IN TEXAS PUBLIC SCHOOLS LBB FACTS AND FINDINGS For school year 2013–14, Texas public schools classified 899,780 students as ELLs. Of these, 521,491 students were enrolled in a bilingual program, and 357,078 were enrolled in an ESL program. The number of students classified as ELLs increased by an average of 2.1 percent annually from school years 2009–10 to 2013–14. Total student enrollment increased by an average of 1.3 percent annually during this period. For school year 2013–14, Texas received approximately $98.4 million in federal funding to supplement ELL services. The total Texas FSP entitlement attributable to bilingual/ESL attendance for school year 2013–14 was approximately $477.5 million. TEA monitors and evaluates the performance and effectiveness of bilingual and ESL programs each year. Based on the results, the agency identifies public schools for interventions. For school year 2013–14, 315 school districts and charter schools, or 25.7 percent, were selected for a stage of interventions. This report would not have a fiscal impact for the 2016–17 biennium. It provides information regarding funding and accountability for bilingual and English as a second language programs in Texas public schools. An English language learner (ELL) is a student who is in the process of acquiring English and has another language as the native language. Texas Education Agency (TEA) rules state that the term ELL is used interchangeably with limited English proficient. Approximately 900,000 students in Texas public schools were identified as ELLs during school year 2013–14. The number of students classified as ELLs is steadily increasing. To meet both their academic and English language-acquisition needs, these students are offered services in a bilingual or English as a second language (ESL) program. Schools incur costs related to student assessment, instructional materials, teacher training, and hiring certified teachers to provide special language programs. Both the federal and state governments provide enhanced funding to support special language programs and to help offset the cost of these services. The U.S. Department of Education provides formula-based grants to state education agencies based on the number of ELL and immigrant students in the state. The formula provides 80 percent of funding based on the number of ELL students and 20 percent based on the number of immigrant students in the state. The Texas Foundation School Program (FSP) provides additional funding for special language programs. The FSP entitlement is generated in part by the average daily attendance for students in bilingual and ESL programs. Bilingual and ESL programs include unique monitoring and accountability requirements. TEA annually monitors and evaluates the performance and effectiveness of these programs in public schools using the Performance-Based Monitoring Analysis System (PBMAS). TEA may select school districts or charter schools that do not perform well on these performance indicators for interventions. Figure 1 shows the number of school districts and charter schools selected for a stage of PBMAS intervention from school years 2011–12 to 2013–14. The full text of this report can be found in the Texas State Government Effectiveness and Efficiency Report (Legislative Budget Board, January 2015), page 391. The introduced 2016–17 Gen eral Appropriations Bill does not include any adjustments as a result of this report. This report does not include any recommen dations. 72 EXECUTIVE SUMMARY OF LEGISLATIVE BUDGET BOARD REPORTS – JANUARY 2015 – ID: 1912 OVERVIEW OF FUNDING AND ACCOUNTABILITY FOR BILINGUAL AND ESL PROGRAMS IN TEXAS PUBLIC SCHOOLS FIGURE 1 TEXAS SCHOOL DISTRICTS AND CHARTER SCHOOLS BY STAGE OF PERFORMANCE-BASED MONITORING ANALYSIS SYSTEM INTERVENTION FOR BILINGUAL EDUCATION/ESL PROGRAMS, SCHOOL YEARS 2011–12 TO 2013–14 200 150 100 50 0 Stage 1 Stage 2 2011–12 Stage 3 2012–13 Stage 4 2013–14 NOTE: ESL = English as a second language. SOURCE: Texas Education Agency. EXECUTIVE SUMMARY OF LEGISLATIVE BUDGET BOARD REPORTS – JANUARY 2015 – ID: 1912 73 OVERVIEW OF TEXAS EDUCATION AGENCY’S PROJECT SHARE ONLINE RESOURCES LBB FACTS AND FINDINGS Educators use Project Share to assign their students online supplemental lessons and to conduct math assessments to determine high school algebrareadiness. This report would not have a fiscal impact for the 2016–17 biennium. It provides an overview of Project Share’s history as an online professional development and instructional resource tool, annual expenditures and usage by educators and students, process for adding and enhancing online content, and possible future directions. From fiscal years 2010 to 2014, TEA paid three ESCs and various institutions of higher education $41.1 million to develop online courses and student-related content for Project Share. To maintain teaching certificates, Texas educators must complete a certain number of continuing professional education credit hours. Continuing professional education requirements vary depending on the type of certificate. Classroom teachers must complete 150 clock hours of continuing education every five years, while other professionals such as principals and superintendents must complete 200 hours. Educators can earn continuing education credit though methods including face-to-face courses provided by Education Service Centers (ESC) or private companies, and online learning through video conferences and online courses. Texas educators had access to approximately 2,010 professional development providers as of September 2014, which may offer conventional face-to-face or online courses. TEA expended $14.8 million for a statewide license to use the Epsilen platform and learn ing management system from fiscal years 2010 to 2014. The original Epsilen provider, Con nectEDU, declared bankruptcy in spring 2014. TEA prevented a potential service disruption by contracting with the new Epsi len provider, Graduation Alli ance, for school year 2014–15. The Texas Education Agency’s (TEA) Project Share is a web-based platform that offers online professional development courses and educational resources at no cost to the user. During fiscal year 2014, 167,865 educators took online professional development courses through Project Share. Educational resources include online supplemental lessons and math-related assessments for students, and access to learning sources such as the New York Times Knowledge Network and the PBS Digital Learning Library. Educators can also access Project Share to collaborate with their peers through professional learning communities. The agency uses a platform and learning management system called Epsilen to provide Project Share services. The program was appropriated $18.0 million in General Revenue Funds for the 2014–15 biennium. The agency has requested the same appropriation level for Project Share for the 2016–17 biennium. The introduced 2016–17 Gen eral Appropriations Bill does not include any adjustments as a result of the report. This report does not include any recommen dations. 74 The full text of this report can be found in the Texas State Government Effectiveness and Efficiency Report (Legislative Budget Board, January 2015), page 402. EXECUTIVE SUMMARY OF LEGISLATIVE BUDGET BOARD REPORTS – JANUARY 2015 – ID: 1930 OVERVIEW OF FISCAL IMPACT OF SHALE DRILLING ON TEXAS SCHOOL DISTRICTS REPORT HIGHLIGHTS Texas school districts within and adjacent to shale plays added $40.9 billion in mineral wealth from tax years 2007 to 2013, a 68 percent increase. In the same period, districts that are not located near shale plays lost $2.6 billion in mineral wealth, a 7 percent decrease. Eagle Ford grew dramatically in that period, with mineral gains of 377 percent and total property growth of 113 percent. For fiscal year 2015, 39 percent of school districts in Texas located in shale plays are projected to owe recapture to the state, compared to 18 percent of districts located outside of shale plays. Recapture is a financing mechanism to reduce a district’s wealth per weighted student to a statutorily determined level. This report would not have a fiscal impact for the 2016–17 biennium. It provides analysis of the impact of shale oil and gas production on Texas property values and school finance. Oil and gas production historically has been a significant driver in the Texas economy. Recent advancements in extraction methods have led to a resurgence of oil and gas production in Texas. In particular, attention has been focused on new drilling activity in the Eagle Ford shale play. Public independent school districts in the Eagle Ford region have experienced significant property value growth and related school finance effects due in part to shale development. Within a statewide context, the changes in the Eagle Ford shale play have had a relatively modest overall impact thus far on the state’s school finance system through fiscal year 2013. However, the financial impacts of Eagle Ford growth are projected to be significant for fiscal years 2014 and 2015. For fiscal year 2015, 44 percent of school districts located in the Eagle Ford shale play are projected to owe recapture, up from 19 percent in 2010. Total recapture from districts located in Eagle Ford is projected to increase by nearly 500 percent, from $35.6 million to an estimated $212.7 million, between fiscal years 2010 and 2015. Future volatility in oil and gas prices could lead to property value declines and associated decreases in recapture. The full text of this report can be found in Overview of Fiscal Impact of Shale Drilling on Texas School Districts (Legislative Budget Board, January 2015). From fiscal years 2010 to 2015, recapture from school districts in Texas located in or adjacent to shale plays is projected to increase by $236.6 million, while non-shale related recapture is projected to increase by $35.5 million. Barring significant changes in tax rates or enrollment, recapture in 2015 tentatively is projected to total $1.3 billion, with more than 50 percent of total recapture coming from districts in shale plays. The introduced 2016–17 Gen eral Appropriations Bill does not include any adjustments as a result of this report. This report does not include any recommen dations. EXECUTIVE SUMMARY OF LEGISLATIVE BUDGET BOARD REPORTS – JANUARY 2015 – ID: 1967 75 COMPREHENSIVE SCHOOL PERFORMANCE REVIEWS REPORT HIGHLIGHTS The LBB School Performance Review team conducts com prehensive reviews of school districts’ and charter schools’ educational, financial, and op erational services and programs. Comprehensive reviews ex amine 12 functional areas and recommend ways to cut costs, increase revenues, reduce over head, streamline operations, and improve the delivery of educational, financial, and op erational services. School districts are typically selected for management and performance reviews based on a risk analysis of multiple educa tional and financial indicators. To gain an understanding of the school districts’ operations, the review team analyzes dis trict and state-level data, issues surveys of parents and district staff, and conducts onsite ob servation and analysis in the districts, including multiple in terviews and focus groups with district stakeholders. The review team produces reports that identify accom plishments, findings, and rec ommendations based on the analysis of data and onsite study of each district’s operations. The introduced 2016–17 Gen eral Appropriations Bill does not include any adjustments as a result of these reports. These reports do not include any statelevel recommendations. 76 These reports would not have a state fiscal impact for the 2016–17 biennium. The School Performance Review team conducted six comprehensive school reviews published in calendar years 2013 and 2014. Some recommendations in these reports are based on state or federal laws, rules, or regulations, and should be addressed promptly. Other recommendations are based on comparisons to state or industry standards, or accepted best practices, and should be reviewed by the districts to determine the level of priority, appropriate schedule, and method of implementation. The Texas Legislature established the school performance review in 1990 to periodically review the effectiveness and efficiency of the budgets and operations of school districts. For the 2014–15 biennium, comprehensive school reviews were conducted in six districts. Luling Independent School District (ISD) is in Caldwell County and is located 58 miles east of San Antonio. This report includes 67 recommendations, with improvements needed in the district’s organizational structure, its policies and procedures in several departments, and in planning for academics, food service, transportation and facilities. Refugio ISD is in Refugio County and is located in the coastal bend area. This report includes 52 recommendations, with improvements needed in planning, financial operations, and district organization and communications, including a need for upgraded bandwidth capacity to support its technology. Beaumont ISD is in Jefferson County and is located 85 miles east of Houston. The Commissioner of Education for the Texas Education Agency requested the Legislative Budget Board (LBB) conduct a comprehensive review of Beaumont ISD based on on-going concerns with the district’s governance and fiscal management. This report includes 85 recommendations, including financial operations. After the report was released, TEA relied upon the report’s conclusions as a component of its decision to appoint a board of managers to lead the district. Subsequently, federal agency investigations of several district employees were conducted in the financial operations function. Freer ISD is in Duval County and is located 63 miles east of Laredo. This report includes 65 recommendations. The most critical recommendations were in the area of long-range planning, as the district needed more planning overall and specifically in facilities, technology, and safety and security. Pearsall ISD is in Frio County and is located 54 miles south of San Antonio. This report includes 66 recommendations, with improvements needed in long-range planning, budget and financial oversight, and staffing, where there has been a high turnover of teachers and principals. Presidio ISD is in Presidio County and is located 255 miles southeast of El Paso. This report includes 60 recommendations, with a series of the recommendations requiring district action to ensure compliance in its financial, technology, personnel, safety, transportation, and child nutrition operational areas. The report identified several opportunities for improved efficiency through the use of technology to more efficiently manage its finances. Improvements were also identified in planning, including curriculum management and facilities planning. EXECUTIVE SUMMARY OF LEGISLATIVE BUDGET BOARD REPORTS – JANUARY 2015 – ID: 1982 COMPREHENSIVE SCHOOL PERFORMANCE REVIEWS The full text of these six reviews can be found in these reports: Luling Independent School District, Management and Performance Review (Legislative Budget Board, June 2013) Refugio Independent School District, Management and Performance Review (Legislative Budget Board, July 2013) Beaumont Independent School District, Management and Performance Review (Legislative Budget Board, August 2013) Freer Independent School District, Management and Performance Review (Legislative Budget Board, April 2014) Pearsall Independent School District, Management and Performance Review (Legislative Budget Board, July 2014) Presidio Independent School District, Management and Performance Review (Legislative Budget Board, September 2014) EXECUTIVE SUMMARY OF LEGISLATIVE BUDGET BOARD REPORTS – JANUARY 2015 – ID: 1982 77 78 EXECUTIVE SUMMARY OF LEGISLATIVE BUDGET BOARD REPORTS – JANUARY 2015 OVERVIEW OF SERVER CONSOLIDATION WITHIN DATA CENTER SERVICES LBB FACTS AND FINDINGS For the 2014–15 biennium, appropriations to the Statewide Technology Account totaled $388.1 million in Interagency Contracts for Data Center Ser vices. The Legislature has ap propriated $1.3 billion for this program since implementation in the 2006–07 biennium. The per unit prices the vendor charges agencies are determined by total state consumption. As agencies consolidate and con sume services above the esti mated baseline within the state data center, the per unit price the state pays for a given service decreases. The contractual obligation for the service providers to main tain consolidation capacity ends in August 2016. After August 2016, servers may still be con solidated as part of other servic es included in the contract, but agencies may have to pay addi tional costs for labor or project management. This report would not have a fiscal impact for the 2016–17 biennium. It provides a history of the data center services program administered by the Texas Department of Information Resources (DIR) and a summary of challenges that have affected timely server consolidation and the achievement of cost savings and increased efficiency. In 2005, the Seventy-ninth Legislature initiated a program to merge the data centers of certain state agencies into two consolidated data centers located in Austin and San Angelo. With the goals of upgrading technology, increasing security, and reaping economies of scale, the Legislature directed DIR to contract for data center services on behalf of the state. The state entered into the first contract expecting to complete consolidation by April 2009; however, by August 2009 the vendor had consolidated only 11 percent of participating agencies’ data center servers. DIR re-procured the contract, which took effect in 2012. Server consolidation is still incomplete, though user satisfaction has improved since the re-procurement of the contract. Some server consolidation depends on the remediation of outdated applications, while other servers will not be consolidated for business or logistical reasons. According to DIR, approximately 57 percent of servers have been consolidated as of September 2014. Some of the remaining 43 percent of servers will not be consolidated for business or technical reasons. Some agencies have not yet requested approval from DIR for exceptions to consolidation for those servers, so the number of servers that still need to be consolidated is not clear. This lack of information prevents the state from determining when consolidation is actually complete. The full text of this report can be found in the Texas State Government Effectiveness and Efficiency Report (Legislative Budget Board, January 2015), page 409. Consolidating a server requires preparation work by agencies and cooperation between the agency and service providers. Applications on some agency servers must be remediated be fore they can be consolidated, which can require additional resources from the agency. The introduced 2016–17 Gen eral Appropriations Bill does not include any adjustments as a result of this report. This report does not include any recommen dations. EXECUTIVE SUMMARY OF LEGISLATIVE BUDGET BOARD REPORTS – JANUARY 2015 – ID: 1939 79 80 EXECUTIVE SUMMARY OF LEGISLATIVE BUDGET BOARD REPORTS – JANUARY 2015 ENHANCE THE PROCESS USED TO REMOVE NONINTEGRAL ROADS FROM THE STATE HIGHWAY SYSTEM LBB RECOMMENDATIONS 1 Amend statute to require TxDOT to establish criteria to identify best candidate roads for the turnback program and develop detailed and consistent procedures to guide the transfer process in collaboration with stakeholders. 2 Amend statute to require an annual review of roads in eligible communities by a city, its municipal planning organization, and TxDOT using established criteria to determine roads with potential to be transferred voluntarily. Best candidate roads and any roads planned for transfer would be included in district Department Work Programs. 3 Include a rider requiring TxDOT to report key per formance information regarding the turnback program to the Legislative Budget Board and the Office of the Governor to ensure accountability and assess program effectiveness. The introduced 2016–17 Gen eral Appropriations Bill includes a rider to implement Recommen dation 3. Recommendations 1 and 2 require statutory changes. These recommendations would not have a fiscal impact for the 2016–17 biennium. They would help ensure that all urban roads eligible for the turnback program are reviewed consistently and that program outcomes maximize maintenance funds available to address transportation needs that are fundamental to state highway system connectivity. A highway turnback program is the transfer of state-owned roads that function more like city streets than state highways to the municipalities in which the roads are located. During fiscal year 2013, the Texas Department of Transportation (TxDOT) determined that 6,900 lane miles of urban roadways in 59 communities were no longer integral to the connectivity of the state highway system. In March 2014, TxDOT executed a memorandum of understanding (MOU) with key stakeholders for a voluntary turnback program, which allows for the transfer of nonintegral roads to local governments. Transferring these nonintegral roads makes state maintenance funds available to be spent on other transportation needs. Thirty communities have expressed interest in participating in the turnback program for fiscal year 2015, and TxDOT is working with seven cities to transfer roads. This transfer allows local governments to control issues such as driveway access, speed limits, on-street parking, and maintenance schedules for these roads. TxDOT anticipates transferring a total of 500 lane miles by the end of fiscal year 2017 to municipalities. However, any savings associated with these turned-back roads will be minimal for fiscal years 2016 and 2017. In accordance with the MOU, a portion of maintenance savings from the program—up to $100 million—will be used to fund the first year of maintenance costs for each transferred road. Although the MOU for the program contains a review of roads for potential turnback, this review process does not include criteria to determine roads that are the best candidates to be turned over, which limits its effectiveness. Also, there is no statute or agency rule requiring this road review; as a result, cities’ participation is not guaranteed, and the state could miss an opportunity to remove roads from the state highway system that would make funds available for redirection to other transportation projects. Additionally, no mechanism is planned to ensure the transparency and accountability of the voluntary turnback program. Without an oversight mechanism, it will be difficult to determine the effects of the program and the amount of maintenance revenue made available and redirected to other projects. The full text of this report can be found in the Texas State Government Effectiveness and Efficiency Report (Legislative Budget Board, January 2015), page 422. EXECUTIVE SUMMARY OF LEGISLATIVE BUDGET BOARD REPORTS – JANUARY 2015 – ID: 1899 81 INCREASE THE FEE FOR A DUPLICATE MOTOR VEHICLE TITLE TO RECOVER STATE COSTS LBB RECOMMENDATION 1 Amend statute to authorize the board of DMV to set the fee for a certified copy of motor vehicle title in rule to fully recover the cost of providing duplicate titles. The introduced 2016–17 Gen eral Appropriations Bill does not include any adjustments as a result of this recommendation. This recommendation requires a statutory change. This recommendation would result in an estimated $8.2 million gain in General Revenue Funds for the 2016–17 biennium and would allow the state to fully recover the cost of providing duplicate certificates of motor vehicle title. The owner of a motor vehicle registered in Texas is required to apply to the Texas Department of Motor Vehicles (DMV) for a title to the vehicle. The title establishes the applicant as the legal owner of the vehicle, and the vehicle may not be operated legally on a public highway until the owner obtains a title. When the original vehicle title is lost or destroyed, owners must submit an application to DMV for a certified copy of title. A certified copy of motor vehicle title can be requested via mail or in person at DMV’s 16 regional offices. DMV issues more than 300,000 duplicate titles a year. The mail-in application fee for these documents was set in statute in 1983 at $2. The in-person application fee has been $5.45 since 1993, based on the statutory fee and add-on fees set via administrative rule. According to DMV, regardless of application method, on average it costs the agency about $16 to issue a certified copy of motor vehicle title. For fiscal year 2013, the agency expended $4.1 million more than it collected to provide duplicate titles. Authorizing DMV to set this fee at a rate that fully recovers the cost of issuing a certified copy of title would allow the program to be self-supporting. FIGURE 1 FIVE-YEAR FISCAL IMPACT, FISCAL YEARS 2016 TO 2020 YEAR PROBABLE REVENUE GAIN/(LOSS) IN GENERAL REVENUE FUNDS 2016 $4,145,248 2017 $4,145,248 2018 $4,145,248 2019 $4,145,248 2020 $4,145,248 SOURCE: Legislative Budget Board. The full text of this report can be found in the Texas State Government Effectiveness and Efficiency Report (Legislative Budget Board, January 2015), page 427. 82 EXECUTIVE SUMMARY OF LEGISLATIVE BUDGET BOARD REPORTS – JANUARY 2015 – ID: 1915 IMPROVE THE OPERATIONS AND STATE OVERSIGHT OF OVERWEIGHT CORRIDORS LBB RECOMMENDATIONS 1 Amend statute to require TxDOT to set baseline re quirements to determine the fea sibility, viability, and economic impact of potential overweight corridors and use these require ments to periodically develop rec ommendations for any additional overweight corridors that would be beneficial for the state. 2 Amend statute to require TxDOT to work with stake holders to establish performance measures for each corridor and require that results be reported to TxDOT and the Legislature to al low for an evaluation of the corri dor’s effects on freight movement. 3 Amend statute to authorize DMV to issue overweight cor ridor permits on behalf of local entities and to authorize DMV to establish a fee in an amount suffi cient to recover the actual cost of issuance. 4 Amend statute to require TxDOT to complete a pavement management plan for each opera tional corridor to ensure all parties have information regarding the long-term cost of maintaining cor ridors. (LBB Recommendations tinued on next page) con These recommendations would not have a significant fiscal impact for the 2016–17 biennium; local entities that issue overweight corridor permits could realize a savings to the extent that the Texas Department of Motor Vehicles (DMV) would be able to issue permits on their behalf for a lower cost. These recommendations would improve state oversight and require that best practices be applied to future corridors, thereby allowing state and local entities to ensure the efficiency of these corridors. Overweight corridors are a general designation used to identify roadways or segments of roadways as a route where commercial vehicles can transport loads that exceed state weight and size limits. Without an overweight corridor, trucks transporting loads exceeding these limits would need to either reduce or divide cargo, which can increase the time and cost required for shipping goods, or the trucks would need to obtain an alternative permit that allows certain oversize or overweight vehicles to travel on Texas’ roads. As of December 2014, Texas had six statutorily authorized overweight corridors on state highways, three of which were operational. These corridors are established as an incentive for economic development, and overweight corridor permits are issued in lieu of the state’s oversize/overweight permits, resulting in the state forgoing revenue. However, not all of the corridors are currently operational because of concerns that the demand for permits is insufficient to offset operational costs. This suggests the economic development potential of these corridors was limited at the time the corridor was authorized. Overweight corridors have been approved on an ad hoc basis and outside of the state’s transportation planning process. As a result, these corridors are not considered in the context of requirements for road maintenance and expansion of the state’s wider transportation system. State oversight of the operation of the corridors is limited to monitoring financial reports and pavement performance. As a result, it has not been possible to determine the effects of Texas’ overweight corridors on economic development or evaluate the potential benefit of future corridors. Local entities that operate these corridors can charge commercial vehicles a maximum of between $80 and $100 per trip for corridor travel with loads weighing up to between 110,000 and 140,000 pounds. Local entities are authorized to retain up to 15 percent of permit revenue for administration. DMV, which uses an automated system to issue oversize/overweight permits, does not have statutory authority to issue overweight corridor permits on behalf of local entities. As a result, these entities individually contract for services with the same provider the state uses to issue permits and may be missing an opportunity to lower their administrative costs by using the state’s system. The remaining 85 percent of revenue generated by overweight corridor permits is deposited to the State Highway Fund to pay for the corridor’s maintenance needs. The Texas Department of Transportation (TxDOT) is responsible for planning for and completing this maintenance. If fee revenue is insufficient to cover the cost of maintenance, the entities may provide alternative funding sources to cover the difference. Minor variations in traffic can significantly EXECUTIVE SUMMARY OF LEGISLATIVE BUDGET BOARD REPORTS – JANUARY 2015 – ID: 1897 83 IMPROVE THE OPERATIONS AND STATE OVERSIGHT OF OVERWEIGHT CORRIDORS LBB RECOMMENDATIONS (CONTINUED) 5 Amend statute to require local entities to consider the pave ment management plan provided by TxDOT when setting permit rates. The introduced 2016–17 General Appropriations Bill does not in clude any adjustments as a result of these recommendations. These recommendations require statu tory changes. 84 affect pavement performance and accelerate the need for substantial maintenance improvements. It is unclear whether local entities which are responsible for these costs have the information required to adequately plan for higher-cost maintenance needs. Improving state oversight of overweight corridors and requiring that best practices be applied to future corridors would allow state and local entities to ensure the efficiency of these corridors. The full text of this report can be found in the Texas State Government Effectiveness and Efficiency Report (Legislative Budget Board, January 2015), page 429. EXECUTIVE SUMMARY OF LEGISLATIVE BUDGET BOARD REPORTS – JANUARY 2015 – ID: 1897 OPTIONS TO INCREASE REVENUE AVAILABLE FOR TRANSPORTATION INFRASTRUCTURE LBB FACTS AND FINDINGS During the 2014–15 biennium, TxDOT was appropriated $21.2 billion in All Funds to administer the state’s transportation system, including $9.0 billion in Other Funds (State Highway Fund). Traditional methods of financing for highway construction and maintenance include revenues from state motor fuel taxes, oversize/ overweight vehicle permits, motor vehicle sales and use tax, and motor vehicle registration fees. Other financing methods used for highway construction and maintenance in Texas include the use of bond proceeds, toll revenues, and public-private partnerships. It is estimated an additional $5.0 billion in revenue is needed to maintain road and bridge conditions and congestion at 2010 levels. This estimate does not account for the funding needs of other modes of transportation. The introduced 2016–17 Gen eral Appropriations Bill includes adjustments to implement the options relating to reducing State Highway Fund appropriations to agencies other than TxDOT. Other options require statutory changes. The fiscal impact to General Revenue Funds, the State Highway Fund, and the Texas Mobility Fund for the 2016–17 biennium would vary depending upon the option(s) implemented. This report provides options to increase state revenue for transportation projects related to roads, ports and water, rail, and air transportation. Options identified relate to redirecting current revenue sources, amending current taxes and fees, generating revenue from alternatively powered vehicles, and establishing new revenue sources. Growth in population, vehicle miles traveled, and freight traffic are deteriorating Texas’ road infrastructure and increasing congestion. Simultaneously, the purchasing power of traditional revenue sources for road funding is decreasing as a result of highway construction inflation. Additionally, when adjusted for population and vehicle miles traveled, the growth rate of the motor fuels tax is smaller and even negative in some years as a result of increased fuel efficiency. The Texas Department of Transportation (TxDOT) estimates an additional $5.0 billion (as of October 2013) is needed annually to maintain the highway network at 2010 levels of congestion and maintenance. Costs associated with delaying transportation maintenance include pavement preservation and poor road conditions. Pavement preservation is 6 to 10 times less expensive than road rehabilitation or reconstruction. Poor road conditions are a factor in approximately one-third of fatal auto accidents; they also increase vehicle maintenance needs and lower the speed at which vehicles can safely travel, thus increasing travel time and vehicle emissions. This report identifies more than 30 options to increase the amount of state revenue dedicated for transportation projects related to roads, ports and water, rail, and air transportation. Providing additional revenue for non-highway modes of transportation would help the state address highway needs by offsetting current appropriations from the State Highway Fund for these functions. Options the Legislature could choose to apply can be classified in one of the following three ways: • redirect existing revenue; • increase existing revenue; or • develop new revenue sources. Appendix A of the report provides a brief description of each option and the fiscal impact. Appendices B through F provide detailed information regarding each option, including a description, information on current uses, methods of implementation, other considerations, and revenue potential. The full text of this report can be found in Options to Increase Revenue Available for Transportation Infrastructure (Legislative Budget Board, January 2015). EXECUTIVE SUMMARY OF LEGISLATIVE BUDGET BOARD REPORTS – JANUARY 2015 – ID: 1914 85 OPTIONS TO FUND ENERGY SECTOR TRANSPORTATION REPAIRS LBB FACTS AND FINDINGS New technologies expand the areas in which exploration and production of oil and gas is economically feasible. This activity often takes place in rural or suburban areas of the state in which roads are not designed or constructed for a high level of industrial activity. Energy sector activity typically brings a substantial increase in traffic of both passenger vehicles and oversize or overweight vehicles. Roads that were intended for 100 vehicles per day may now have 1,000 oversize or overweight vehicles per day. Increased traffic can deteriorate roads decades more quickly than originally estimated. Damaged or inadequate roads can cause issues related to traffic and public safety. The estimated annual cost to the state to repair roads that are damaged by energy sector activity and are rated below good condition is from $1.0 billion to $2.0 billion. The fiscal impact to General Revenue Funds and the State Highway Fund for the 2016–17 biennium would vary depending upon the option(s) implemented. This report provides options for the construction and maintenance of transportation infrastructure affected by energy sector activity. The scope of this review includes only state roads and does not include local or county roads, waterways, or rail. Options identified relate to amending or diverting current taxes and fees and establishing new revenue sources and funds. Texas has experienced an increase in oil and gas exploration and production due in part to new technologies such as hydraulic fracturing and horizontal drilling. Much of the increase in energy sector activity takes place in rural areas, where roads are not designed for high-volume, overweight traffic. Some of the activity is also in urban or suburban areas, neither of which may have roads constructed for industrial traffic. As a result, energy sector activity has increased road deterioration. Increased traffic and road deterioration contribute to increased safety risks for the public and energy sector workers. The fiscal impact of energy sector activity on transportation infrastructure is affected by the dynamic nature of the industry and the rapid shifts in geographic focus of activity. This report identifies more than 10 options to increase state revenue for the construction and maintenance of transportation infrastructure affected by energy sector activity. Options the Legislature could choose to apply can be classified in one of the following four ways: • cost avoidance; • redirecting existing revenue; • increasing revenue; or • new revenue. Appendix A of the report provides a brief description of each option and its potential fiscal impact. Appendices B through D provide detailed information regarding each option, including a description, information on current uses, methods of implementation, other considerations, and revenue potential. The full text of this report can be found in Options to Fund Energy Sector Transportation Repairs (Legislative Budget Board, January 2015). The introduced 2016–17 Gen eral Appropriations Bill does not include any adjustments as a result of this report. This report includes options that require statutory changes. 86 EXECUTIVE SUMMARY OF LEGISLATIVE BUDGET BOARD REPORTS – JANUARY 2015 – ID: 1898
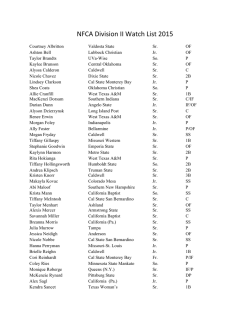

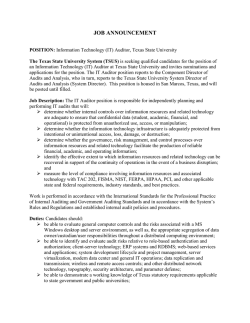


© Copyright 2026