
Net income
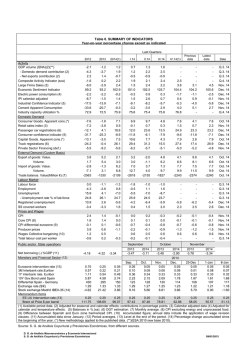
EARNINGS
PRESENTATION
FY 2014
FEBRUARY 2015
Disclaimer
This document is not an offer of securities for sale in the United States, Canada, Australia, Japan or any
other jurisdiction. Securities may not be offered or sold in the United States unless they are registered
pursuant to the US Securities Act of 1933 or are exempt from such registration. Any public offering of
securities in the United States, Canada, Australia or Japan would be made by means of a prospectus that
will contain detailed information about the company and management, including financial statements
The information in this presentation has been prepared under the scope of the International Financial
Reporting Standards (‘IFRS’) of BCP Group for the purposes of the preparation of the consolidated
financial statements under Regulation (CE) 1606/2002
The figures presented do not constitute any form of commitment by BCP in regard to future earnings
Figures for 2014 not audited
2
Agenda
Main Highlights
Group
• Profitability
• Liquidity
• Capital
Portugal
International operations
Conclusions
3
Highlights
• Recurring net income breaks-even in the 4th quarter of 2014.
Profitability
• Consolidated net income for the year strongly improved to -€217.9 million in 2014 from -€740.5
million in 2013.
Improving trend
affirmed
• Excellent performance of operating net income: a more than twofold increase, reflecting a stronger
net interest income (+31.6%) and lower operating costs (-11.2%).
• Net new NPL entries in Portugal 14.7% down from 2013.
• Increased Customers’ deposits, 2.5% up on a comparable basis.
Liquidity
Healthy balance
sheet
Capital
Already reflects
impacts of AQR and
from Pension
Fund’s revised
assumptions
• Narrowing commercial gap. Net loans as a percentage of deposits down to 109% (BoP criteria),
compared to 117% at year-end 2013 and to the recommended 120%. Net loans down to 102% as a
percentage of total balance sheet Customer funds.
• ECB funding usage at €6.6 billion (€1.5 billion of which related to TLTRO), down from €10.0 billion at
end-2013. Full reimbursement of State-guaranteed issues.
• Common equity tier 1 ratios at 12.0% according to phased-in criteria and at 8.9% on a fullyimplemented basis (reflecting the new regime for deferred tax assets).
• Focus on the early accomplishment of key commitments with DG Comp and included in the strategic
plan, as €2,250 million CoCos were reimbursed in 2014. Involvement of the Portuguese state at €750
million at the end of 2014, significantly down from the initial €9 billion (inclusive of CoCos and
Guarantees).
4
Highlights
Net income
Recurring net income
reaches break-even
in 4Q14
(Million euros)
Contribution of the international operations
(Million euros)
+13.1%
201.5
178.2
-217.9
-740.5
+522.5
2013
Includes up-front effect on
DTAs, influenced by the
reduction of the statutory tax
rate (-€83.5 million)
2013
2014
Banking income in Portugal
2014
Operating costs in Portugal*
(Million euros)
(Million euros)
+49.5%
-19.1%
1,355.9
852.9
907.0
690.2
2013
2014
* Operating costs decreased 5.9% in Portugal excluding specific non recurring items.
2013
2014
5
Highlights
Net interest income per quarter
New entries in NPL in Portugal, net of recoveries
(Million euros)
(Million euros)
325
634
295
234
179
234
236
-14.7%
541
260
201
1Q13 2Q13 3Q13 4Q13 1Q14 2Q14 3Q14 4Q14
Loans to deposit ratio*
Net loans to BS Customer funds
108%
Dec 13
2014
Capital ratios (CET1 – CRD IV / CRR)
(%)
117%
2013
-8pp
(%)
12.0%
8.9%
109%
102%
Dec 14
* Calculated based on Customer deposits and net loans to Customers (BoP criteria).
fully
implemented*
phased-in
* Reflecting the new regime for deferred tax assets.
6
Agenda
Main Highlights
Group
• Profitability
• Liquidity
• Capital
Portugal
International operations
Conclusions
7
Net income before income tax showing recovery…
(million euros)
Net interest income
2013
2014
C
848.1
1,116.2
268.1
-269.0
-192.5
-180.0
-158.1
89.0
34.4
663.0
258.2
680.9
495.4
17.9
237.2
-59.4
19.6
69.4
79.0
69.4
1,769.3
2,292.5
523.2
-767.5
-527.8
-1,295.2
-635.6
-514.0
-1,149.6
131.8
13.8
145.6
Operating net income (before impairment and provisions)
474.1
1,142.9
668.8
Loans impairment (net of recoveries)
-820.8
-1,107.0
-286.2
-313.5
-313.5
Of which: costs related with hybrids instruments (CoCo's)
Of which: liability management 2011
Net fees and commissions
Other operating income
Of which: sale of loans portfolio
Of which: capital gain of insurance sale
Banking income
Staff costs
Other administrative costs and depreciation
Operating costs
Of which: impairment related with capital exercise (AQR) in 3Q14
Other impairment and provisions
-465.8
-209.3
256.5
Net income before income tax
-812.5
-173.4
639.1
210.8
-93.7
-45.0
97.7
-110.1
-32.1
-113.1
-16.4
12.9
-740.5
-217.9
522.5
Income taxes
Not-controlling interests
Net income from discontinued or to be discontinued operations
Net income
8
… but still affected by relevant factors
(Million euros)
Net income
Relevant factors with impact on net income
Consolidated
Net of taxes* (gross)
-217.9
+522.5
* Considering the marginal tax rate.
Hybrids (CoCos) interest (-180.0)
-111.5
Liability management 2011 (-158.1)
-221.0
AQR-related impairment in 3Q14 (-313,5)
-32.1
-740.5
2013
-126.9
2014
Income arising from discontinued operations
-491.5
9
Recurring net income breaks-even in 4Q14
(million euros)
4Q14
Net interest income
Net fees and commissions
Other operating income
Banking income
325.2
174.7
70.6
570.5
Staff costs
Other administrative costs and depreciation
Operating costs
-157.6
-134.5
-292.0
Operating net income (before impairment and provisions)
278.4
Loans impairment (net of recoveries)
-232.5
Of which: impact from the devaluation of listed collaterals in 4Q14
-53.8
Other impairment and provisions
-66.3
Net income before income tax
-20.3
Income taxes
Not-controlling interests
Net income from discontinued or to be discontinued operations
10.4
-28.2
1.9
Net income before impact from reduction of corporate tax rate
-36.2
Net income
Net impact from reduction of corporate tax rate
-83.5
Net of taxes impact from listed
collateral devaluation
-38.0
Impact from reduction of
corporate tax rate
-83.5
Recurring Net income
+1.8
Net income
Net income excluding impact from reduction of corporate tax rate
and devaluation of listed collaterals in 4Q14
-119.7
+1.8
Recurring net income before
taxes:+33.5
-119.7
10
Net interest income increases, particularly in Portugal
(Million euros)
Portugal
Net interest income
Consolidated
+31.6%
+53.7%
1,116.2
527.0
343.0
848.1
2013
2014
International operations
+16.6%
505.1
2013
2014
NIM
1.12%
1.56%
NIM (excluding CoCos)
1.48%
1.81%
2013
589.1
2014
11
Increase in fees and commissions driven by international operations
(Million euros)
+5.9% excluding effect
of regulatory changes
Portugal
Fees and Commissions
Consolidated
+0.7%
2013
2014
YoY
Banking fees and commissions
538.5
545.1
1.2%
Cards and transfers
181.1
193.6
6.9%
Loans and guarantees
154.5
159.6
3.3%
72.5
72.7
0.3%
Current account related
105.1
76.6
-27.1%
State guarantee
-60.1
-22.7
62.2%
85.4
65.2
-23.6%
124.4
135.7
9.1%
Securities operations
91.4
97.0
6.2%
Asset management
33.1
38.7
17.2%
663.0
680.9
2.7%
Bancassurance
Other fees and commissions
Market related fees and commissions
Total fees and commissions
430.3
433.2
2013
2014
International operations
+6.5%
232.7
247.7
2013
2014
12
Increased net trading income in Portugal, benefiting from gains in
public debt portfolio
(Million euros)
Portugal
Net trading income
Consolidated
As of 31 December 2014, there are still €316
million potential gains on the investment
portfolio (AFS/HTM) of Portuguese public
debt
+67.4%
+117.4 %
343.7
158.1
442.2
Sale of loan
portfolios
264.2
2013
2014
-59.4
+19.6
Internacional operations
-7.1%
2013
2014
106.1
98.5
2013
2014
13
Reduction of costs in Portugal
(Million euros)
Portugal*
Operating costs*
Consolidated
1,176.2
68.1
-2.3%
1,149.6
65.5
733.8
-5.9%
690.2
-3.8%
457.5
448.5
-2.0%
2013
2014
International operations
650.6
-2.3%
635.6
+3.9%
442.4
2013
459.4
2014
Depreciation
Other administrative costs
Staff costs
2013
* Excluding non-recurring specific items: restructuring costs (+€126.5 M in 2013) and amendment of the mortality allowance calculation formula (-€7.5 M in 2013) .
Operating costs decreased 19.1% in Portugal including specific non recurring items.
2014
14
Increased provisioning due to specific impacts
(Million euros)
Portugal
Loan impairment (net of recoveries)
Consolidated
137bp
Cost of
risk
+37.5%
194bp
1,021.0
742.8
1,107.0
820.8
2013
2013
2014
Cost of risk evolution
(basis points)
186
2011
157
2012
137
2013
130
2014
International operations
Strategic
plan
194
Excluding:
- one-off AQR
(3Q14)
- Devaluation of
collaterals
(4Q14)
2014
~ 100
2015
+10.5%
78.1
86.2
2013
2014
15
Higher coverage ratios, resulting from lower entries in NPL and higher
provision charges
(Million euros)
Consolidated
Net entries in NPL in Portugal
Credit quality
Credit ratio
634
-14.7%
541
2013
2014
Dec 13
Dec 14
NPL
11.0%
11.5%
Credit at risk
11.8%
12.0%
6,586
6,580
Dec 13
Dec 14
NPL (nonperforming
loans)
Loan impairment provisions (balance sheet)
Coverage ratio
Dec 13
Dec 14
NPL
51%
53%
Credit at risk
48%
51%
3,381
3,483
Net entries in NPL in Portugal decreased 14,7% year-onyear
NPL ratio at 11.5% with NPL coverage at 53% at yearend 2014; Credit at risk at 12.0% with risk coverage at
51% as of the same date
Coverage of credit at risk (by BS impairment and real
and financial guarantees) at 106% (101% in 2013)
Dec 13
Dec 14
On a comparable basis: excludes Romania and Millennium bcp Gestão de Activos (following the discontinuation processes).
16
Diversified and collateralized credit portfolio
Consolidated
Loan portfolio
Companies
48%
Loans per collateral
Mortgage
45%
58%
Real guarantees
35%
Other guarantees
8%
Unsecured
LTV of mortgage in Portugal
14%
9%
0-40
40-50
12%
50-60
25%
60-75
10%
17%
13%
75-80
80-90
>90
Consumer
7%
Loans to companies represent 48% of total loan portfolio. Decreased weight of construction and
real estate sectors (11% at the end of 2014, compared with 12% at the end of 2013)
93% of the loan portfolio is collateralized
Mortgage loans account for 45% of the total loan portfolio, with low delinquency and an
average LTV of 66%
On a comparable basis: excludes Romania and Millennium bcp Gestão de Activos (following the discontinuation processes).
17
Agenda
Main Highlights
Group
• Profitability
• Liquidity
• Capital
Portugal
International operations
Conclusions
18
Deposits increase both in Portugal (individuals and companies) and
in international operations
(Million euros)
Customer funds
Consolidated
Individuals’ and
companies’ deposits
up 7% from 2013
Customer deposits in Portugal
+0.7%
33,911
64,739
64,261
11,868
12,146
3,797
2,776
+1.5%
9,385
+4.1%
2,345
9,768
20,592
+8.3%
22,295
3,934
Dec 13
33,024
33,359
34,408
Individuals
Dec 14
Companies
Other (includes
public sector)
Customer deposits in international operations
+2.5%
+4.9%
15,236
16,793
Dec 13
Dec 14
On-demand deposits
Other BS Customer funds
Term deposits
Off BS Customer funds
On a comparable basis: excludes Romania and Millennium bcp Gestão de Activos (following the discontinuation processes).
14,684
15,409
Dec 13
Dec 14
19
No significant changes to credit performance
(Million euros)
Portugal
Loans to Customers (gross)
Consolidated
New production of
loans to individuals
increases 21% vs 2013
-4.3%
47,251
59,734
57,168
-4.7%
1,295
45,956
43,784
26,444
25,545
Dec 13
3,493
Write-offs and
Dec 13
sales
comparable
Dec 14
4,037
International operations
29,797
Dec 13
Mortgage
+7.2%
27,586
12,483
13,385
Dec 13
Dec 14
Dec 14
Consumer
Companies
On a comparable basis: excludes Romania and Millennium bcp Gestão de Activos (following the discontinuation processes).
20
Continued improvement of the liquidity position. Current liquidity
ratios in excess of future requirements
Loans to deposit ratio** (BoP)
Commercial Gap*
(Billion euros)
Difference between BS
Customer funds and net loans
Dec 13
Dec 14
-4.0
-1.1
Net loans to BS Customer funds
117%
108%
-3.9
-7.8
+4.0
114%
NSFR (Net stable funding
ratio)
136%
LCR (Liquidity coverage
ratio)
* Calculated based on Customer deposits and net loans to Customers.
** According to Banco of Portugal criteria.
*** Estimated in accordance with CRD IV current interpretation.
109%
102%
Dec 13
Liquidity ratios (CRD IV/CRR***)
-8pp
Dec 14
Commercial gap improved €4.0 billion in the last year
Loans to deposit ratio (BoP criteria) at 109%, 102% if
all BS Customer funds area included
Net usage of ECB funding at €6.6 billion, compared to
€10.0 billion as at the end of 2013
€14.2 billion (net of haircuts) of eligible assets
available for refinancing operations with ECB, with a
€7.6 billion buffer
Liquidity ratios (CRD IV/CRR***) higher than the
required 100%
21
Lower refinancing needs in the medium to long term. Customer
deposits are the main funding source
Refinancing needs of medium-long term debt
(Billion euros)
Already repaid
5.2
5.5 **
4.9
3.0
2.9*
1.1
2009
2010
2011
2012
2013
2014
0.4
0.6
2015
2016
1.8
2017
0.6
>2017
Improvement of the funding structure
Customer deposits
67%
75%
Other financing
Reduction of funding needs,
reflecting a lower commercial gap
Customer deposits are the main
source of funding
33%
25%
Dec 13
Dec 14
Includes repurchase of own debt amounting to 0.5 billion euros.
** Includes repayment of 1.6 billion euros related to liability management transactions.
22
Agenda
Main Highlights
Group
• Profitability
• Liquidity
• Capital
Portugal
International operations
Conclusions
23
Capital ratios comply with regulatory requirements
CET I ratio – CRD IV/CRR (fully-implemented)*
9.3%
8.9%
1 Jan 14
Dec 14
46,757
43,261
RWA (M €)
RWA (M €)
Historical evolution of core tier I ratio in BCP (%)
+9pp
13.7%
2004
2006
2008
* Reflecting the new regime for deferred tax assets.
2010
1 Jan 14
Dec 14
45,500
42,200
Capital ratios influenced by the following factors in 2014:
− Revised pension fund assumptions as a result of lower market
yields (impact: -110 basis points)
Common equity tier I ratio (CRD IV/CRR) at 8.9% under fullyimplemented* principles, and at 12.0% according to phased-in
criteria
≈5.0%
2002
12.0%
− Increased operating results and contribution from minorities
≈6.0%
2000
12.2%
− Negative effect of the AQR accounting, mitigated by the
reduction of the difference between expected losses and
impairment
≈9.0%
4,7%
CET I ratio – CRD IV/CRR (phased-in)
2012
2014
Capital ratios at the highest levels in the history of BCP
24
Revised pension fund assumptions, resulting from lower market
yields, with impact in capital ratios
Revision to pension fund assumptions
Pension Fund
(Million euros)
Shares 24%
€600M
2,533
+769
-169
3,133
Loans and
advances to
credit inst.
and others
37%
Properties
10%
Liabilities
with pensions
Dec13
Discount rate
revision
(from 4% to 2.5%)
Revision of
salary and
pension growth
rates, others
Bonds 29%
Liabilities with
pensions
Dec14
Pension liabilities coverage at 110%
Impact in capital
Impact of revised assumptions
-574
Excess return over assumption
+97
Total
-477
Actuarial differences in 2014
penalised by the decrease in the
discount rate to 2.5% (-€769 million),
and benefited by fund’s performance
of 8.1% and by changes to other
assumptions
-110 basis points in capital ratios
25
Agenda
Main Highlights
Group
• Profitability
• Liquidity
• Capital
Portugal
International operations
Conclusions
26
Portugal: deleveraging effort
(Million euros)
Individuals’ and
companies’ deposits
up 7% from 2013
Customer funds
Loans to Customers (gross)
New production of
loans to individuals
increases 21% vs 2013
-0.5%
48,128
47,881
10,528
10,800
3,689
2,673
24,880
24,334
9,031
10,074
Dec 13
Dec 14
On-demand deposits
Other BS Customer funds
Term deposits
Off BS Customer funds
-7.3%
47,251
43,784
19,916
19,142
2,162
2,502
25,173
22,139
Dec 13
Dec 14
Mortgage
On a comparable basis: excludes Romania and Millennium bcp Gestão de Activos (following the discontinuation processes).
Consumer
Companies
27
Net income improves, as banking income increases and
operating costs decrease
(Million euros)
Net income
Improved net income, resulting from an
increased banking income and a reduction in
operating costs
-387.3
Lower operating costs, as the implementation
of the restructuring programme started at the
end of 2012 yields visible savings
-873.6
2013
Banking income
2014
Operating costs
+49.5%
1,355.9
-19.1%
852.9
907.0
2013
The increase in banking income reflects higher
net interest and trading income
690.2
2014
2013
2014
28
Net interest income in Portugal reflects the improvement
in cost of deposits, although impacted by lower loan volumes
Net interest income
(Million euros)
176
144
106
64
77
96
97
111
4Q14 vs.
3Q14
2014
vs.2013
+7.5
+172.9
+14.9
+89.0
-5.3
-119.1
+12.3
+17.1
0.0
+34.4
+2.7
-10.2
+32.1
+184.1
Cost of deposits effect
CoCos effect
Performing loans volume effect
NPL effect
2011 liability management effect
Others
1Q13 2Q13 3Q13 4Q13 1Q14 2Q14 3Q14 4Q14
Total
Net interest income increased both quarter-on-quarter and year-on-year, driven by:
–
Cost of deposits: consistent reduction of term deposits spread, positively impacting net
interest income
–
Lower amount of CoCos: reimbursement of 400 million euros in April and of 1,850 million
euros in August 2014
–
Reduction in loan volumes: still penalizes net interest income
29
Continued strong efforts to reduce the cost of deposits, in line
with strategic plan
Term deposits rate
Credit portfolio rate
(%)
(%)
5.0%
Companies
5.0%
New Production
4.0%
Portfolio
3.0%
4.0%
3.0%
2.0%
2.0%
1.0%
1.0%
0.0%
Mortgage
0.0%
S/11D/11M/12J/12S/12D/12M/13J/13S/13D/13M/14J/14S/14D/14
Evolution of term deposit spreads in Portugal
(basis points)
2012
2013
2014
(173)
2015
~(150)
(239)
(310)
Strategic
plan
D-12
M-13
J-13
S-13
D-13
M-14
J-14
S-14
D-14
Continued effort to bring the cost of
deposits down: new deposits with
substantially lower rates when
compared to previous years
Exactly in line with strategic plan
target of improving spreads on
deposits
Spreads on
remain high
loans
to
companies
30
Strong performance of market commissions, lower banking fees
(Million euros)
2013
2014
YoY
370.0
368.0
-0.6%
92.8
103.6
11.6%
125.2
119.0
-4.9%
72.5
72.7
0.3%
Current account related
105.1
76.5
-27.3%
State guarantee
-60.1
-22.7
62.2%
Other fees and commissions
34.5
18.8
-45.5%
Market related fees and commissions
60.3
65.2
8.2%
Securities operations
53.8
57.7
7.3%
6.5
7.5
15.6%
430.3
433.2
0.7%
Banking fees and commissions
Cards and transfers
Loans and guarantees
Bancassurance
Asset management
Total fees and commissions
31
Continued reduction in costs in Portugal, on target with strategic goals
(Million euros)
Employees
Operating costs*
-5.9%
733.8
Other
administrative
costs
Staff costs
690.2
38.2
Depreciation
8,584
-15.2%
263.0
-6.1%
432.6
-816
32.4
246.9
7,768
410.8
-5.0%
Dec 13
2013
2014
Operating costs evolution*
910.4
2011
864.8
2012
Strategic
Plan
7,500
690.5
~660
2013
2014
2015
Dec 17
695
Strategic
Plan
700
Dec 14
Dec 15
Branches
-79
Strategic
Plan
733.8
Dec 14
774
Dec 13
* Excluding the impact of specific items. Operating costs decreased 19.1% in Portugal including specific non recurring items.
32
Continued increase of core income and reduction of operating
costs in Portugal
Core Income*
Operating costs*
(Million euros)
(Million euros)
288
169
189
212
204
201
224
247
185
185
183
181
173
Commissions
179
166
173
Net Interest
Income
1Q13 2Q13 3Q13 4Q13 1Q14 2Q14 3Q14 4Q14
1Q13 2Q13 3Q13 4Q13 1Q14 2Q14 3Q14 4Q14
Core income* and operating costs*
Largest banks operating in Portugal
(1st quarter 2013 = 100)
Operating costs cccumulated evolution 2012-2014*
170
111
125 120 119
132
+14%
Core income
146
+3%
+77pp
-5%
100
98
97
93
96
89
93
1Q13 2Q13 3Q13 4Q13 1Q14 2Q14 3Q14 4Q14
Operating
costs
-2%
-20%
BCP
B1
B2
* Excludes non recurring specific items. 2014 figures were annualized based on the last interim figures reported. Figures related to the activity in Portugal were
considered, whenever available.
B3
B4
33
Credit quality shows signs of stabilization
(Million euros)
Credit quality
Credit ratio
Loan impairment provisions (balance sheet)
Dec 13
Dec 14
NPL
13.1%
14.0%
Credit at risk
13.6%
14.1%
Provision coverage ratio
NPL
48%
49%
Credit at risk
46%
49%
6,134
2,953
3,034
Dec 13
Dec 14
Dec 13
Dec 14
Loan impairment (net of recoveries)
Dec 14 vs.
Dec 13
Dec14 vs.
Sep 14
6,213
6,287
+/- Net entries
+541
-3
- Write-offs
-550
-149
-70
-0.1
6,134
6,134
NPL evolution detail
Initial stock
Final stock
Dec 14
6,213
NPL (non performing loans)
- Sales
Dec13
157 bp
743
2013
Cost of
risk
233 bp
Excluding
one-offs
150 pb
1,021
2014
34
Reduction of foreclosed assets and sale above book value,
confirming appropriate coverage
Foreclosed assets portfolio
Number of properties sold
(Million euros)
Coverage
-35.0%
26.5%
1,395
3,434
17.9%
2,233
1,442
258
370
2013
2014
Book value of sold properties
(Million euros)
1,025
1,184
-20.9%
306
242
dec 13
dec 14
Impairments
Net value
Sale value
2013
2014
285
261
35
Agenda
Main Highlights
Group
• Profitability
• Liquidity
• Capital
Portugal
International operations
Conclusions
36
Significant net income growth in international operations
(Million euros)
2013
International operations*
C%
2014 local
currency
C%
euros
ROE
13.1%
178.2
201.5
127.8
155.2
21.5%
22.1%
12%
Mozambique
82.4
88.5
7.4%
3.4%
23%
Angola
40.1
51.2
27.6%
25.5%
18%
-72.1
-93.4
Poland
Other and non-controlling interests
€295 million
Note: subsidiaries’ net income presented for the 2013 at the same exchange rate as for the 2014, in order to allow comparison without exchange rate effect
* Excludes Banca Millennium (Romania)
37
Poland: Customer funds and loans to Customers growth
(Million euros)
Loans to Customers (gross)
Customer funds
+4.8%
12,139
Dec 13
+ 5.6%
12,719
10,648
10,081
Dec 14
6,317
+0.5%
6,351
959
+ 19.0%
1,142
2,805
+ 12.5%
3,155
Dec 13
Mortgage
FX effect excluded. €/Zloty constant in December 2014: Income Statement 4.19291667; Balance Sheet 4.2732
Dec 14
Consumer
Companies
38
Net income growth driven by higher banking income and stable
operating costs
(Million euros)
Net income
+ 21.5%
155.2
127.8
Net income grows 21.5%, with ROE of 11.8%
Banking income increase (+10.4%): increase of
15.3% in net interest income and 3.9% in
commissions
Stable operating costs (+2.0%), reflecting a strict
cost control policy
2013
2014
Banking income
Operating costs
+ 10.4%
478.5
528.4
2013
2014
FX effect excluded. €/Zloty constant in December 2014: Income Statement 4.19291667; Balance Sheet 4.2732
+2.0%
259.9
265.1
2013
2014
39
Strong increase in core income, stable operating costs
(Million euros)
Operating costs
Net interest income*
+15.3%
+2.0%
349.4
259.9
265.1
129.4
134.6
130.5
130.5
2013
2014
303.1
2013
2014
Other administrative costs and depreciation
Fees and commissions
Staff costs
+3.9%
140.4
145.9
Employees
5,881
2013
2014
Dec 13
+227
Branches
6,108
Dec 14
-16
439
423
Dec 13
Dec 14
* Pro forma data. Margin from derivative products, including those from hedging FX denominated loan portfolio, is included in net interest income, whereas in
accounting terms, part of this margin (12.1M€ in 2013 and 2.6M€ in 2014) is presented in net trading income.
FX effect excluded. €/Zloty constant in December 2014: Income Statement 4.19291667; Balance Sheet 4.2732
40
Stable credit quality, high coverage level
(Million euros)
Credit quality
Loan impairment (balance sheet)
Credit ratio
NPL
Dec 13
Dec 14
2.9%
3.0%
Coverage ratio
NPL
Dec 13
Dec 14
106%
101%
307
318
Dec 13
Dec 14
314
289
Loan impairment (net of recoveries)
56 bp
Dec 13
Dec 14
Cost of
risk
61 bp
55.8
63.3
2013
2014
NPL (non performing loans)
FX effect excluded. €/Zloty constant in December 2014: Income Statement 4.19291667; Balance Sheet 4.2732
41
Millennium bank’s CHF-denominated mortgage portfolio is
solid; a set of risk-mitigating measures has been designed
Millennium bank
Comparison of CHF vs. PLN installment, in PLN
The Fx-denominated mortgages portfolio of Millennium
bank totalled CHF 5 billion (€4.2 billion) at year-end
2014, with an average 1.4% spread and low
delinquency (impired credit below 2%)
Average instalment is up by 12%. This is lower than
the increases seen both in 2008 and in 2011 (+23% and
+16%, respectively)
+12%
1,217
1,179
1,220
+16%
+23%
+3%
+25%
971
971
Original DTI: 35%
Simulated** Current DTI: 28%
1st Instalment in CHF loan (in PLN)
Instalment in CHF loan (in PLN)
Wage growth in Poland over the last years has resulted
in a simulated debt service to income ratio of 28%**,
lower than 35% at origination
A set of measures has been designed to mitigate
Customers’ non-performance risk, complying with
Polish supervisor authorities recommendations. These
include special pricing on converting loans to local
currency and a more flexible approach to Customers
under risk of default
4Q06
2Q07
4Q07
2Q08
4Q08
2Q09
4Q09
2Q10
4Q10
2Q11
4Q11
2Q12
4Q12
2Q13
4Q13
2Q14
4Q14
2Q15
1st Instalment in similar PLN loan
Instalment in similar PLN loan
Installments to be paid from 2Q 2015 will benefit from
a historically low CHF Libor, offsetting part of the
exchange rate impact: the average installment is
expected to increase by 3% from December 2014
* At current exchange rate and real-estate prices.
** Percentage of Customer’s income used to service loan, installment and income updated to most recent figures.
42
Mozambique: strong volume growth
(Million euros)
Customer funds
Loans to Customers (gross)
+19.2%
1,932
+17.8%
1,481
1,621
44
1,257
24
289
+6.2%
272
961
Dec 13
Dec 14
Dec 13
Mortgage
FX effect excluded. €/Metical constant as at December 2014: Income Statement 41.58166667; Balance Sheet 40.4700
+19.5%
1,148
Dec 14
Consumer
Companies
43
Net income benefited from increased banking income
(Million euros)
Net income
Net income increases 7.4%, with ROE at 22.6%
+7.4%
88.5
82.4
Increase of 10.3% in banking income: net interest
income up by 15.6%, benefitting from business
expansion, and 9.1% increase in commissions
Operating costs up by 9.9% (+9 branches compared
to December 13)
2013
2014
Banking income
Operating costs
+10.3%
202.1
+9.9%
223.0
90.0
2013
2014
FX effect excluded. €/Metical constant as at December 2014: Income Statement 41.58166667; Balance Sheet 40.4700
2013
98.9
2014
44
Consistent increase in net interest income and commissions
(Million euros)
Operating costs
Net interest income
+15.6%
121.6
+9.9%
140.6
98.9
90.0
10.8
9.0
2013
2014
+9.1%
45.3
42.8
46.5
2013
2014
2014
Branches
Employees*
2,329
2013
41.5
Depreciation
Staff costs
Other administrative costs
Fees and commissions
41.5
38.2
Dec 13
+38
2,367
Dec 14
157
Dec 13
+9
166
Dec 14
* Excludes employees from SIM (insurance company)
FX effect excluded. €/Metical constant as at December 2014: Income Statement 41.58166667; Balance Sheet 40.4700
45
Credit quality and coverage
(Million euros)
Credit quality
Loan impairment (balance sheet)
Credit ratio
NPL
Dec 13
Dec 14
3.9%
4.1%
Coverage ratio
NPL
Dec 13
Dec 14
151%
127%
73
78
Dec 13
Dec 14
61
49
Loan impairment (net of recoveries)
88 bp
Dec 13
Dec 14
Cost of
the risk
84 bp
10.7
12.0
2013
2014
NPL (non performing loans)
FX effect excluded. €/Metical constant as at December 2014: Income Statement 41.58166667; Balance Sheet 40.4700
46
Angola: strong volume growth
(Million euros)
Customer funds
Loans to Customers (gross)
+10.6%
1,452
1,313
+44.9%
1,005
694
Dec 13
Dec 14
FX effect excluded. €/Kwanza constant as at December 2014: Income Statement 130.35875000; Balance Sheet 124.900
Dec 13
Dec 14
47
Net income increase driven by higher banking income
(Million euros)
Net income
Net income increases 27.6%, with ROE at 18.4%
+27.6%
51.2
40.1
Increase of 11.7% in banking income: net interest
income up by 32.3%, reflecting business
expansion, with commissions up by 7.6%
Operating costs increased by 7.7%, as a result of
network expansion (+6 branches from December
2013)
2013
Banking income
2014
Operating costs
+11.7%
147.5
132.1
2013
2014
FX effect excluded. €/Kwanza constant as at December 2014: Income Statement 130.35875000; Balance Sheet 124.900
+7.7%
69.7
75.0
2013
2014
48
Strong growth in core income and operating costs in line with
network expansion
(Million euros)
Operating costs
Net interest income
+32.3%
88.1
+7.7%
69.7
66.6
2013
2014
75.0
7.2
8.8
33.6
34.1
28.8
32.1
2013
2014
Depreciation
Staff costs
Other administrative costs
Fees and commissions
+7.6%
29.5
Employees
31.8
1,075
2013
2014
+68
Dec 13
FX effect excluded. €/Kwanza constant as at December 2014: Income Statement 130.35875000; Balance Sheet 124.900
Branches
1,143
82
Dec 14
Dec 13
+6
88
Dec 14
49
Credit quality and coverage
(Million euros)
Credit quality
Credit ratio
NPL
Loan impairment (balance sheet)
Dec 13
Dec 14
4.7%
6.4%
Coverage ratio
NPL
Dec 13
Dec 14
114%
75%
49
37
65
dez 13
33
Loan impairment (net of recoveries)
160 bp
Dec 13
dez 14
Dec 14
NPL (non performing loans)
FX effect excluded. €/Kwanza constant as at December 2014: Income Statement 130.35875000; Balance Sheet 124.900
Cost of
risk
102 bp
10.7
9.8
2013
2014
50
Agenda
Main Highlights
Group
• Profitability
• Liquidity
• Capital
Portugal
International operations
Conclusions
51
Progress on strategic plan metrics
Phases
Demanding
economic
environment
(2012-13)
Creating
growth and
profitability
conditions
(2014-15)
Priorities
Stronger balance sheet
Recovery of profitability in
Portugal
2014
2015
CET1
na
12.0%
>10%
(phased-in)
(fully
implemented)
na
8.9%*
LTD**
108%
102%
C/I***
Oper.
costs***
Continued development of
business in Poland,
Mozambique and Angola
Sustained
growth
(2016-17)
2013
Sustained net income growth,
greater balance between
domestic and international
operations
…
66%
€734m
52%
€690m
…
…
…
Initiatives
Capital ratios in excess of
requirements, reflecting rights
issue, insurer sale, securitisation
and sale of Romanian operation
<110%
Deleveraging and increased
Customers’ funds, leading to
strengthened liquidity
≈50%
Improved efficiency, stemming
from increased banking income
(inc. gain on sale of sovereign debt
portfolio) and cost reduction
≈€660m
Restructuring programme from
end-2012. Savings already clearly
visible
Cost of
risk
(bps)
137
194
…
≈100
Increased cost of risk due to AQR
impact. Goal for 2015 not at risk,
as new NPL entries still going
down
ROE****
-26%
-6%
…
≈7%
Increased contribution from
international operations,
recovery in Portugal
Positive earnings trend affirmed, aligned with strategic plan of creating conditions for profitability in Portugal and
sustained growth in Poland, Mozambique and Angola, as specific items do not risk a solid capital position
* Reflecting the new regime for deferred tax assets.| ** Loans to deposits ratio calculated based on net loans to Customers and on balance sheet Customer funds.
*** On a comparable basis. | **** 2015 adjusted for excess capital vs 10%.
52
Appendixes
53
Sovereign debt portfolio
(Million euros)
Sovereign debt portfolio
Total sovereign debt maturity
Dez 13 Sep 14 Dez 14
C%
annually
Portugal
5,879
5,133
4,688
-20%
-9%
T-bills
2,178
1,055
815
-63%
-23%
Bonds
3,701
4,078
3,873
5%
-5%
Poland
1,366
1,568
1,820
33%
16%
Mozambique
393
470
587
49%
25%
Angola
319
412
367
15%
-11%
Others
375
192
130
-65%
-32%
8,332
7,776
7,592
-9%
-2%
Total
<1 year
23%
C%
quarterly
>3 years
50%
>1 year and
<2 years
9%
>2 years and
<3 years
18%
Total sovereign debt at 7.6 billion euros, of which 1.7 billion euros maturing up to one year
Portuguese sovereign debt decreased, whereas exposure to Polish, Mozambican and Angolan have increased
from December 2013
54
Sovereign debt portfolio details
(Milhões de euros)
Portugal
Poland
Trading book
< 1 year
> 1 year and <2 years
> 2 year and <3 years
> 3 years
194
4
10
0
180
218
1
61
40
117
AFS book
< 1 year
> 1 year and <2 years
> 2 year and <3 years
> 3 years
2,627
893
160
681
893
1,601
39
426
442
694
HTM book
< 1 year
> 1 year and <2 years
> 2 year and <3 years
> 3 years
1,867
83
0
0
1,784
0
0
0
0
Total
< 1 year
> 1 year and <2 years
> 2 year and <3 years
> 3 years
4,688
981
170
681
2,856
1,820
39
487
483
811
Mozambique
Angola
Others
Total
0
0
0
0
0
0
0
0
73
0
0
73
0.0047
486
5
71
114
296
587
472
4
110
0
367
217
58
30
61
7
5
0
0
1
5,189
1,627
648
1,264
1,650
0
0
0
0
50
0
0
0
50
1,917
83
0
0
1,834
367
217
58
30
61
130
5
0
73
52
7,592
1,715
719
1,378
3,780
0
0
0
0
0
587
472
4
110
0
55
Pension Fund
Assumptions
Discount rate
Dec 13
Jun 14
Dec 14
4.00%
3.50%
2.50%
1.00% until 2016
0.75% until 2017
1.75% after 2016
1.00% after 2017
0.00% until 2016
0.00% until 2017
0.75% after 2016
0.50% after 2017
Salary growth rate
Pensions growth rate
Projected rate of return of fund assets
4.00%
3.50%
2.50%
Mortality Tables
Men
TV 73/77 -1 year
TV 73/77 -2 years
Women
Tv 88/90 -2 years
Tv 88/90 -3 years
56
The Angolan economy is increasingly diversified; BMA’s exposure
to the oil industry is immaterial
The fiscal and budget mechanisms implemented by the
Angolan Government during the last oil crisis (2009) allowed
GDP growth not do drop below reasonable levels and
permitted roughly stable exchange rates;
Main macroeconomic indicators
2008
2009
Ch.%
2014f
Oil price (USD/barrell)
96.8
62.7
-35%
98.9
Real GDP (percent change)
13.8
2.4
-11.4
3.9
5.9
Exports (percent change)
10.1
-2.6
-12.7
-2.9
2.8
Investment (% of GDP)
16.2
15.2
-1.0
14.8
14.6
Official exchange rate (average,
kwanzas per U.S. dollar)
75.0
79.3
-6%
98.3
Consumer prices (annual avg %)
12.4
13.7
+1.3
7.3
7.3
Overall fiscal balance (% of GDP)
-4.5
-7.4
-2.9
-4.1
-4.2
16,186
13,617
-16%
27,346
35,113
Gross international reserves (end of
period, USD mln)
Breakdown of Angola’s GDP
11,984
42%
44%
56%
2007
The weight of the oil industry has decreased, and should
account for 35% of Angola’s GDP in 2015 (compared to 58% in
2008);
BMA’s exposure to the oil industry accounts for less than 1%
of its highly-diversified loan portfolio;
BMA’s delinquency levels are significantly below Angolan
banking industry average.
12.917
58%
2008
5,989
59%
63%
14.167
Mining
Oil/Gas
65%
15%
Other
33%
…
44%
46%
2009
…
37%
Trade
Food industry
35%
3%
1%
11%
2013E
2014P
2015P
Individuals
Source: International Monetary Fund – September 2014; National Bank of Angola; Business Monitor
BMA
Peso no
Grupo
Total assets
1,950
2.5%
Gross loans
1,005
1.8%
Deposits
1,452
2.9%
Sh. Equity
315
3.7%*
3%
Construction
15%
41%
BMA’s weight in BCP Group
(Million euros)
0%
6,316
4,637
Angola has today international currencies’ reserves in excess
of USD 27 bln, well above 2008;
BMA’s loans portfolio per sector
(Billion Kwanzas)
Oil
Non-oil
2015f
19%
Transport
*BCP’s stake: 50.1%
Services
57
Financial Statements
58
Consolidated Balance Sheet and Income Statement
2014
2014
2013
2013
(Thousands of Euros)
(T housands of Euros)
Assets
Cash and deposits at central banks
Loans and advances to credit institutions
Repayable on demand
Other loans and advances
Loans and advances to customers
Financial assets held for trading
Financial assets available for sale
Assets with repurchase agreement
Hedging derivatives
Financial assets held to maturity
Investments in associated companies
Non current assets held for sale
Investment property
Property and equipment
Goodwill and intangible assets
Current tax assets
Deferred tax assets
Other assets
1,707,447
2,939,663
795,774
1,456,026
53,685,648
1,674,240
8,263,225
36,423
75,325
2,311,181
323,466
1,622,016
176,519
755,451
252,789
41,895
2,398,562
784,929
1,054,030
1,240,628
56,802,197
1,290,079
9,327,120
58,268
104,503
3,110,330
578,890
1,506,431
195,599
732,563
250,915
41,051
2,181,405
593,361
76,360,916
82,007,033
Liabilities
Amounts owed to credit institutions
Amounts owed to customers
Debt securities
Financial liabilities held for trading
Hedging derivatives
Provisions for liabilities and charges
Subordinated debt
Current income tax liabilities
Deferred income tax liabilities
Other liabilities
Total Liabilities
10,966,155
49,816,736
5,709,569
952,969
352,543
460,293
2,025,672
31,794
6,686
1,051,592
13,492,536
48,959,752
9,411,227
869,530
243,373
365,960
4,361,338
24,684
6,301
996,524
71,374,009
78,731,225
Equity
Share capital
Treasury stock
Preference shares
Other capital instruments
Fair value reserves
Reserves and retained earnings
Net income for the year attributable to Shareholders
Total Equity attributable to Shareholders of the Bank
Non-controlling interests
Total Equity
3,706,690
(13,547)
171,175
9,853
106,898
449,381
(217,914)
3,500,000
(22,745)
171,175
9,853
22,311
(356,937)
(740,450)
4,212,536
2,583,207
774,371
692,601
4,986,907
3,275,808
76,360,916
82,007,033
Interest and similar income
Interest expense and similar charges
Net interest income
Dividends from equity instruments
Net fees and commission income
Net gains / losses arising from trading and
hedging activities
Net gains / losses arising from available for
sale financial assets
Net gains / (losses) arising from financial
assets held to maturity
Other operating income
Other net income from non banking activity
2,652,638
(1,536,487)
2,832,912
(1,984,825)
1,116,151
848,087
5,888
680,885
3,680
662,974
154,247
80,385
302,407
184,065
(14,492)
(53,299)
(278)
(55,627)
2,191,787
1,723,286
19,278
20,502
2,211,065
1,743,788
635,616
448,451
65,543
767,463
459,653
68,123
Operating costs
1,149,610
1,295,239
Operating net income before provisions and impairments
1,061,455
448,549
(1,106,990)
(91,345)
(36,311)
(145)
(81,473)
(820,827)
(102,193)
(210,471)
(3,043)
(150,059)
(254,809)
(838,044)
35,960
45,445
62,260
(36,759)
(173,404)
(812,543)
(100,995)
198,670
(75,729)
(115,635)
326,434
(601,744)
Total operating income
Staff costs
Other administrative costs
Depreciation
Loans impairment
Other financial assets impairment
Other assets impairment
Goodwill impairment
Other provisions
Operating net income
Share of profit of associates under the equity method
Gains / (losses) from the sale of subsidiaries and other assets
Net (loss) / income before income tax
Income tax
Current
Deferred
Net (loss) / income after income tax from continuing operations
Income arising from discontinued operations
Net income after income tax
Attributable to:
Shareholders of the Bank
Non-controlling interests
Net income for the year
Earnings per share (in euros)
Basic
Diluted
(32,125)
(45,004)
(107,854)
(646,748)
(217,914)
110,060
(740,450)
93,702
(107,854)
(646,748)
(0.005)
(0.005)
(0.022)
(0.022)
59
Consolidated Income Statement
Quarterly evolution
(Million euros)
Quarterly
4Q 13
1Q 14
2Q 14
Year-to-date
3Q 14
4Q 14
Dec 13
Dec 14
C%
14 / 13
Net interest income
234.3
236.4
259.6
295.0
325.2
848.1
1,116.2
31.6%
Dividends from equity instruments
Net fees and commission income
Other operating income
Net trading income
Equity accounted earnings
Banking income
2.0
168.2
-23.2
114.8
15.8
512.0
3.3
164.6
-15.0
111.9
13.1
514.3
2.5
176.5
62.4
63.3
9.9
574.2
0.1
165.0
-13.8
182.0
5.2
633.6
0.1
174.7
-22.2
85.0
7.7
570.5
3.7
663.0
-71.9
264.2
62.3
1,769.3
5.9
680.9
11.4
442.2
36.0
2,292.5
60.0%
2.7%
>100%
67.4%
-42.2%
29.6%
Staff costs
Other administrative costs
Depreciation
Operating costs
263.5
124.3
19.4
407.2
160.2
107.6
15.9
283.6
163.2
113.9
15.9
293.1
154.6
109.7
16.5
280.9
157.6
117.3
17.2
292.0
767.5
459.7
68.1
1,295.2
635.6
448.5
65.5
1,149.6
-17.2%
-2.4%
-3.8%
-11.2%
Operating net income bef. imp.
104.8
230.7
281.1
352.7
278.4
474.1
1,142.9
>100%
Loans impairment (net of recoveries)
Other impairm. and provisions
Net income before income tax
202.2
90.3
-187.7
191.7
59.4
-20.4
179.9
54.6
46.6
502.9
29.0
-179.2
232.5
66.3
-20.3
820.8
465.8
-812.5
1,107.0
209.3
-173.4
34.9%
-55.1%
78.7%
Income tax
Non-controlling interests
Net income (before disc. oper.)
-72.4
26.4
-141.7
-5.4
25.4
-40.4
7.6
27.2
11.7
-173.0
29.3
-35.5
73.1
28.2
-121.6
-210.8
93.7
-695.4
-97.7
110.1
-185.8
53.7%
17.5%
73.3%
-1.4
-0.3
-33.3
-0.5
1.9
-45.0
-32.1
28.6%
-143.1
-40.7
-21.5
-36.0
-119.7
-740.5
-217.9
70.6%
Net income arising from discont. operations
Net income
60
Consolidated Income Statement
(Portugal and International Operations)
For the 12 months period ended 31th December, 2013 and 2014
(Million euros)
Int e rna t io na l o pe ra t io ns
Gro up
D ec 13
D ec 14
P o rt uga l
∆ %
D ec 13
D ec 14
T o tal
∆ %
D ec 13
D ec 14
B a nk M ille nnium ( P o la nd)
∆ %
D ec 13
D ec 14
∆ %
M ille nnium bim ( M o z.)
D ec 13
D ec 14
M ille nnium A ngo la
∆ %
D ec 13
D ec 14
O t he r int . o pe ra t io ns
∆ %
D ec 13
D ec 14
∆ %
Interest inco me
2,833
2,653
-6.4%
1,914
1,699
-11.2%
919
953
3.8%
634
616
-2.8%
183
207
12.7%
92
124
35.3%
9
6
Interest expense
1,985
1,536
-22.6%
1,571
1,172
-25.4%
413
364
-11.9%
345
269
-21.8%
57
66
15.8%
24
36
49.5%
-12
-8
38.6%
N e t int e re s t inc o m e
848
1,116
3 1.6 %
343
527
5 3 .7 %
505
589
16 .6 %
289
347
19 .8 %
12 6
14 1
11.3 %
68
88
3 0 .1%
22
14
- 3 7 .1%
Dividends fro m equity instruments
Int e rm e dia t io n m a rgin
1
-35.0%
4
6
60.0%
2
84.8%
2
4
47.4%
0
0
13.4%
0
0
-11.2%
2
3
55.4%
0
0
<-100%
852
1,12 2
3 1.7 %
344
529
5 3 .8 %
508
593
16 .8 %
290
347
19 .8 %
12 6
14 1
11.3 %
70
91
3 0 .9 %
22
14
- 3 7 .1%
Net fees and co mmissio n inco me
663
681
2.7%
430
433
0.7%
233
248
6.5%
140
146
4.4%
43
45
5.1%
30
32
5.9%
20
25
24.4%
Other o perating inco me
-72
11
>100%
-88
14
>100%
16
-2
<-100%
-4
-14
<-100%
19
14
-28.3%
1
-1
<-100%
0
-1
<-100%
2 5 .7 %
687
976
4 2 .1%
756
838
10 .9 %
425
479
12 .5 %
18 9
200
5 .8 %
10 0
12 2
2 1.5 %
41
B a s ic inc o m e
1,4 4 3
1,8 14
264
442
67.4%
158
344
>100%
106
99
-7.1%
49
48
-1.4%
21
23
10.3%
34
26
-24.3%
62
36
-42.2%
62
36
-41.9%
0
0
<-100%
0
0
<-100%
0
0
--
0
0
--
1,7 6 9
2 ,2 9 2
2 9 .6 %
907
1,3 5 6
4 9 .5 %
862
937
8 .6 %
474
527
11.0 %
2 10
223
6 .3 %
13 4
14 8
9 .9 %
Staff co sts
767
636
-17.2%
549
411
-25.2%
218
225
3.1%
130
130
0.5%
44
47
4.7%
29
32
Other administrative co sts
460
448
-2.4%
265
247
-6.9%
194
202
3.6%
115
120
4.4%
40
42
4.9%
34
34
Net trading inco me
Equity acco unted earnings
B a nk ing inc o m e
Depreciatio n
38
- 8 .7 %
2
2
-32.8%
0
0
69.6%
44
39
- 10 .0 %
9.7%
14
16
7.9%
-0.2%
6
6
2.2%
68
66
-3.8%
38
32
-15.2%
30
33
10.8%
13
13
2.4%
9
11
15.8%
7
9
19.8%
0
0
-0.1%
Ope ra t ing c o s t s
1,295
1,150
-11.2%
853
690
-19.1%
442
459
3.9%
257
263
2.3%
93
99
5.9%
71
75
6.0%
21
22
6.1%
Ope ra t ing ne t inc o m e be f . im p.
474
1,14 3
>10 0 %
54
666
>10 0 %
420
477
13 .6 %
2 17
263
2 1.3 %
116
12 4
6 .6 %
72
14 .2 %
23
17
- 2 4 .6 %
<-100%
63
Lo ans impairment (net o f reco veries)
821
1,107
34.9%
743
1,021
37.4%
78
86
10.4%
53
65
23.2%
11
12
8.1%
11
10
-9.6%
4
0
Other impairm. and pro visio ns
466
209
-55.1%
463
208
-55.1%
3
2
-46.7%
3
-1
<-100%
1
2
>100%
-1
1
>100%
0
0
>100%
- 8 13
- 17 3
7 8 .7 %
- 1,15 2
-563
5 1.1%
339
389
14 .9 %
16 1
200
2 3 .9 %
10 5
110
5 .0 %
53
16 .2 %
19
17
- 10 .1%
-211
-98
53.7%
-278
-176
36.7%
67
78
16.6%
34
45
30.2%
18
20
11.7%
13
11
-13.8%
2
2
18.5%
94
110
17.5%
0
0
>100%
94
110
17.1%
0
0
--
1
1
17.7%
0
0
--
93
109
17.1%
-695
- 18 6
7 3 .3 %
-874
-387
5 5 .7 %
17 8
201
13 .1%
12 7
15 5
2 2 .1%
3 .4 %
41
51
2 5 .5 %
-75
-93
- 2 4 .2 %
N e t inc o m e be f o re inc o m e t a x
Inco me tax
No n-co ntro lling interests
N e t inc o m e ( be f o re dis c . o pe r.)
Net inco me arising fro m disco nt. o peratio ns
N e t inc o m e
-45
-32
28.6%
-740
- 2 18
7 0 .6 %
86
88
62
61
Investor Relations Division
Rui Coimbra, Head of Investor Relations
Investor Relations
Reporting and Ratings
Luís Pedro Monteiro
Luís Morais
Paula Dantas Henriques
Lina Fernandes
Tl: +351 21 1131 084
Tl: + 351 21 1131 337
Email: [email protected]
Banco Comercial Português. S.A., a public company (sociedade aberta) having its registered office at Praça D. João I. 28, Oporto, registered at the
Commercial Registry of Oporto, with the single commercial and tax identification number 501 525 882 and the share capital of EUR 3,706,690,253.08
62


!["Minho - Le Nord" [no. 1 "Old Land Portugal"] - Free](http://s2.esdocs.com/store/data/000459019_1-763f6c95acdaf20bb3a9381d878beb51-250x500.png)
© Copyright 2026