
Risk Management for Endowed Perpetual
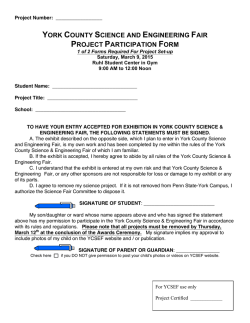
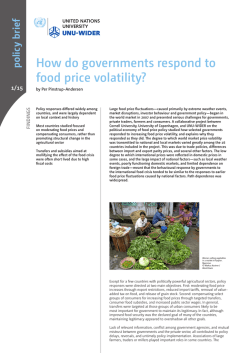
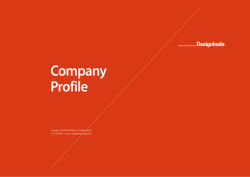
Insights on...
RISK MANAGEMENT
THE FIVE PILLARS: RISK MANAGEMENT FOR ENDOWED,
PERPETUAL CHARITABLE ENTITIES
As an endowed charity with a goal of existing into perpetuity, your time horizon is much longer
than the one-generation (30-year) horizon of an individual or pension fund. Your aim of supporting
thematic charitable goals through ongoing distributions as set by the organization’s board,
rather than facing specific liabilities, also sets you apart. Maintaining steady distribution levels may
not be mandated, but it is important. As a result, your investment strategy and risk management
goals revolve around the tug and pull between maintaining purchasing power across multiple
generations and providing steady support of your charitable intentions in the nearer term. Maintaining
this balance presents different risk management challenges than other investors face.
John Keshner
Managing Director,
Not-for-Profit
Investment Solutions,
Northern Trust Asset
Management
Pillar 1: Setting
allocation and
monitoring results
Risk management for endowed charitable entities focuses on five key components
or “pillars:”
1. Setting the allocation and monitoring results – to align with your unique objectives.
2. Integrating investment policy with distribution policy – to design and manage an
effective distribution policy based on your objectives.
3. Managing illiquidity – balancing the advantages of accessing the illiquidity premium
against the need for liquidity to meet near-term distributions, particularly in times
of stress.
4. Making volatility exposure efficient – focusing on maximizing the benefit from
necessary exposure to volatility.
5. Integrating risk management into governance and structure – integrating thoughtful assessment of the portfolio into an appropriate governance model and committee
meeting structure.
SETTING ALLOCATION AND MONITORING RESULTS: BEGIN WITH THE END IN MIND
Form follows function, and strategic asset allocation must be designed to deliver on your specific
investment objectives. To illustrate, we compared two allocations – Northern Trust’s endowment
and foundation (E&F) starting point strategic allocation1 and a relatively simple “80/20” mix2
(see Exhibit 1 on page 2).
1 To learn more about Northern Trust’s strategic allocation recommendations for endowed perpetual charitable institutions, see “Strategic Asset Allocation for Not-for-Profit
Entities: Understanding the Recommendations for 2015.”
2 The 80/20 mix is allocated as 80% return-oriented assets (53% public equity, 10% real assets, 10% absolute return and 7% private equity) and 20% cash and investment
grade bonds.
northerntrust.com | The Five Pillars: Risk Management for Endowed, Perpetual Charitable Entities | 1 of 12
EXHIBIT 1: STRATEGIC ASSET ALLOCATION COMPARISON
Comparing Northern Trust’s E&F allocation to a simpler allocation of 80% return-oriented assets and 20% cash and
investment-grade bonds.
2015 NT
E&F Allocation
80/20
Allocation
100
3%
20%
80
20%
10%
9%
0%
50
Real Assets
14%
10%
40
Public Equity
34%
53%
30
Private Equity
20%
7%
20
Cash and Investment-Grade
Bonds
Absolute Return
Credit
90
70
60
10
0
NT E&F
Source: Northern Trust
Alternative investment allocations frequently are viewed in terms of expected return and expected
volatility. In Exhibit 2, we have plotted the portfolio options relative to an efficient frontier based on
our capital market assumptions and constraints. The Northern Trust E&F recommended allocation
has a higher expected return and lower expected volatility and charts on the efficient frontier while
the 80/20 allocation lies below the efficient frontier.
EXHIBIT 2: ALLOCATIONS ON THE EFFICIENT FRONTIER
The Northern Trust E&F recommended allocation has both higher expected return and lower
expected volatility than the 80/20 allocation.
10.0
NT E&F
8.0
7.0
Absolute Return
6.0
4.0
2.0
Global
Fixed Income
Developed
World
Real Estate –
Private Core
80/20
Global High Yield
5.0
3.0
Emerging
Markets Equity
Private Equity
9.0
Expected Return
.
80/20
Infrastructure
Real Estate Public
Global Listed
Commodities –
Equities
Emerging Markets
Debt (Local)
Global Inflation
Linked Bonds
1.0
0.0
0.0
5.0
10.0
15.0
20.0
25.0
Standard Deviation (Risk)
Source: 2015 Northern Trust Capital Market Assumptions
northerntrust.com | The Five Pillars: Risk Management for Endowed, Perpetual Charitable Entities | 2 of 12
While this traditional view can be helpful as a component of analysis, charitable entities weighing
allocation options would be better served to consider the portfolio in terms more relevant to their
unique objectives. Exhibit 3 shows the probability of a decline in spending power (and ability to
make distributions in the near term) and the probability of a decline in purchasing power over
the longer term for both the E&F and 80/20 portfolios. The E&F allocation shows a substantial
reduction in risk (24% reduction in risk to near-term distributions and 35% reduction in risk to
long-term purchasing power).
EXHIBIT 3: PROBABILITY OF OUTCOMES – SPENDING POWER AND PURCHASING POWER
Probability of Decline in Spending Power
40%
80/20 Mix
35%
30%
NT E&F Allocation
25%
20%
30%
35%
40%
45%
50%
55%
60%
Probability of Not Maintaining Purchasing Power
Source: Northern Trust
Monitoring your results
is the second, equally
important part of the first
pillar of risk management.
When reviewing your strategic allocation and considering adjustments, focusing on the view
presented in Exhibit 3 can help ensure that any changes will have a positive effect on your
organization’s ability to meet its objectives. In his book Pioneering Portfolio Management, David
Swensen, chief investment officer of the Yale University endowment, shows changes in Yale’s
allocation over time along these dimensions, showing a steady improvement in “efficiency” as
Yale’s policy allocation has evolved relative to dimensions most important to an endowed,
perpetual, charitable investment pool.
Monitoring your results is the second, equally important part of this pillar of risk management.
Inflation can have serious implications on your long-term ability to maintain distributions and
purchasing power. For this reason, portfolio value and change in annual distributions both can
and should be tracked relative to inflation, using a measure that is relevant to your objectives
(e.g., global inflation or higher education inflation). Distributions that increase with inflation
provide steady support for your near-term intentions. Portfolio value that grows with inflation
is sustaining purchasing power.
To illustrate the effects inflation can have on your portfolio, we have started with a hypothetical
pool of assets with a beginning value of $100 million.3 We analyzed the historical pro forma growth
of this portfolio from 2003 through 2013, assuming it used the 80/20 allocation described earlier,
while supporting 5% annual distributions.
3 Our hypothetical portfolio value of $100 million was chosen for ease of calculation when comparing our sample results with a real portfolio (e.g., to relate the examples
to a $500 million portfolio, you would multiply the hypothetical results by five). The concepts are valid for much larger portfolios.
northerntrust.com | The Five Pillars: Risk Management for Endowed, Perpetual Charitable Entities | 3 of 12
A portfolio that grows above the rate of inflation compounding creates an asset value surplus.
As seen in Exhibit 4, in Year 1 through Year 5 (2003 through 2007), this pool of assets creates
substantial surplus, leading to an annual change in distributions above the inflation rate and,
therefore, to a cumulative distribution surplus (see Exhibit 5).
EXHIBIT 4: SAMPLE PORTFOLIO GROWTH VS. INFLATION, YEAR 1 THROUGH YEAR 5
$150,000,000
$140,000,000
$130,000,000
Asset Value
Surplus
$120,000,000
$110,000,000
$100,000,000
2003
2004
2005
Sample Portfolio Value
2006
2007
Inflation Value
Source: Northern Trust
EXHIBIT 5: SAMPLE PORTFOLIO PAYOUT SURPLUS, YEAR 1 THROUGH YEAR 5
$11,000,000
$10,000,000
$9,000000
$8,000,000
$7,000,000
$6,000,000
$5,000,000
$4,000,000
$3,000,000
$2,000,000
$1,000,000
$0
2003
2004
2005
2006
2007
Source: Northern Trust
All is well, until market volatility causes a sharp drawdown in Year 6 (2008). As you can see in
Exhibit 6 on page 5, the market volatility has wiped out the surplus asset value. Assuming our
hypothetical organization is following a simple distribution rule of 5% on ending value, the market
drawdown would also make future distributions markedly lower. Market volatility has put the
entity’s objectives at risk – maintenance of purchasing power is clearly compromised in the near
term, but an even greater challenge lies with providing steady near-term distribution levels.
northerntrust.com | The Five Pillars: Risk Management for Endowed, Perpetual Charitable Entities | 4 of 12
EXHIBIT 6: RESULTS OF MARKET VOLATILITY ON SAMPLE PORTFOLIO
The market crisis in 2008 severely affected portfolio value.
$150,000,000
$140,000,000
$130,000,000
$120,000,000
$110,000,000
$100,000,000
2003
2004
2005
Sample Portfolio Value
2006
2007
2008
Inflation Value
Source: Northern Trust
Pillar 2: Integrating
investment policy with
distribution policy
INTEGRATING INVESTMENT AND DISTRIBUTION POLICIES: FINDING BALANCE
A situation like this, in which the portfolio experiences a dramatic drop in value because of
market volatility, highlights the importance of our second pillar of risk management: integrating
your investment policy with your distribution policy. How do you handle distributions in a
market drawdown? Do you significantly pare back near-term distributions, for example, to a
fixed percentage (often 5%) of the reduced market value to give the portfolio the best opportunity
to recover? Or do you maintain near-term distributions, reducing the portfolio’s longer-term
potential? Having a framework for making this decision can be of great value in helping the
board thoughtfully balance and manage its risks and objectives, and communicate to its
charitable recipients its intentions.
To help determine the effects of each approach on our hypothetical portfolio, we analyzed
two spending rules (see Exhibit 7 on page 6):
■■ A base distribution rule that maintains spending at 5% of ending market value. Under this
scenario, distributions are reduced by the full magnitude of the market downturn in the year
following its occurrence.
■■ An alternative distribution rule under which distributions don’t decrease by the full amount
of the drop in portfolio value; rather the rule holds distributions at a reference level, aiming
to keep current year spending to within 10% of the levels of the three prior years.
northerntrust.com | The Five Pillars: Risk Management for Endowed, Perpetual Charitable Entities | 5 of 12
EXHIBIT 7: EFFECT OF DISTRIBUTION STRATEGIES ON PORTFOLIO VALUE
Annual percentage change in payouts (relative to spending during the three years prior) under the
base and alternative rules.
40%
30%
20%
10%
0%
–10%
–20%
–30%
2006
2007
2008
Inflation
2009
2010
2011
Alternative Payout Rule
2012
2013
Base Rule
Source: Northern Trust
The alternative rule payout declines significantly less following the drawdown and is also steadier
during the recovery years. The standard deviation of the change in payouts under the base rule is
19%; under the alternative rule the standard deviation declines to 16%.
Maintaining a steadier distribution level has a tradeoff – making higher distributions in a
downturn means that when the markets recover, you have fewer assets in the portfolio. As a
result, asset growth and recovery back to pre-downturn levels are slower. This can be seen in
Exhibit 8.
EXHIBIT 8: PORTFOLIO SURPLUS AFTER DISTRIBUTIONS
$30,000,000
$25,000,000
$20,000,000
$15,000,000
$10,000,000
$5,000,000
$0
–$5,000,000
–$10,000,000
2008
2009
2010
Base Rule Surplus
2011
2012
2013
Alternative Rule Surplus
Source: Northern Trust
northerntrust.com | The Five Pillars: Risk Management for Endowed, Perpetual Charitable Entities | 6 of 12
Making higher payouts in the wake of a drawdown means a slower return to surplus levels in
market recovery. But, importantly, under both rules the portfolio does recover and return to predownturn surplus levels. Although it recovers a little more slowly, the alternative payout scenario
realizes a return to surplus in a reasonable amount of time. Therefore, it arguably represents a
better balance of the charitable entity’s objectives – steady support of near-term intentions with
long-term protection of purchasing power.
Pillar 3: Managing
illiquidity
MANAGING ILLIQUIDITY: WEIGH ADVANTAGES AND TEST
One of the greatest advantages long-horizon investors have is the opportunity to invest in illiquid
assets, such as private equity, which can generate premium returns. For example, for the 20 years
ended December 31, 2013, private equity outperformed U.S. equities by nearly 7% annualized
(16.1% returns vs. 9.2% for the S&P 500). But the lack of liquidity in an allocation to an asset
class like private equity can affect distributions, especially in a liquidity crunch. The board needs
to understand the level of illiquidity associated with a particular strategic allocation, and perform
stress tests to understand how the allocation might perform in adverse scenarios. The board also
should monitor liquidity over time, because it is not a static measure.
We use an average level of liquidity by investment category to calculate average liquidity for
the Northern Trust E&F allocation. Our liquidity assumptions, by asset class, are as follows:
■■ Traditional investments – four days (T+3)
■■ Absolute return – 100 trading days for a mature program
■■ Private investments (private equity and private real assets) – 1,000 trading days for a mature
set of investments
Using the above assumptions, the Northern Trust E&F recommendation has a weighted-average
liquidity of 362 days. The boards of some organizations will see almost a year’s worth of average
liquidity (well over a year in trading days) as a risk, others as a manageable opportunity.
Organizations with larger alternatives allocations should consider stress tests of liquidity.
Stress testing provides a very valuable view of your portfolio’s liquidity under various scenarios.
When performing a stress test, keep in mind:
■■ A typical private investment will at its peak have just 65% of the commitment invested.
■■ To get invested to target, commitments must exceed targets; using the 65% figure, an investor
may want to commit 1/.65 = 1.5x target
■■ Capital calls could reach 100% of commitments while distributions may not offset those calls –
a 20% target with a 30% commitment can become a 30% investment. This scenario played
out for many large investors with significant commitments to private investments in 2008
and 2009.
■■ In a stress scenario, if the other 70% of the allocation simultaneously falls by 30% in value, the
30% private investment allocation could jump to 38% (see Exhibit 9 on page 8).
northerntrust.com | The Five Pillars: Risk Management for Endowed, Perpetual Charitable Entities | 7 of 12
EXHIBIT 9: PRIVATE EQUITY COMMITMENT STRESS TESTING
In a market downturn, the PE commitment can grow to a disproportionately large percentage of the
portfolio compared to the strategic target.
40%
8%
38%
% of Portfolio
30%
10%
20%
20%
10%
0%
PE Target
+
Overcommitment to
hit target all called
+
30% markdown
in non-PE
=
PE Liquidity
Stress Test Value
Source: Northern Trust
From a whole balance sheet perspective, we also encourage investors to explore their options for
borrowing, such as a line of credit, to help manage liquidity in normal course of operations and
in any potential liquidity crunch scenario.
Pillar 4: Making volatility
exposure efficient
WEIGH THE BENEFITS OF VOLATILITY: SEEK EFFICIENCY
Return-seeking assets are subject to volatility, which creates difficult decisions for charitable
boards. This is a key reason why thoughtful investment programs for charitable organizations
should place emphasis on managing volatility while enabling long-term compounding. To
maintain purchasing power after meaningful annual distributions, a portfolio has to take
on risk, including expected volatility. When measuring portfolio success, the board should
regularly consider how risk is being managed in the implementation of the portfolio. The
board needs to ask whether the portfolio is efficient in its generation of returns – whether
it generated more returns for risk it took than the broad benchmark. Or, in other words,
“If we are taking risk, are we being paid for that risk?”
At Northern Trust, to facilitate this discussion, we often create a custom risk report card
for organizations. This report card may examine a variety of time frames, measures and ratios –
our full risk report card template on a large complex program can run to 50 pages or more.
Examining the most meaningful views, relative to your objectives, can help facilitate efficient
assessment of results.
Exhibit 10 on page 9, shows a sample summary report card, based on results for a live portfolio
with a focus on annualized results for the five years ended December 31, 2013. The report card
compares the account to the MSCI-All-Country World Index (ACWI) as a broad benchmark for a
portfolio seeking long-term compounding. The account returned 79% of ACWI on an annualized
basis over the five years, but with only 61% of the volatility of ACWI. The account’s efficient use
of risk generated a high Sharpe ratio and Modigliani-Modigliani measure (M2). Market exposure
as measured by beta was a modest 0.6, and alpha was strong at 2.6, again reflecting strong returns
generated relative to risk.
northerntrust.com | The Five Pillars: Risk Management for Endowed, Perpetual Charitable Entities | 8 of 12
EXHIBIT 10: SAMPLE RISK REPORT CARD ANNUALIZED OVER A FIVE-YEAR PERIOD
MEASURE
NOTE
Account Return
12.3%
Outperforming expected return; strong relative
to target return (CPI +5%)
Index Return
15.5%
Account performance trails ACWI over
time frame
Account Standard
Deviation
10.6%
In line with expected volatility
Index Standard
Deviation
17.4%
Account volatility sharply lower than ACWI
Account Sharpe
Ratio
1.2
M Squared
Generating high Sharpe Ratio
Generating high M Squared value
20.2%
Relative
Volatility (Beta)
0.6
Jensen's Alpha
2.6%
Realizing low market exposure
Strong performance relative to market risk
M2 is a volatility adjusted return measure. It will “rank” efficiency (return generated per unit of
volatility) in the same way that the Sharpe ratio will, but it presents results in a rate of return
that gives some a better sense of the magnitude of differences. M2 takes the efficiency of an
account or asset category and applies that to the benchmark’s volatility, answering the question,
“If this efficiency were realized on the benchmark level of volatility, what returns would have
been generated?”
In Exhibit 11, we see again that the sample portfolio generated lower returns than ACWI
(21% lower), but with far lower volatility (39% lower). The portfolio was far more efficient in its
EXHIBIT 11: ASSESSING VOLATILITY AND RETURN EFFICIENCY
For the five years ending 12/31/13.
35.0%
30.0%
25.0%
20.0%
15.0%
10.0%
5.0%
0%
Account
ACWI
Return
Account
Equity
Volatility
Account
Absolute Return
Account
Fixed Income
M2
Source: Northern Trust, MSCI
northerntrust.com | The Five Pillars: Risk Management for Endowed, Perpetual Charitable Entities | 9 of 12
generation of returns – it got more out of the risk it took than the broad benchmark. This can be
seen in its M2 measure, which is 470 basis points higher than ACWI (20.2% vs. 15.5%).
Looking at asset class categories within the account, equity matched ACWI returns on an
absolute basis. However, equity was more efficient in its generation of returns, realizing an M2
that was 70 basis points higher than ACWI. Absolute return and fixed income both had far
superior efficiency, with absolute return generating an M2 that was 630 basis points higher than
the total portfolio, and 1,100 basis points higher than ACWI. Fixed income generated an M2 that
was 1,310 basis points higher than the total portfolio, and 1,780 basis points higher than equity.
Candid assessment of risk and performance results is an important element of accountability
in the management of a large, complex investment program. It can also help answer questions
related to forward strategy:
■■ If we have been efficient in generating returns in a particular category, should we increase our
allocation to that category?
■■ What are our forward expectations for the category?
■■ Can we (continue to) access and combine managers to improve on those expectations?
INTEGRATING RISK MANAGEMENT INTO GOVERNANCE AND STRUCTURE
To be successful, risk management needs to be integrated into a charitable entity’s governance and
structure. The board needs to carefully monitor investment results relative to the organization’s
objectives, but a thoughtful investment strategy requires time to come to fruition. For this reason,
it’s important to build enough space into your monitoring to avoid the temptation to react to nearterm events, and to allow the plan’s longer-term objectives to play out. A quarterly meeting schedule
with agendas designed to maximize effectiveness should be sufficient to keep the board in close
communication with investment staff, both internal and external.
Plan to review policy allocation and undertake an in-depth assessment of investment results
(risk and return) annually. Large long-horizon portfolios typically have high allocations to
alternative investments where detailed quarterly review of results can be less meaningful. The
following is a representative timeline for a quarterly meeting schedule structure supporting an
efficient governance model.
EXHIBIT 12: BOARD MEETING SCHEDULE AND AGENDA
Agenda:
Annual Policy
Allocation
Review
0
r3 d
be En
em er
pt r t
Se Qua
Agenda:
Special Topic
Review
Agenda:
Special Topic
Review
31 d
ch En
ar er
M uart
Q
Agenda:
Annual
Investment
Performance
Review
D
Q ece
ua mb
rte er
r E 31
nd
Ju
ne
Ye 30
ar F
En isc
d al
Pillar 5: Integrating
risk management into
governance and structure
northerntrust.com | The Five Pillars: Risk Management for Endowed, Perpetual Charitable Entities | 10 of 12
PLANNING HELPS MEET RISK MANAGEMENT CHALLENGES
Thoughtful forward-looking
judgment is the key
ingredient to long-term
success.
Managing risk is an important challenge for the board of a charitable entity. Balancing near-term
and long-term objectives, and determining the appropriate policy allocation relative to those
objectives, can be tricky. Integrating the five pillars of risk management into the processes can
help the board find this balance:
■■ Setting the allocation with your objectives in mind and regularly assessing the portfolio’s
performance is an important first step.
■■ Designing a framework for distributions and managing them with that balance of near-term
and longer-term objectives in mind facilitates decision-making in market downturns.
■■ Understanding and stress testing the allocation’s liquidity profile, and then tracking liquidity
over time can play a valuable role in continuing to meet near-term distributions.
■■ Focusing on maximizing the benefit reaped from the portfolio’s volatility exposure can
provide tools for assessing the allocation choices and for developing future strategies.
■■ Integrating thoughtful assessment of results into governance and structure provides
perspective for periodic review of the policy allocation and implementation approach.
A board can employ a variety of tools to help fulfill its fiduciary responsibilities, but thoughtful
forward-looking judgment is the key ingredient to long-term success.
LEARN MORE
Risk management is an important, but sometimes challenging task to implement. If you would
like to learn more about improving your organization’s risk management practices so that they
better support your goals as a not-for-profit entity, please contact your relationship manager or
visit us at northerntrust.com.
northerntrust.com | The Five Pillars: Risk Management for Endowed, Perpetual Charitable Entities | 11 of 12
Head Office: 50 South La Salle Street, Chicago, Illinois 60603 U.S.A. Incorporated with limited liability in the U.S. Products and services provided by subsidiaries of Northern
Trust Corporation may vary in different markets and are offered in accordance with local regulation.
IMPORTANT INFORMATION: This material is for information purposes only. The views expressed are those of the author(s) as of the date noted and not necessarily of the
Corporation and are subject to change based on market or other conditions without notice. The information should not be construed as investment advice or a recommendation
to buy or sell any security or investment product. It does not take into account an investor’s particular objectives, risk tolerance, tax status, investment horizon, or other potential
limitations. All material has been obtained from sources believed to be reliable, but the accuracy cannot be guaranteed.
Past performance is no guarantee of future results. Returns of the indexes also do not typically reflect the deduction of investment management fees, trading costs or other
expenses. It is not possible to invest directly in an index. Indexes are the property of their respective owners, all rights reserved.
Northern Trust Asset Management comprises Northern Trust Investments, Inc., Northern Trust Global Investments Limited, Northern Trust Global Investments Japan, K.K., NT
Global Advisors, Inc. and investment personnel of The Northern Trust Company of Hong Kong Limited and The Northern Trust Company.
This material is directed to professional clients only and is not intended for retail clients. For Asia-Pacific markets, it is directed to institutional investors, expert investors and
professional investors only and should not be relied upon by retail investors. For legal and regulatory information about our offices and legal entities, visit
northerntrust.com/disclosures. The following information is provided to comply with local disclosure requirements: The Northern Trust Company, London Branch;
Northern Trust Global Services Limited; Northern Trust Global Investments Limited. The following information is provided to comply with Article 9(a) of The Central Bank of the
UAE’s Board of Directors Resolution No 57/3/1996 Regarding the Regulation for Representative Offices: Northern Trust Global Services Limited, Abu Dhabi Representative
Office. Northern Trust Global Services Limited Luxembourg Branch, 2 rue Albert Borschette, L-1246, Luxembourg, Succursale d’une société de droit étranger RCS B129936.
Northern Trust Luxembourg Management Company S.A., 2 rue Albert Borschette, L-1246, Luxembourg, Société anonyme RCS B99167. Northern Trust (Guernsey) Limited
(2651)/Northern Trust Fiduciary Services (Guernsey) Limited (29806)/Northern Trust International Fund Administration Services (Guernsey) Limited (15532) Registered
Office: Trafalgar Court Les Banques, St Peter Port, Guernsey GY1 3DA.
Issued by Northern Trust Global Investments Limited.
© northern trust 2014
northerntrust.com | The Five Pillars: Risk Management for Endowed, Perpetual Charitable Entities | 12 of 12
Q 56799 (12/14)


© Copyright 2026