
Equity Research - BMA Wealth Creator
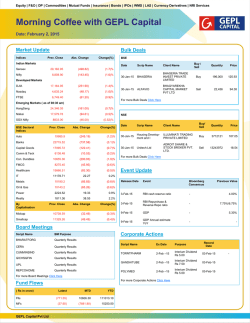
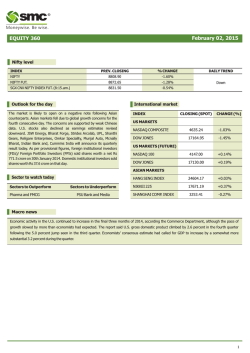
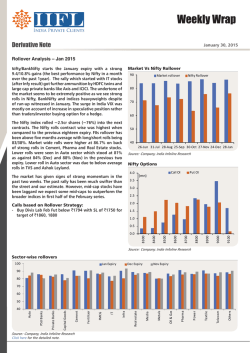
Equity Research January 28 2015 s Equity Evening Wrap [email protected] 033-4011 0163 Nifty View Markets end Flat after a volatile session: Volatility ruled the roost as key benchmark gave away a lion's portion of their intraday gains soon after extending gains in early afternoon trade. The broad market depicted weakness. The market breadth indicating the overall health of the market was weak. The Sensex snapped 8 day gains and ended lower by 11.86 points at 29559.1 and the Nifty was up 3.80 points at 8914.30. Foreign institutional investors (FPIs) were net buyers in Indian equities worth Rs 953 crore on Tuesday, as per provisional stock exchange data. Tracking Nifty For The Week: (Week ending January 30, 2015, -All Nifty levels refer to Nifty Futures) The trend deciding point for the week for Nifty was at 8732 mark. During this week as long as Nifty did not close BELOW the level of 8732 market was not expected to go DOWN. It was envisaged that the current trend was expected to take Nifty towards the first weekly resistance of 8921 mark. if demand pressure was strong at 8521 and Nifty closed above this level, then it was expected to move towards 9065 mark or 9254 mark, depending on the demand pressure. On the other hand, if Nifty closed below the first resistance point of 8921 or turned much before 8921 under selling pressure, then nifty was to move towards the trend deciding point of 8732 mark. Further selling pressure here was to make Nifty close below this trend deciding point and change the immediate trend to negative. If such an event occurred, then nifty was to move towards 8587 mark depending on the supply pressure. Tracking Banknifty For The Week: (Week ending January 30, 2015, -All Banknifty levels refer to Banknifty Futures) The trend deciding point for the week for Banknifty was at 19816 mark. During this week as long as Banknifty did not close BELOW the level of 19816, Banknifty was not expected to go DOWN. It was envisaged that the current trend was expected to take Banknifty towards the first weekly resistance of 20309 mark. For any reason, if Banknifty closed above the first resistance point of 20309, then the immediate trend was to continue to be positive and Banknifty was to move towards 20681 mark or 21174 mark depending on the demand pressure. On the other hand, If this resistance of 20309 was not crossed or if bank nifty moved downward much before touching this point then there were chances that Banknifty would move towards the trend deciding point of 19816 mark. A further selling pressure at 19816 was to make Banknifty close below this level and then the immediate trend was to turn in to negative and it was to provide a push to Banknifty to touch 19444 mark or 18951 mark depending on the supply pressure. For Thursday, January 29, 2015, the trend deciding point for Nifty for the day works out at 8839 mark. Thus any fall towards 8839 is to get supported here. If this level is broken, then the next support is expected to be around 8771 mark. If Nifty sustains this mark and reverses from here then a buying opportunity is to be exploited here. On ascent, the level of 8979 is the hurdle. In case of a sharp up move, the crossover of this resistance is to take Nifty to the next level of hurdle, which emerges at 9065 mark, the second weekly resistance. The intermediate support stands at 8871 mark. If there is not much supply, then Nifty can reverse from here for upside, instead of 8839 mark. On the other hand, the intermediate resistance stands at 8938 mark. If there is not much demand, then Nifty can reverse from here for downside, instead of 8979 mark. For Thursday, January 29, 2015, the trend deciding point for the day for Bank Nifty works out at 20384 mark. The first weekly resistance, which acts as a support now, stands at 20309 mark. Thus any fall in Bank Nifty towards this zone of 20384 – 20309 should offer a support. If this support zone is broken due to strong selling pressure, then the next support is expected to emerge around 20226 mark. On the ascent, an important resistance exists at 20681 mark, the second weekly resistance. If this is crossed, then the next resistance emerges at 20870 mark. For Thursday, the trend reversal point for Nifty stands at 8847 in spot. Any close below 8847 in spot on Thursday will change the trend to NEGATIVE. Again, that for Bank Nifty, this level stands at 20345 in spot. This implies that a close below this level on Thursday for Bank nifty in spot will change the trend in that index in to NEGATIVE. Index Range: (January Future) Nifty: 8905 Range: 8771 - 8995 Resistance: 8927 – 8985 - 9052 Support: 8860 – 8801 - 8735 Bank Nifty: 20451 Resistance: 20642 – 20858 - 21005 Support: 20350 – 20134 - 19842 Sensex: 29549 Resistance: 29605 – 29785 - 29987 Support: 29403 – 29224 - 29022 BMA Wealth Creators Equity Research Equity Evening Wrap Key Market Indicators Nifty Spot Nifty Jan Close Premium/Discount Nifty Feb Close MoM Spread hiv Nifty Jan OI Nifty Feb OI Highest OI in Call (@ 9000) Highest OI in Put (@ 8700) VIX Nifty Price Movement Today Yesterday 8914.3 8905.4 -8.9 8970 64.6 10714875 8910.5 8917.75 7.25 8982.05 64.3 20226950 20425950 5237850 5085150 19.77 12133250 5268925 5115325 18.08 Nifty Volatility Nifty Snapshot The market was positive and the discount of Nifty Jan futures stands at 8.9 Nifty Jan futures decreased -9512075 shares in open interest and Feb futures increased 8292700 shares in open interest. Difference between Jan and Feb Nifty spread was 64.6 higher to the previous day's figure of 64.3 VIX was 19.77, higher to the previous close of 18.08 Highest open Interest outstanding in Call was seen at 9000 strike. Highest open interest outstanding in Put was seen at 8700 strike. Top Losers Top Gainers COMPANY % CHG. TITAN CO LTD 8.14 SUZLON ENERGY LTD 5.90 NCC LTD 5.49 IRB INFRASTRUCTURE DEVELOPER 5.45 SHRIRAM TRANSPORT FINANCE 5.19 VOLTAS LTD 4.88 RURAL ELECTRIFICATION CORP 4.38 HINDUSTAN PETROLEUM CORP 4.30 POWER FINANCE CORPORATION 3.50 HOUSING DEVELOPMENT & INFRAS 3.28 DLF LTD 3.26 ASHOK LEYLAND LTD 3.10 DIVI'S LABORATORIES LTD 3.00 GUJARAT FLUOROCHEMICALS LTD 2.80 HCL TECHNOLOGIES LTD 2.66 IVRCL LTD 5.83 COMPANY % CHG. BHARTI AIRTEL LTD UNION BANK OF INDIA TATA MOTORS LTD-A-DVR SESA STERLITE LTD SESA STERLITE LTD SHREE RENUKA SUGARS LTD RELIANCE COMMUNICATIONS LTD HAVELLS INDIA LTD KOTAK MAHINDRA BANK LTD TATA MOTORS LTD LARSEN & TOUBRO LTD IDEA CELLULAR LTD JINDAL STEEL & POWER LTD MCLEOD RUSSEL INDIA LTD JSW STEEL LTD BMA Wealth Creators -5.23 -4.87 -3.82 -2.97 -2.97 -2.94 -2.87 -2.84 -2.68 -2.54 -2.51 -2.50 -2.45 -2.12 -2.11 Equity Research Equity Evening Wrap Nifty Options (Open Interest) Maximum OI increased in call was seen at 9000 with a gain of 10475700 shares Maximum OI increased in put was seen at 8800 with a gain of 9589100 shares Maximum OI outstanding in call is at 9100 with 1468900 shares Maximum OI outstanding in Put is at 8700 with a gain of 1200550 share Nifty Options (Volume) Most active call: C8900 with a volume of 119464700 shares Most active put: 8800 with a volume of 113607800 Shares moso eco Most Active Stock Call Options Stock Contract Strike RIL 29-Jan-15 C900 AXSB 29-Jan-15 C600 SBIN 29-Jan-15 C330 AL 29-Jan-15 C67.5 TCS 29-Jan-15 C2550 Most Active Stock Put Options Price Change Volume IVM Stock Price Change Volume IVM 10.4 5.4 9,736 31.208 AXSB 29-Jan-15 P580 1.8 -0.9 4,200 43.895 2 -2 6,533 39.903 SBIN 29-Jan-15 P330 1.65 -1.25 3,954 42.632 4.85 1.15 5,335 32.465 RIL 29-Jan-15 P900 4 -10.25 3,585 34.211 1.45 0.85 5,116 83.501 RIL 29-Jan-15 P880 0.9 -3.4 3,567 40.487 10.7 3.8 4,954 31.343 AXSB 29-Jan-15 P590 4.85 -0.15 3,536 38.068 Contract Strike BMA Wealth Creators Equity Research Equity Evening Wrap Top 5 OI Gainers Name HAVELLS INDIA LTD INDIAN OVERSEAS Top 5 OI Losers BANK Last 276.10 52.30 4.70 Name % Price Chg 0.33 6708891 802 Last Volume 2620327 19.52% % Price Chg OI OI % Chg Comments 22.78% Longs Built Up 2258 Longs Built Up Volume OI OI % Chg Comments Comments INDIAN OVERSEAS BANK 52.30 4.70 6708891 802 19.52% Longs Built Up BMA Wealth Creators Equity Research Equity Evening Wrap Pivot Points NAME PIVOT POINT R3 R2 R1 21365.83 21149.92 20857.83 20641.92 20349.83 20133.92 19841.83 NIFTY FUT 9110.88 9052.44 8985.38 8926.94 8859.88 8801.44 8734.38 ACC 1597.69 1576.35 1558.24 1536.90 1518.79 1497.45 1479.34 ADANIENT 607.44 593.90 578.09 564.55 548.74 535.20 519.39 ADANIPORTS 364.67 357.33 348.57 341.23 332.47 325.13 316.37 BANKNIFTY FUT ADANIPOWER S1 S2 S3 53.70 52.30 51.00 49.60 48.30 46.90 45.60 1875.86 1859.25 1845.21 1828.60 1814.56 1797.95 1783.91 ALBK 132.14 130.35 128.69 126.90 125.24 123.45 121.79 AMBUJACEM 256.83 254.42 251.83 249.42 246.83 244.42 241.83 ABIRLANUVO ANDHRABANK 95.28 94.06 92.83 91.61 90.38 89.16 87.93 APOLLOTYRE 242.53 238.14 232.93 228.54 223.33 218.94 213.73 ARVIND 281.16 277.68 274.31 270.83 267.46 263.98 260.61 71.03 69.72 68.73 67.42 66.43 65.12 64.13 ASHOKLEY ASIANPAINT 951.94 936.47 921.99 906.52 892.04 876.57 862.09 1212.76 1201.38 1188.71 1177.33 1164.66 1153.28 1140.61 615.54 607.67 599.19 591.32 582.84 574.97 566.49 2445.22 2429.81 2414.12 2398.71 2383.02 2367.61 2351.92 BANKBARODA 234.91 231.38 227.46 223.93 220.01 216.48 212.56 BANKINDIA 300.63 297.56 294.18 291.11 287.73 284.66 281.28 BATAINDIA 1509.80 1490.90 1469.70 1450.80 1429.60 1410.70 1389.50 BHARATFORG 1071.09 1054.80 1036.14 1019.85 1001.19 984.90 966.24 BHEL 292.23 287.34 282.93 278.04 273.63 268.74 264.33 BPCL 737.43 723.52 712.83 698.92 688.23 674.32 663.63 BHARTIARTL 417.15 406.43 393.05 382.33 368.95 358.23 344.85 BIOCON 415.68 413.81 411.53 409.66 407.38 405.51 403.23 CAIRN 242.78 240.39 237.88 235.49 232.98 230.59 228.08 CANBK 494.56 486.60 479.91 471.95 465.26 457.30 450.61 CENTURYTEX 594.98 584.37 571.48 560.87 547.98 537.37 524.48 CESC 737.73 728.87 720.83 711.97 703.93 695.07 687.03 CIPLA 721.56 714.28 707.11 699.83 692.66 685.38 678.21 COALINDIA 397.03 392.87 388.83 384.67 380.63 376.47 372.43 1949.22 1939.61 1929.32 1919.71 1909.42 1899.81 1889.52 CROMPGREAV 197.48 195.24 192.58 190.34 187.68 185.44 182.78 DABUR AUROPHARMA AXISBANK BAJAJ-AUTO COLPAL 259.54 256.40 253.59 250.45 247.64 244.50 241.69 DENABANK 59.60 59.25 58.80 58.45 58.00 57.65 57.20 DISHTV 83.91 82.45 81.06 79.60 78.21 76.75 75.36 1811.99 1778.00 1753.14 1719.15 1694.29 1660.30 1635.44 DIVISLAB DLF DRREDDY 175.08 169.59 165.18 159.69 155.28 149.79 145.38 3328.37 3286.68 3255.47 3213.78 3182.57 3140.88 3109.67 BMA Wealth Creators Equity Research Equity Evening Wrap EXIDEIND 213.77 209.48 204.37 200.08 194.97 190.68 185.57 FEDERALBNK 149.85 148.70 147.15 146.00 144.45 143.30 141.75 FRL 119.25 117.08 115.15 112.98 111.05 108.88 106.95 GAIL 433.02 427.66 423.32 417.96 413.62 408.26 403.92 GSKCONS 5852.88 5788.94 5708.98 5645.04 5565.08 5501.14 5421.18 GLENMARK 753.85 746.83 738.15 731.13 722.45 715.43 706.75 GMRINFRA 17.68 17.44 17.18 16.94 16.68 16.44 16.18 GODREJIND 327.37 323.18 318.07 313.88 308.77 304.58 299.47 GRASIM 4005.33 3959.16 3922.48 3876.31 3839.63 3793.46 3756.78 HAVELLS 291.68 285.29 276.78 270.39 261.88 255.49 246.98 HCLTECH 1728.51 1697.13 1672.76 1641.38 1617.01 1585.63 1561.26 HDFCBANK 1126.37 1109.78 1088.17 1071.58 1049.97 1033.38 1011.77 HEROMOTOCO 2949.28 2922.39 2894.33 2867.44 2839.38 2812.49 2784.43 HEXAWARE 234.70 231.08 227.00 223.38 219.30 215.68 211.60 HINDALCO 146.21 144.65 142.76 141.20 139.31 137.75 135.86 HINDPETRO 631.72 615.56 603.62 587.46 575.52 559.36 547.42 HINDUNILVR 952.53 946.66 939.88 934.01 927.23 921.36 914.58 HINDZINC 174.86 173.23 171.61 169.98 168.36 166.73 165.11 92.19 89.65 87.74 85.20 83.29 80.75 78.84 1427.58 1394.71 1366.43 1333.56 1305.28 1272.41 1244.13 HDIL HDFC ICICIBANK 403.50 398.45 391.70 386.65 379.90 374.85 368.10 IDBI 77.37 76.53 75.57 74.73 73.77 72.93 71.97 IDEA 180.79 176.45 171.74 167.40 162.69 158.35 153.64 IDFC 182.43 180.09 176.88 174.54 171.33 168.99 165.78 IFCI 38.73 38.26 37.88 37.41 37.03 36.56 36.18 INDIACEM 118.06 115.30 112.61 109.85 107.16 104.40 101.71 IBREALEST 80.08 78.91 77.33 76.16 74.58 73.41 71.83 350.26 344.75 340.61 335.10 330.96 325.45 321.31 IOC IOB 61.85 61.03 60.05 59.23 58.25 57.43 56.45 IGL 492.67 486.33 480.07 473.73 467.47 461.13 454.87 INDUSINDBK 901.15 890.58 879.35 868.78 857.55 846.98 835.75 INFY 2179.93 2167.37 2155.43 2142.87 2130.93 2118.37 2106.43 IRB 291.22 280.36 271.72 260.86 252.22 241.36 232.72 ITC 370.18 366.82 364.28 360.92 358.38 355.02 352.48 JISLJALEQS 68.33 67.54 66.58 65.79 64.83 64.04 63.08 JPASSOCIAT 28.67 27.96 27.17 26.46 25.67 24.96 24.17 JPPOWER 12.28 12.11 11.93 11.76 11.58 11.41 11.23 JINDALSTEL 162.45 160.53 157.95 156.03 153.45 151.53 148.95 JSWENERGY 122.76 120.30 118.51 116.05 114.26 111.80 110.01 JSWSTEEL 1040.32 1028.66 1013.32 1001.66 986.32 974.66 959.32 JUBLFOOD 1498.65 1477.33 1452.65 1431.33 1406.65 1385.33 1360.65 KTKBANK 157.38 153.92 149.48 146.02 141.58 138.12 133.68 KOTAKBANK 1429.03 1409.51 1385.58 1366.06 1342.13 1322.61 1298.68 LT 1790.17 1765.33 1734.67 1709.83 1679.17 1654.33 1623.67 BMA Wealth Creators Equity Research Equity Evening Wrap LICHSGFIN 522.08 513.49 504.18 495.59 486.28 477.69 468.38 LUPIN 1561.32 1547.41 1529.62 1515.71 1497.92 1484.01 1466.22 M&M 1363.57 1348.78 1332.57 1317.78 1301.57 1286.78 1270.57 MARUTI 3823.98 3791.24 3757.48 3724.74 3690.98 3658.24 3624.48 MCLEODRUSS 214.77 211.88 208.07 205.18 201.37 198.48 194.67 41054.42 40680.71 40248.92 39875.21 39443.42 39069.71 38637.92 NHPC 21.12 20.71 20.32 19.91 19.52 19.11 18.72 NMDC 144.67 143.08 141.67 140.08 138.67 137.08 135.67 NTPC 148.07 146.51 144.67 143.11 141.27 139.71 137.87 ONGC 365.16 360.83 357.21 352.88 349.26 344.93 341.31 OFSS 3370.75 3333.23 3297.55 3260.03 3224.35 3186.83 3151.15 ORIENTBANK 325.33 321.72 317.73 314.12 310.13 306.52 302.53 PETRONET 196.28 194.59 192.43 190.74 188.58 186.89 184.73 PFC 308.17 301.08 295.47 288.38 282.77 275.68 270.07 POWERGRID 154.02 152.86 151.32 150.16 148.62 147.46 145.92 PTC 104.22 102.51 100.42 98.71 96.62 94.91 92.82 PNB 219.01 215.00 210.86 206.85 202.71 198.70 194.56 RANBAXY 764.08 744.54 723.08 703.54 682.08 662.54 641.08 RELCAPITAL 491.72 486.26 479.12 473.66 466.52 461.06 453.92 85.68 84.16 82.13 80.61 78.58 77.06 75.03 RELIANCE 936.37 923.08 912.67 899.38 888.97 875.68 865.27 RELINFRA 501.33 494.52 487.73 480.92 474.13 467.32 460.53 RPOWER 66.15 65.30 64.25 63.40 62.35 61.50 60.45 RECLTD 368.96 357.80 347.81 336.65 326.66 315.50 305.51 MRF RCOM SSLT 214.72 210.83 206.22 202.33 197.72 193.83 189.22 SRTRANSFIN 1239.47 1201.63 1172.67 1134.83 1105.87 1068.03 1039.07 SIEMENS 1118.26 1101.18 1078.41 1061.33 1038.56 1021.48 998.71 344.23 340.12 336.43 332.32 328.63 324.52 320.83 SBIN SAIL 81.18 80.36 79.33 78.51 77.48 76.66 75.63 SUNPHARMA 973.35 953.23 932.25 912.13 891.15 871.03 850.05 SUNTV 474.48 446.19 422.58 394.29 370.68 342.39 318.78 SYNDIBANK 129.93 128.17 126.13 124.37 122.33 120.57 118.53 TATACHEM 455.42 450.96 445.92 441.46 436.42 431.96 426.92 TATACOMM 426.81 420.45 412.36 406.00 397.91 391.55 383.46 2590.07 2567.48 2548.07 2525.48 2506.07 2483.48 2464.07 TATAGLOBAL 162.04 160.97 159.79 158.72 157.54 156.47 155.29 TATAMTRDVR 403.13 394.01 382.78 373.66 362.43 353.31 342.08 TATAMOTORS 609.72 604.46 597.52 592.26 585.32 580.06 573.12 TATAPOWER 92.78 91.54 89.98 88.74 87.18 85.94 84.38 404.03 400.52 395.93 392.42 387.83 384.32 379.73 TECHM 2974.48 2929.74 2895.78 2851.04 2817.08 2772.34 2738.38 TITAN 474.50 456.15 440.70 422.35 406.90 388.55 373.10 80.93 80.22 79.23 78.52 77.53 76.82 75.83 3244.11 3217.03 3179.16 3152.08 3114.21 3087.13 3049.26 TCS TATASTEEL UCOBANK ULTRACEMCO BMA Wealth Creators Equity Research Equity Evening Wrap UNIONBANK 245.58 241.04 234.83 230.29 224.08 219.54 213.33 17.45 17.23 16.95 16.73 16.45 16.23 15.95 UBL 1075.23 1054.12 1027.13 1006.02 979.03 957.92 930.93 UPL 371.19 365.75 360.14 354.70 349.09 343.65 338.04 UNITECH VIJAYABANK 51.11 50.48 49.96 49.33 48.81 48.18 47.66 VOLTAS 290.98 282.94 277.08 269.04 263.18 255.14 249.28 WIPRO 630.81 621.40 614.56 605.15 598.31 588.90 582.06 YESBANK 914.89 904.95 894.24 884.30 873.59 863.65 852.94 ZEEL 397.17 394.36 390.77 387.96 384.37 381.56 377.97 BMA Wealth Creators Equity Research Equity Evening Wrap BMA Wealth Creators Limited Vishwakarma II 29-5A, Dr.Ambedkar Sarani, Topsia Road, Kolkata - 700 046 033-40110099 | Toll Free Number: 18602662131 www.bmawc.com [email protected] | [email protected] www.facebook.com/bmawealth www.twitter.com/bmawealth Disclaimer: This document is for private circulation only. Neither the information nor any opinion expressed constitutes an offer, or any invitation to make an offer, to buy or sell any securities or any options, future or other derivatives related to such securities. BMA Wealth Creators Ltd. or any of its associates or employees do not accept any liability whatsoever direct or indirect that may arise from the use of the information herein. BMA Wealth Creators Ltd. and its affiliates may trade for their own accounts as market maker, block positional, specialist and/or arbitrageur in any securities of this issuer (s) or in related investments, may be on the opposite side of public orders. BMA Wealth Creators Ltd. and its affiliates, directors, officers, employees, employee benefit programs may have a long or short position in any securities of this issuer (s) or in related investments no matter content herein may be reproduced without the prior permission of BMA Wealth Creators Ltd. While there report has been prepared on the basis of published/other publicly available information considered reliable, we are unable to accept any liability for the accuracy of its contents. BMA Wealth Creators Equity Research


© Copyright 2026