
RETHINk YOUR BONDS
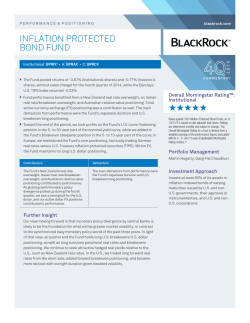
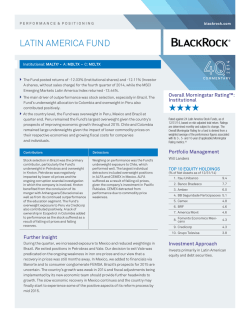
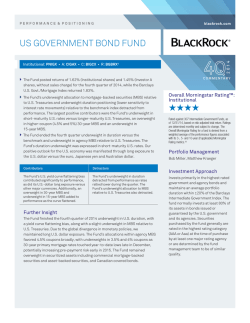
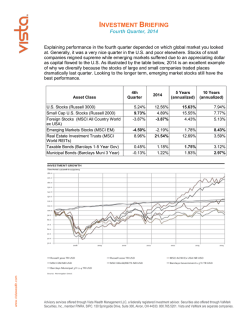
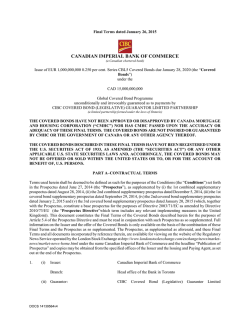
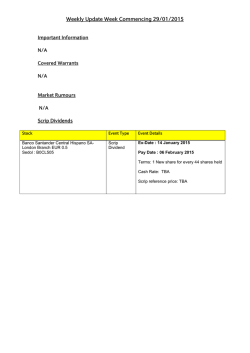
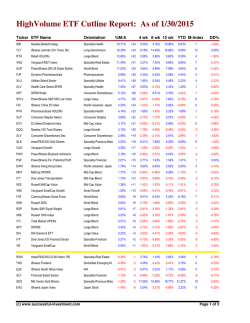
rethink your bonds
Building Better Bond Portfolios
Interest rates may inch up this year, but expect them to be low
for some time to come. You can continue to achieve your fixed
income goals in this environment by blending multiple bond
strategies based on your investing needs.
What role do bonds play in your portfolio?
DIVERSIFICATION
A SOURCE OF PROTECTION
INCOME
Diversify Risk
From Equity Exposure
Guard Against Interest Rate
Risk and Credit Events
Generate Attractive
Income Potential
In the past, you may have been able to achieve your goals with
one strategy. But today, building a bond portfolio requires even
greater skills, insight and more tools.
That was Then, This is Now.
Difference between the 2009 and 2014 bond markets
Diversification is
harder to find.
Interest rate
risk is higher.
Yield is
more elusive.
310% increase in
traditional bond fund
correlation to stocks.*
Duration of traditional
core bonds has gone
up 46%.†
Less than 15% of
Bonds Yield more
than 4%.‡
* Source: Morningstar. As of 12/31/14. Traditional bond funds are represented by the Morningstar Intermediate-Term Bond fund category average. Stocks are represented by
the S&P 500. Based on the 10-year correlation. Past correlations are no guarantee of future correlations. † Source: Barclays Live. As of 12/31/14. Traditional core bonds are
represented by the Barclays U.S. Aggregate Bond Index. Data based on modified duration ‡ Sources: BlackRock Investment Institute, Barclays and Thomson Reuters, 201.
As of 12/31/14.
DIVERSIFICATION
Outcome-Oriented
Active Strategies
Efficient ETFs
So What
Do I Do
with My
Money?
Bonds are the Ballast
in a Diversified Portfolio
While navigating the fixed income market remains challenging, bonds continue to
serve as a critical ballast to your equity investments. Consider using traditional
bond funds to help provide diversification and serve as a buffer from equity
market volatility.
Bonds Delivered When Stocks Didn’t
Negative Stock Market Calendar Years 1929–2014
BlackRock Total Return
Fund | M A H Q X
20%
10
iShares Core U.S. Aggregate
Bond ETF | AG G
0
% RETURN
iShares Core Total USD
Bond Market ETF | IU S B
-10
-20
-30
-40
-50
’29 ’30 ’31 ’32 ’34 ’37 ’39 ’40 ’41 ’46 ’53 ’57 ’62 ’66 ’69 ’73 ’74 ’77 ’81 ’90 ’00 ’01 ’02 ’08
Bonds
Stocks
Source: Morningstar. As of 12/31/14. Past performance does not guarantee or indicate future results. Bond Returns
represented by IA SBBI IT Govt Index from 1929 to 1975 and the Barclays U.S. Aggregate Index from 1976 to 2014.
Stocks are represented by IA SBBI Large Stock Index from 1929 to 1970 and the S&P 500 from 1970 to 2014.
WHEN BONDS MATTERED
THE MOST
24
2008 Credit Crisis Returns
–37%
Source: Morningstar. All data is from 1929–2014
and based on the data in the chart above.
NEG AT I V E C A L END A R
Y E A R S F O R S TO C K S
S TO C K R E T U R N S
92%
O F T H O S E Y E A R S , B O ND S
HAD P OSITIVE RE TURNS
+5.24%
B O ND R E T U R N S
a POTENTIAL source
of protection
Outcome-Oriented
Active Strategies
Efficient ETFs
So What
Do I Do
with My
Money?
BlackRock Strategic Income
Opportunities Fund | B SII X
BlackRock Global Long / Short
Credit Fund | B G CI X
Flexibility is Essential
in Changing Bond Markets
A nimble bond strategy can help you in today’s changing markets. Investor
demand for return, liquidity, and lower volatility makes access to the best fixed
income opportunities critical. We suggest you allocate to funds that can quickly
navigate rate-sensitive parts of the bond market and credit exposures, such as
a flexible, go-anywhere bond portfolio. Want to do it yourself? Consider iBonds
ETFs that are designed to mature in a specified year, so you can use them to
manage interest rate risk as you would with a portfolio of individual bonds.
Flexible Funds Outperformed in Rising and Flat
Rate Periods
Performance in Different Rate Environments
BlackRock Strategic Municipal
Opportunities Fund | M A M T X
iShares® iBonds®
Mature, like a bond. Trade, like
a stock. Diversify, like a fund.*
PERFORMANCE
DURING FLAT RATES
PERFORMANCE
DURING FALLING RATES
Average Rate Move
+ 60 bps
Rate Move
0 bps
Average Rate Move
-55 bps
3.0
2.15
2.0
1.0
* Each iShares iBonds ETF has a specified
maturity date at which time the fund will
distribute its assets, less any liabilities, to then
current shareholders. Like other ETFs, it trades
throughout the day on the stock exchanges at
current market prices and holds a variety of
investments to help diversify the fund.
PERFORMANCE
DURING RISING RATES
0.93
1.40
1.03
0.84
0.68
0.47
0.33
0.0
-1.0
-2.0
-1.45
Rising Rates
Flat Rates
BlackRock Strategic Income Opportunities Fund
Falling Rates
BlackRock Global Long/Short Credit Fund
Barclays U.S. Aggregate Bond Index
Source: Morningstar. As of 12/31/14. Based on the institutional shares of the Funds. Rising, Flat, and Declining rate
periods are calculated using a proprietary methodology that chooses periods based on specific parameters BlackRock
deems sufficient to categorize periods as rising, flat, and declining since 10/1/2011 (BLK GLSC inception).1 BLK Strategic
Income Opportunities Fund (inception 2/5/08) Institutional shares performance as of 12/31/14 is 1 Year, 3.89%;
5 years, 5.83%; Since Inception, 5.13%. Total operating expenses as of the most recent prospectus are 0.92%.
BLK Global Long/Short Credit Fund (inception 9/30/11) Institutional shares performance as of 12/31/14 is 1 Year,
3.31% and Since Inception, 4.74%. Institutional total operating expenses as of the most recent prospectus are
1.85%. Core Bonds are represented by the Barclays U.S. Aggregate Bond Index. Performance for this index is 1
Year, 3.96; 5 Year, 4.12; 10 Year 4.62.
Performance data quoted represents past performance and is no guarantee of
future results. Investment returns and principal values may fluctuate so that an
investor’s shares, when redeemed, may be worth more or less than their original
cost. Current performance may be lower or higher than that shown. All returns
assume reinvestment of all dividend and capital gain distributions. Refer to
blackrock.com for current month-end performance.
income
Outcome-Oriented
Active Strategies
Efficient ETFs
So What
Do I Do
with My
Money?
BlackRock Multi-Asset Income
Fund | B IICX
BlackRock High Yield Bond
Fund | B H Y I X
Look Beyond Traditional
Bonds for Income
What should an income investor consider doing in a low yield environment?
Cast a wider net in pursuit of income. Tactically allocate to high yield funds, and
consider flexible income strategies that invest across all income-producing asset
classes, like equities and alternative investments, to help provide higher yield.
Diversification is not a guarantee against loss (nothing is), but it does spread risk
across a broader set of instruments that may respond differently to a given set of
market conditions.
Income Isn’t What It Used To Be
Percent of Bonds Yielding More Than 4% (2001–2014)
100%
iShares iBoxx $ High Yield
Corporate Bond ETF | H YG
50
0
2001
2002
2003
2004
2005
2006
2007
2008
2009
2010
2011
2012
2013
2014
Sources: BlackRock Investment Institute, Barclays and Thomson Reuters, 201. Based on 20 fixed income indices that
represent the bond markets. As of 12/31/14. Past performance is no guarantee of future results.
S O WHAT DO I DO WITH MY MONE Y?
Evolve Your Portfolio for the New
World of Investing
Outcome-Oriented
Active Strategies
Allocate to active strategies when seeking to achieve
specific outcomes or goals or when you have conviction in a manager
potentially beating a benchmark.
Minimize exposure to mutual funds that don’t offer a differentiated return
after fees and taxes.
Allocate to ETFs when the objective is to attain low-cost,
tax-efficient asset class exposure, or to implement a tactical idea.
Efficient ETFs
What role do bonds play in your portfolio?
DiversificatioN
Allocate to core bond funds to diversify equity exposure.
BlackRock Total Return Fund iShares Core U.S. Aggregate Bond ETF
iShares Core Total USD Bond Market ETF
MAHQX
AG G
IU S B
a POTENTIAL source of protection
Consider flexible bond funds to guard against interest rate and credit events.
BlackRock Strategic Income Opportunities Fund
BlackRock Strategic Municipal Opportunities Fund BlackRock Global Long / Short Credit Fund
B SII X
MAMT X
B G CI X
Do it Yourself:
iShares® iBonds® ETFs
Income
Allocate to higher-yielding solutions to help generate attractive income.
BlackRock Multi-Asset Income Fund
BlackRock High Yield Bond Fund
iShares iBoxx $ High Yield Corporate Bond ETF
B IICX BHYIX
H YG
Why BlackRock®
BlackRock helps millions of people, as well as the world’s largest institutions and governments, pursue their
investing goals. We offer:
}} A comprehensive set of innovative solutions
}} Global market and investment insights
}} Sophisticated risk and portfolio analytics
We work only for our clients, who have entrusted us with managing $4.65 trillion,* earning BlackRock the distinction
of being the world’s largest fiduciary investment manager.†
Want to know more?
blackrock.com
* AUM as of 12/31/14. † Source: Pensions & Investments as of 12/31/13. 1 Rising Rates: Counts period if <= 60 day period with at least a 40 bp increase in 10-year treasury from
start date to end date..10/01/2011 to 10/27/2011,01/31/2012 to 03/19/2012,07/25/2012 to 09/14/2012,11/16/2012 to 02/13/2013,05/01/2013 to 07/05/2013,10/23/2013
to 12/31/2013. Flat Rates: Ending date rate must be within +/- 2 bps of start date rate, Period must be at least 30 days and no more than 90 days (business days) Variance of rate in
the periods must be +/- 15 bps from start date rate on each date over the period (ensures minimal volatility over the period as a whole). 11/17/2011 to 03/06/2012,06/05/2012 to
08/01/2012,10/10/2012 to 12/14/2012,01/03/2013 to 03/25/2013,06/25/2013 to 08/12/2013,09/25/2013 to 11/07/2013,01/30/2014 to 04/29/2014,05/16/2014 to
09/30/2014. Declining Rates: Counts period if <=60 day period with at least a 40 bp decline in 10-year treasury rate from start date to end date;10/27/2011 to 12/19/2011,03/19/2012
to 06/01/2012,03/11/2013 to 05/02/2013,09/05/2013 to 10/23/2013,12/31/2013 to 03/03/2014,07/03/2014 to 10/15/2014.
The opinions presented are as of January 2015 and are subject to change.
Important Risks for the Strategic Income Opportunities, Strategic Municipal Opportunities, Total Return and Global Long/
Short Credit Funds: Bond values fluctuate in price so the value of your investment can go down depending on market conditions.
Fixed income risks include interest rate and credit risk. Typically, when interest rates rise, there is a corresponding decline in bond
values. Credit risk refers to the possibility that the bond issuer will not be able to make principal and interest payments. Principal of
mortgage- or asset-backed securities normally may be prepaid at any time, reducing the yield and market value of those securities.
Obligations of U.S. gov’t agencies are supported by varying degrees of credit but generally are not backed by the full faith and credit of
the U.S. gov’t. International investing involves special risks including, but not limited to currency fluctuations, illiquidity and volatility.
These risks may be heightened for investments in emerging markets. Non-investment grade debt securities (high-yield/junk bonds)
may be subject to greater market fluctuations, risk of default or loss of income and principal than higher-rated securities. Shortselling entails special risks. If the fund makes short sales in securities that increase in value, the fund will lose value. Any loss on
short positions may or may not be offset by investing short sale proceeds in other investments.
Shares of ETFs trade at market price, which may be greater or less than net asset value. The iShares® iBonds® ETFs (“Funds”) will
terminate within the month and year in each Fund’s name. An investment in the Fund(s) is not guaranteed, and an investor may
experience losses and/or tax consequences, including near or at the termination date. In the final months of each Fund’s operation,
its portfolio will transition to cash and cash-like instruments. As a result, its yield will tend to move toward prevailing money market
rates, and may be lower than the yields of the bonds previously held by the Fund and lower than prevailing yields in the bond market.
Non-investment-grade debt securities (high-yield/junk bonds) may be subject to greater market fluctuations, risk of default or loss
of income and principal than higher-rated securities. An investment in the Fund is not insured or guaranteed by the Federal Deposit
Insurance Corporation or any other government agency and its return and yield will fluctuate with market conditions.
Correlation is a statistical measure of how two securities move in relation to each other. A perfect correlation of +1 implies
movement in lockstep, -1 implies movement in the opposite direction, while a correlation of 0 implies completely random movement.
Duration is a measure of a bond’s sensitivity to a change in interest rates. For every year of duration, a bond’s price will move
approximately 1% in the opposite direction of a 1% change in interest rates.
The iShares Funds are not sponsored, endorsed, issued, sold or promoted by Markit Indices Limited, nor does this company make
any representation regarding the advisability of investing in the Funds. BlackRock is not affiliated with Markit Indices Limited.
Carefully consider the iShares Funds’ and BlackRock Mutual Funds’ investment objectives, risk factors, charges and expenses
before investing. This and other information can be found in the Funds’ prospectuses and, if available, summary prospectuses,
which may be obtained by visiting www.iShares.com or blackrock.com. Read the prospectus carefully before investing.
©2015 BlackRock, Inc. All Rights Reserved. BLACKROCK, iSHARES, iBONDS and SO WHAT DO I DO WITH MY MONEY? are registered trademarks
of BlackRock, Inc. or its subsidiaries in the United States and elsewhere. All other trademarks are those of their respective owners.
Prepared by BlackRock Investments, LLC, member FINRA.
Not FDIC Insured • May Lose Value • No Bank Guarantee
Lit. No. RETHINKGDE-0115
2937B-RET-0115 / USR-5038

© Copyright 2026