
Market Outlook
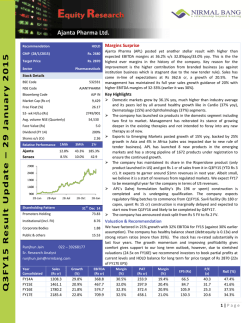
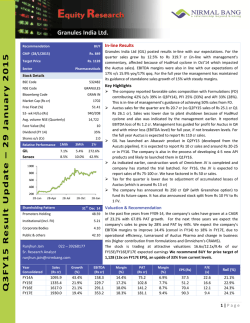
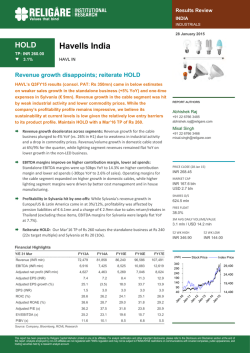
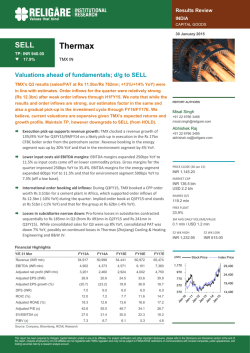
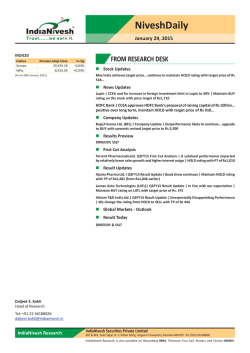
Market Outlook February 02, 2015 Dealer’s Diary Domestic Indices Chg (%) (Pts) (Close) Indian markets are likely to open negative, tracking SGX Nifty and their Asian peers. BSE Sensex (1.7) (499) 29,183 Nifty (1.6) (143) 8,809 US markets ended in red, on concerns of weak Q4 U.S. GDP data (reported 2.6% vs. expectations of 3.3%) and possible impact of Europe’s instability on the U.S. corporates. MID CAP (0.3) (32) 10,739 SMALL CAP (0.4) (49) 11,329 BSE HC (0.5) (83) 15,667 BSE PSU (1.7) (139) 8,205 BANKEX (3.1) (738) 22,716 AUTO (1.2) (245) 19,986 METAL (0.8) (86) 10,190 OIL & GAS (0.6) (65) 10,143 European markets too closed in red. The selling pressure across markets was seen (1) after ECB announced their Euro 60 bn/ p.m. of bond buying programme, and (2) negative commentary by Greece’s FM that Greece would not co-operate with EU and IMF. NIFTY after touching new highs, witnessed sharp selling, due to weak earnings reported by PSU Banks and negative global cues. BANKEX was down 3.1%. BSE IT News Analysis Sun Pharmaceutical wins U.S. approval to buy Ranbaxy Result Review: HCL Tech., Indoco Remedies, Tech Mahindra, Exide Industries. Result Preview: Subros. 0.2 22 11,179 Chg (%) (Pts) (Close) Dow Jones (1.4) (252) 17,165 NASDAQ (1.0) (48) 4,635 FTSE (0.9) (61) 6,749 0.4 68 17,674 Global Indices Nikkei Refer detailed news analysis on the following page Hang Sang (0.4) (89) 24,507 Markets Today Straits Times (0.8) (28) 3,391 The trend deciding level for the day is 29,366 / 8,860 levels. If NIFTY trades above this level during the first half-an-hour of trade then we may witness a further rally up to 29,661 – 30,140/ 8,945 – 9,082 levels. However, if NIFTY trades below 29,366/ 8,860 levels for the first half-an-hour of trade then it may correct towards 28,888 – 28,592 / 8,724 – 8,639 levels. Shanghai Com (1.6) (52) 3,210 Chg (%) (Pts) (Close) INFY (1.6) (0.5) $34.1 Indian ADR WIT (1.8) (0.2) $12.9 Indices S2 S1 PIVOT R1 R2 IBN (5.3) (0.7) $12.0 SENSEX 28,592 28,888 29,366 29,661 30,140 HDB (5.0) (3.0) $57.0 NIFTY 8,639 8,724 8,860 8,945 9,082 Advances / Declines Net Inflows (Jan 29, 2015) ` cr Purch Sales Net MTD YTD FII 8,810 6,984 1,826 12,364 109,714 969 1,618 (649) 271 30,609 MFs ` cr Purch Sales Net Open Interest Index Futures 2,091 2,019 72 22,761 Stock Futures 3,227 4,835 (1,608) 57,404 Gainers / Losers Gainer chg (%) Price (`) chg (%) 110 14.1 BANKBARODA 193 (11.1) 19 11.6 CANBK 443 (5.6) GMRINFRA JPASSOCIAT HCLTECH Loser Price (`) HDIL Company 29 9.2 ORIENTBANK 266 (5.4) 1,794 9.0 SBIN 310 (5.1) 630 7.8 ICICIBANK 361 (5.0) ADANIENT www.angelbroking.com NSE Advances 1,198 579 Declines 1,678 917 113 76 Unchanged Volumes (` cr) FII Derivatives (Jan 30, 2015) Company BSE BSE 4,050 NSE 24,551 Market Outlook February 02, 2015 Sun Pharmaceutical wins U.S. approval to buy Ranbaxy India's Sun Pharmaceutical Industries Ltd has won U.S. approval to buy Ranbaxy Laboratories Ltd on condition that it sell its interest in a generic antibacterial medicine. The FTC, whose job is to ensure that anti-monopoly laws are enforced, did not weigh in on the safety issue but said it would allow the transaction if Ranbaxy sold its interests in generic minocycline tablets and capsules to generic maker Torrent Pharmaceuticals Ltd, which is also based in India. The medicine is commonly used to treat pneumonia, urinary tract infections and acne. This is unlikely to have a greater impact on the companies’ financials. We maintain a neutral stance on both the stocks. Result Review HCL Technologies (CMP: `1,646/ TP: `1,968/ Upside: 19.6%) HCL Technologies announced numbers 2QFY2015 numbers, ahead of expectations, mainly on the sales front. Company posted revenue of US$1,491mn V/s US$1,443mn expected, up 4.0% qoq. In Constant Currency (CC), terms the revenue grew by 6.2% qoq. In rupee terms, the revenue posted a growth of 6.3% qoq to `9,283cr V/s `8,941cr, expected. The sales growth was broad based, in terms of geography- the Americas, Europe and ROW grew by 6.0% qoq , 7.2% qoq and 4.3% qoq CC respectively, driven by Engineering and R&D Services which grew qoq CC at 12.6%, Infrastructure Services at 6.2% qoq CC, Business Services at 4.5% qoq CC and Application Services at 3.8% qoq CC. Across verticals it was led by Life sciences & Healthcare at 19.3% qoq CC, Retail & CPG at 8.6% qoq CC, Public Services at 7.9% qoq CC, Manufacturing at 7.3% qoq CC, Telecommunications, Media, Publishing & Entertainment at 2.0% qoq CC and Financial Services at 1.6% qoq CC. Overall growth during the quarter was driven by the, new client , which accounted for the 4.9% , while the existing business accounted for 95.1% V/s 3.8% by new client and 96.2% existing business respectively in 1QFY2015. On Operating front, EBITDA margins came in almost flat at 25.0% V/s 25.1% expected a qoq dip of 10bps. The utilization levels, during the quarter came in at 82.9% V/s 82.7% in 1QFY2015, while attrition rate came in 6.7% in 2QFY2015 V/s 5.9% in 1QFY2015. Thus, PAT came in at `1,915cr V/s `1,912cr, up 2.3% qoq. In terms, of client addition, the company added 1 additional client in the US$ 50mn+, 2 in the US$ 40mn+, 2 in the US$20mn+ and 6 in the US$10mn+. The major client additional happened in the US$1-5mn bracket. Board recommends issue of Bonus shares in the ratio of 1:1. We maintain our buy rating on the stock with a price target of `1,968. www.angelbroking.com Y/E Sales OPM March (` cr) PAT EV/EBITDA EV/Sales (x) (x) (x) (x) 91.9 24.6 19.7 4.9 13.3 3.1 7,700 109.0 23.8 16.5 3.9 10.9 2.6 (%) (` cr) FY2015E 36,528 23.3 6,280 FY2016E 41,535 24.0 EPS ROE (`) (%) P/E P/BV Market Outlook February 02, 2015 Indoco Remedies (CMP: `320/ TP: / Upside :) Indoco Remedies posted 3QFY2015 results marginally better than expectations, on the net profit front, while net sales came in at marginally lower. The sales, during the quarter grew at 13.0% yoy, mainly on back of the exports to end the period at `213cr V/s expectation of `216cr. Exports (40% of sales) during the quarter, came in at `83.3cr, registering a growth of 22.9% yoy, while the domestic sales grew by 7.4% yoy. The domestic formulation sales (`122.8cr) during the quarter grew by 6.9% yoy. The regulated market during the quarter grew by 26.7 % at `66.3cr as against `52.3cr during the same quarter last year. The OPM came higher at 18.3% than expected 17.0% V/s 16.2% in 3QFY2014, an expansion of 210bps yoy. The expansion in the OPM was driven by the 195bps expansion in the gross margins (63.5% in 3QFY2015 V/s 61.6% in 3QFY2014), along with the lower rise in the other expenditure. This along with the lower interest expenditure, which dipped by 29.8% aided the net profit increase by 54.3% yoy to `21.6cr V/s `20cr expected. We remain neutral on the stock. Y/E Sales OPM PAT EPS ROE P/E March (` cr) (%) (` cr) (`) (%) (x) P/BVEV/EBITDA EV/Sales (x) (x) (x) FY2015E 856 18.2 82 8.9 16.7 36.1 5.6 19.8 3.6 FY2016E 1,112 18.2 117 12.7 20.2 25.3 4.7 15.2 2.8 Tech Mahindra (CMP: `2,878/ TP: / Upside:) Tech Mahindra announced its 3QFY2015, in line with expectations on the sales and the EBIT front, while net profit was marginally above. The company clocked 2.7% qoq USD revenue growth to end the period at US$924mn V/s US$920mn expected. On constant currency terms (CC), the company posted a 4.9% qoq growth. In INR terms, the consolidated revenues came in at `5752cr V/s `5,702cr expected, up ~4.8% qoq. The growth in terms of verticals was lead by the manufacturing vertical, which constituted 19.7% of sales V/s 17.7% in 2QFY2015. Also, new clients added significant to the growth taking their contribution from 3% in 2QFY2015 to 5% in 3QFY2015. On the Operating front, the EBITDA margin of Tech Mahindra moved upwards by 17bp qoq to 20.2% V/s 20.4% expected. The company’s utilization rates improved up to 74% in 3QFY2015 from 73% in 2QFY2015, while attrition inched upwards to 19% from 18% in 2QFY2015. Tech Mahindra’s net profit grew by 11.9% qoq to `805cr V/s `766cr expected. The variance is mainly on back of lower than expected tax expenses during the period. In terms of client addition, the company added 1 in the US$50mn+, 2 in the US$20mn+ and 1 in US$10mn+ bracket. Also, the company announced the approval for a 1:1 bonus and sub-division of its equity shares in the ratio of 2:1. We remain neutral on the stock. www.angelbroking.com Y/E Sales OPM PAT EPS March (` cr) (%) (` cr) (`) FY2015E 21,656 22.4 FY2016E 27,754 22.0 ROE P/E P/BV EV/EBITDA EV/Sales (x) (x) (x) (x) 3,206 137.3 26.4 21.0 5.6 12.8 2.9 3,712 159.0 23.7 18.0 4.4 10.5 2.1 (%) Market Outlook February 02, 2015 Exide Industries (CMP: `186/ TP: /Upside :) Exide Industries Ltd (EIL) 3QFY2015 results were below our estimates due to continued weak operating performance. Revenues grew 19% yoy to `1,558 cr (in line with our estimates) led by healthy growth in the aftermarket segment and recovery in the OEM sales. However, Exide continued to disappoint on the operating front, reporting margin of 11.6% (significantly lower than our estimate of 14.1%). The operating margins declined 20 bp on sequential basis. We believe EIL is facing pricing pressures given the increased competition, resulting into lower margins. Further, lower other income at `1.2cr (decline of 75% yoy) dragged the profitability. Net Profit at `97.2cr was way below our estimate of `130.3 cr. Currently, we have Neutral rating on the stock. Y/E Sales OPM March (` cr) PAT EV/EBITDA EV/Sales (x) (x) (x) (x) 567 6.7 13.8 27.9 3.9 16.2 2.1 706 8.3 15.5 22.4 3.5 13.0 1.8 (%) (` cr) FY2015E 7,289 12.9 FY2016E 8,528 13.5 EPS ROE (`) (%) P/E P/BV Result Preview Subros (CMP: `68/ TP: `80 /Upside: 18% ) Subros Ltd 3QFY2015 top-line is expected to grow 11% yoy. We expect the volumes to grow 5% yoy while the realization is estimated to grow 7% yoy on back of price hikes. We estimate the operating margins to improve 60 bp yoy to 11.1% due to operating leverage and price hikes. Net Profit is estimated to grow 53% yoy to `2.7cr. Currently, we have Buy rating on the stock. Y/E Sales OPM March (` cr) PAT EPS ROE EV/EBITDA EV/Sales (x) (x) (x) (x) 3.2 6.2 21.2 1.3 5.8 0.6 4.4 8.1 15.5 1.2 5.0 0.5 (%) (` cr) (`) FY2015E 1,255 11.2 19 FY2016E 1,416 11.3 26 (%) P/E P/BV Economic and Political News Oil ministry proposes to bring gas-based power plants under price-pooling scheme Centre to pump `1.5 lakh-cr in four new steel plants Indian Consumer Spending to Surge to $4.2 tn Corporate News www.angelbroking.com Adani Power to bid for all six reserved coal blocks IOB to raise `1,000cr to augment addn'l Tier-1 capital NMDC slashes iron ore prices by 5-10% for February Market Outlook February 02, 2015 Quarterly Bloomberg Brokers Consensus Estimate Bharat Forge Ltd - February 02, 2015 Particulars (` cr) 3QFY15E 3QFY14 y-o-y (%) 2QFY15 q-o-q (%) 1,115 809 37.9 1,109 0.6 EBITDA 319 214 48.9 325 (1.6) EBITDA margin (%) 28.6 26.5 Net profit 170 94 Net sales 29.3 80.5 174 (2.8) y-o-y (%) 2QFY15 q-o-q (%) Cummins India Ltd - February 02, 2015 Particulars (` cr) Net sales 3QFY15E 3QFY14 1,148 1,001 14.7 1,117 2.7 EBITDA 193 198 (2.3) 190 1.6 EBITDA margin (%) 16.8 19.7 Net profit 167 147 13.6 202 (17.4) 3QFY15E 3QFY14 y-o-y (%) 2QFY15 q-o-q (%) 2,963 2,605 13.8 2,618 13.2 EBITDA 530 465 13.9 481 10.2 EBITDA margin (%) 17.9 17.9 Net profit 247 222 11.2 166 48.9 4QCY14E 4QCY13 y-o-y (%) 3QCY14 q-o-q (%) 2,826 2,693 4.9 2,742 3.1 EBITDA 281 361 (22.2) 379 (25.7) EBITDA margin (%) 10.0 13.4 Net profit 192 278 17.0 UPL Ltd Consol - February 02, 2015 Particulars (` cr) Net sales 18.4 ACC Ltd - February 03, 2015 Particulars (` cr) Net sales 13.8 (31.0) 205 (6.4) Crompton Greaves Ltd Consol - February 03, 2015 Particulars (` cr) Net sales EBITDA 3QFY15E 3QFY14 y-o-y (%) 2QFY15 q-o-q (%) 3,575 3,352 6.7 3,430 4.2 16.8 168 15.9 195 167 EBITDA margin (%) 5.5 5.0 Net profit 90 62 4.9 45.1 70 29.3 Hero MotoCorp Ltd - February 03, 2015 Particulars (` cr) 3QFY15E 3QFY14 y-o-y (%) 2QFY15 q-o-q (%) 6,770 6,846 (1.1) 6,864 (1.4) EBITDA 926 898 3.1 935 (0.9) EBITDA margin (%) 13.7 13.1 Net profit 710 525 Net sales www.angelbroking.com 13.6 35.4 763 (7.0) Market Outlook February 02, 2015 Jindal Steel & Power Ltd Consol - February 03, 2015 Particulars (` cr) 2QFY15E 2QFY14 y-o-y (%) 1QFY15 q-o-q (%) Net sales 5,151 5,336 (3.5) 5,073 1.5 EBITDA 1,616 1,701 (5.0) 1,636 (1.2) EBITDA margin (%) 31.4 31.9 Net profit 159 562 (71.6) 442 (64.0) 3QFY15E 3QFY14 y-o-y (%) 2QFY15 q-o-q (%) 3,352 2,983 12.4 3,117 7.6 EBITDA 904 773 16.9 833 8.6 EBITDA margin (%) 27.0 25.9 Net profit 574 476 20.5 639 (10.3) 3QFY15E 3QFY14 y-o-y (%) 2QFY15 q-o-q (%) 1,350 1,123 20.1 2,086 (35.3) 14.2 1,288 (42.8) 32.3 Lupin Ltd Consol - February 03, 2015 Particulars (` cr) Net sales 26.7 NHPC Ltd - February 03, 2015 Particulars (` cr) Net sales EBITDA 737 645 EBITDA margin (%) 54.6 57.4 Net profit 279 259 61.7 7.4 684 (59.3) Punjab National Bank - February 03, 2015 Particulars (` cr) Net profit 3QFY15E 3QFY14 y-o-y (%) 2QFY15 q-o-q (%) 977 755 29.3 575 69.8 Bharti Airtel Ltd Consol - February 04, 2015 Particulars (` cr) Net sales EBITDA EBITDA margin (%) Net profit 3QFY15E 3QFY14 y-o-y (%) 2QFY15 q-o-q (%) 23,489 21,939 7.1 22,845 2.8 7,932 7,100 11.7 7,700 3.0 33.8 32.4 1,352 610 121.6 1,383 (2.3) 3QFY15E 3QFY14 y-o-y (%) 2QFY15 q-o-q (%) 734 409 79.3 627 17.1 33.7 Canara Bank - February 04, 2015 Particulars (` cr) Net profit Tata Power Co Ltd Consol - February 04, 2015 Particulars (` cr) www.angelbroking.com 3QFY15E 3QFY14 y-o-y (%) 2QFY15 q-o-q (%) Net sales 8,982 8,656 3.8 8,364 7.4 EBITDA 1,823 1,786 2.0 1,692 7.7 EBITDA margin (%) 20.3 20.6 Net profit 104 (75) 20.2 0.0 (78) 0.0 Market Outlook February 02, 2015 Result Calendar Date Company February 2, 2015 February 6, 2015 United Phosphorus, Bharat Forge, Cummins India, LMW, Indian Bank Hero Motocorp, TVS Motor, Crompton Greaves, ACC, Punjab Natl.Bank, GlaxoSmith Con, Marico, Britannia, Jindal Steel, Lupin, NHPC KEC International, J K Lakshmi Cements, Canara Bank, Central Bank, Tide Water Oil India, Aurobindo Pharma, Alembic Pharma, Tata Power Co. Tata Motors, Automotive Axle, CEAT, Ramco Cements, Allahabad Bank, IOB, UCO Bank, Godrej Consumer, PTC India Tata Chemicals, Apollo Tyres, Sun TV Network, NMDC, Tata Steel, GAIL February 7, 2015 Ipca labs, GIPCL February 9, 2015 Styrolution, Sterling Tools February 10, 2015 Motherson Sumi, ABB, Nalco, Cadila Healthcare February 11, 2015 FAG Bearings, Power Fin.Corpn., Syndicate Bank, BPCL February 12, 2015 Hindalco, ONGC, Page Industries, Bajaj Electrical, Finolex Cables, MRF, GSK Pharma, CESC February 13, 2015 M&M, Subros, Rural Elec.Corp., Nestle, Mphasis, HPCL February 3, 2015 February 4, 2015 February 5, 2015 Source: Bloomberg, Angel Research Global economic events release calendar Date Time Country Event Description Unit Period Bloomberg Data Last Reported Estimated February 2, 2015 2:25PM Germany PMI Manufacturing Value 3:00PM UK PMI Manufacturing February 3, 2015 11:00AM India RBI Reverse Repo rate 11:00AM India RBI Repo rate RBI Cash Reserve ratio 11:00AM India February 4, 2015 2:25PM Germany PMI Services February 5, 2015 5:30PM UK BOE Announces rates February 6, 2015 7:00PM US Change in Nonfarm payrolls 7:00PM US Unnemployment rate China India February 8, 2015 February 9, 2015 5:30PM February 10, 2015 Jan F 51.00 -- Value Jan 52.50 -- % Feb 3 6.75 6.75 % Feb 3 7.75 7.75 % Feb 3 4.00 4.00 Value Jan F 52.70 -- % Ratio Feb 5 0.50 0.50 Thousands Jan 252.00 233.00 % Jan 5.60 5.60 Exports YoY% % Change Jan 9.70 -- Qtrly GDP YoY% % Change 4Q 5.30 -- India Imports YoY% % Change Jan (4.78) -- India Exports YoY% % Change Jan (3.77) -- 7:00AM China Consumer Price Index (YoY) % Change Jan 1.50 -- 3:00PM UK Industrial Production (YoY) % Change Dec 1.10 -- February 12, 2015 5:30PM India Industrial Production YoY % Change Dec 3.80 -- February 13, 2015 3:30PM Euro Zone Euro-Zone GDP s.a. (QoQ) % Change 4Q A 0.20 -- 12:30PM Germany GDP nsa (YoY) % Change 4Q P 1.20 -- February 16, 2015 12:00PM India Monthly Wholesale Prices YoY% % Change Jan 0.11 -- February 17, 2015 3:00PM UK CPI (YoY) % Change Jan 0.50 -- February 18, 2015 3:00PM UK Jobless claims change % Change Jan (29.70) -- 7:00PM US Building permits Thousands Jan 1,032.00 -- 7:00PM US Housing Starts Thousands Jan 1,089.00 -- 7:45PM US Industrial Production % Jan (0.11) -- February 23, 2015 8:30PM US Existing home sales Million Jan 5.04 -- February 24, 2015 8:30PM US Consumer Confidence S.A./ 1985=100 Feb 102.90 -- 3:30PM Euro Zone Euro-Zone CPI (YoY) % Jan F (0.20) -- February 25, 2015 8:30PM US New home sales Thousands Jan 481.00 -- February 26, 2015 7:00PM US Consumer price index (mom) % Change Jan (0.37) -- Source: Bloomberg, Angel Research Market Outlook February 02, 2015 h Macro watch Exhibit 2: IIP trends (%) (%) 12.0 11.0 10.0 9.0 8.0 7.0 6.0 5.0 4.0 3.0 8.0 2.0 (0.5) (2.0) (2.0) 56.0 6.0 5.0 5.6 5.7 Services PMI 5.4 52.0 3.9 50.0 2.4 48.0 Dec-14 Nov-14 Nov-14 Oct-14 Sep-14 Aug-14 Jul-14 Aug-14 Jun-14 May-14 Apr-14 Jun-14 Jan-15 Dec-14 Nov-14 Oct-14 CRR Nov-14 Sep-14 Sep-14 Aug-14 Jul-14 Jul-14 Reverse Repo rate Jun-14 May-14 Mar-14 Mar-14 Jan-14 Dec-14 Nov-14 3.00 Oct-14 4.00 (30.0) Sep-14 5.00 (20.0) Aug-14 (10.0) Jul-14 6.00 Jun-14 0.0 May-14 7.00 Apr-14 8.00 10.0 Mar-14 20.0 Source: Bloomberg, Angel Research Repo rate (%) 9.00 Apr-14 Imports yoy growth Feb-14 Exports yoy growth Exhibit 6: Key policy rates May-14 Exhibit 5: Exports and imports growth trends Feb-14 Apr-14 Dec-14 Nov-14 Oct-14 Sep-14 Aug-14 Jul-14 Jun-14 May-14 Apr-14 Mar-14 44.0 Source: Market, Angel Research; Note: Level above 50 indicates expansion Source: MOSPI, Angel Research (%) 30.0 46.0 Feb-14 0.1 Mar-14 0.0 0.0 Jan-14 1.0 Feb-14 1.7 2.0 Dec-13 3.0 Nov-13 4.0 Feb-14 Mfg. PMI 54.0 5.0 Jan-14 Nov-14 Exhibit 4: Manufacturing and services PMI (%) 6.2 Oct-14 Feb-14 Jan-14 Dec-13 2QFY15 1QFY15 4QFY14 3QFY14 2QFY14 1QFY14 4QFY13 3QFY13 2QFY13 1QFY13 4QFY12 3QFY12 2QFY12 (4.2) (6.0) Source: MOSPI, Angel Research Exhibit 3: Monthly WPI inflation trends 7.0 0.5 - (4.0) 1QFY12 0.9 Sep-14 4.5 4.6 4.4 4.4 4.4 4.8 4.6 4.6 5.3 1.1 0.1 Aug-14 5.7 Jul-14 5.8 Jun-14 6.5 3.8 2.8 Apr-14 7.0 Mar-14 7.6 4.3 3.7 4.0 Source: CSO, Angel Research 6.0 5.6 6.0 May-14 Exhibit 1: Quarterly GDP trends Source: RBI, Angel Research www.angelbroking.com www.angelbroking.com Market Outlook February 02, 2015 h Global watch Exhibit 1: Latest quarterly GDP Growth (%, yoy) across select developing and developed countries (%) 8.0 6.0 4.0 5.0 5.3 5.0 5.6 7.3 7.0 Japan (1.3) Germany France 0.4 1.2 2.7 USA 2.6 UK Thailand Malaysia Indonesia South Africa 0.6 0.7 China (2.0) India (1.0) Russia - Brazil 1.0 (0.2) 2.0 1.4 3.0 Source: Bloomberg, Angel Research Exhibit 2: 2014 GDP Growth projection by IMF (%, yoy) across select developing and developed countries (%) 8.0 7.0 6.0 5.0 4.0 0.9 Japan 0.4 France USA UK Thailand Malaysia Indonesia South Africa China India Russia Brazil - Germany 1.4 2.2 3.2 1.0 5.9 5.2 1.4 7.4 5.6 1.0 0.3 2.0 0.2 3.0 Source: IMF, Angel Research 15.8 15.0 15.8 16.5 13.4 Malaysia Thailand UK USA Germany 15.0 15.5 Indonesia Japan 16.9 South Africa 15.2 11.7 China France 17.1 India 5.4 Russia Brazil (x) 18.0 16.0 14.0 12.0 10.0 8.0 6.0 4.0 2.0 - 10.6 Exhibit 3: One year forward P-E ratio across select developing and developed countries Source: Bloomberg, Angel Research www.angelbroking.com www.angelbroking.com Market Outlook February 02, 2015 h Exhibit 4: Relative performance of indices across globe Returns (%) Country Name of index Closing price 1M 3M 1YR Brazil Bovespa 46,908 (6.3) (6.0) (0.2) Russia Micex 1,648 17.8 20.0 12.6 India Nifty 8,809 8.7 11.2 42.4 China Shanghai Composite 3,210 3.3 37.5 62.4 South Africa Top 40 45,111 2.9 5.5 9.5 Mexico Mexbol 40,951 (2.0) (3.5) 3.6 Indonesia LQ45 912 2.0 6.8 21.5 Malaysia KLCI 1,781 0.8 (3.1) 0.2 Thailand SET 50 1,050 4.1 4.3 20.8 USA Dow Jones 17,165 (4.7) 2.3 8.5 UK FTSE 6,749 3.3 7.3 4.8 Japan Nikkei 17,674 (1.4) 15.9 11.3 Germany DAX 10,694 8.6 18.4 14.3 France CAC 4,604 7.3 12.6 12.0 Source: Bloomberg, Angel Research www.angelbroking.com www.angelbroking.com Market Outlook February 02, 2015 Stock Watch Company Name Reco CMP Target Mkt Cap ( Č) Price ( Č) ( Č cr ) Sales ( Č cr ) FY15E OPM(%) EPS ( Č) FY16E FY15E FY16E PER(x) P/BV(x) RoE(%) EV/Sales(x) FY15E FY16E FY15E FY16E FY15E FY16E FY15E FY16E FY15E FY16E Agri / Agri Chemical Rallis Neutral 225 - 4,384 2,020 2,365 13.9 13.9 9.0 10.5 25.1 21.5 5.2 4.4 22.6 22.4 2.2 1.9 United Phosphorus Buy 368 424 15,773 11,850 13,627 17.3 17.3 29.9 35.3 12.3 10.4 2.5 2.1 22.2 21.7 1.5 1.2 Auto & Auto Ancillary Ashok Leyland Buy 66 78 18,697 13,915 17,882 7.6 9.5 0.8 2.8 82.1 23.5 3.5 3.3 4.4 14.0 1.3 1.0 Bajaj Auto Neutral 2,389 - 69,140 22,473 26,699 19.6 19.8 111.8 133.6 21.4 17.9 6.4 5.5 27.5 30.5 2.7 2.2 Eicher Motors Neutral 16,276 - 44,115 11,916 16,150 15.8 17.8 425.3 673.9 38.3 24.2 12.7 9.1 33.0 37.6 3.6 2.6 Hero Motocorp Buy 2,870 3,462 57,301 28,387 33,935 14.0 15.0 143.7 182.2 20.0 15.8 8.2 7.1 41.2 45.2 1.8 1.5 L G Balakrishnan & Bros Accumulate 613 675 962 1,239 1,423 12.9 13.1 47.2 51.9 13.0 11.8 2.6 2.2 19.9 18.4 0.9 0.7 Mahindra and Mahindra Accumulate 1,263 1,428 78,444 39,758 44,615 12.9 13.1 55.9 65.2 22.6 19.4 3.9 3.4 17.4 17.7 1.7 1.5 Maruti Accumulate 3,645 4,135 110,116 50,232 60,257 12.7 14.8 119.6 181.0 30.5 20.1 4.7 4.0 15.4 20.1 2.0 1.6 Tata Motors Neutral 585 - 157,591 252,586 306,563 15.7 15.0 47.2 51.8 12.4 11.3 2.4 2.0 19.1 17.6 0.8 0.7 TVS Motor Neutral 308 - 14,640 10,521 12,856 6.3 7.9 8.5 15.0 36.3 20.5 8.6 6.5 23.7 31.5 1.3 1.1 Amara Raja Batteries Neutral 861 - 14,701 4,285 5,355 17.2 17.4 25.2 31.8 34.2 27.1 8.6 6.8 25.2 25.2 3.4 2.7 Exide Industries Neutral 186 - 15,823 7,289 8,383 13.5 14.0 7.1 8.5 26.2 21.9 3.8 3.4 14.7 15.8 1.9 1.6 Apollo Tyres Accumulate 242 263 12,339 14,514 16,334 14.5 14.8 20.4 23.9 11.9 10.1 2.2 1.8 18.7 18.1 0.9 0.8 Ceat Buy 820 989 3,318 6,202 7,386 12.1 12.2 76.3 89.9 10.8 9.1 2.3 1.8 23.7 22.3 0.8 0.7 JK Tyres Buy 121 165 2,739 7,616 8,372 13.0 13.6 16.5 19.4 7.3 6.2 1.9 1.5 26.2 23.9 0.6 0.6 Sterling Tools Buy 330 397 226 342 394 47.5 54.8 27.4 33.1 12.1 10.0 2.0 1.7 16.2 16.7 0.8 0.7 Swaraj Engines Buy 873 1,056 1,085 665 759 15.1 15.0 61.9 70.4 14.1 12.4 4.1 3.4 29.4 27.3 1.4 1.2 Subros Buy 68 80 408 1,255 1,416 11.2 11.3 3.2 4.4 21.3 15.5 1.3 1.2 6.2 8.1 0.7 0.6 Capital Goods BGR Energy Neutral 155 - 1,122 3,938 4,362 11.6 11.8 23.9 27.1 6.5 5.7 0.8 0.7 19.9 17.6 0.9 0.9 BHEL Neutral 292 - 71,421 36,844 36,607 10.8 10.8 11.8 11.4 24.7 25.5 2.4 2.2 10.2 9.0 1.8 1.8 Blue Star Accumulate 335 377 3,008 3,202 3,619 4.3 4.6 8.7 9.4 38.7 35.6 5.6 5.0 15.4 14.9 1.0 0.9 Crompton Greaves Buy 190 235 11,889 14,899 16,720 6.6 7.2 7.9 10.0 24.0 19.0 3.0 2.7 12.9 14.8 0.9 0.8 KEC International Buy 94 109 2,422 8,657 9,879 7.2 7.5 7.1 9.9 13.3 9.5 1.8 1.6 22.9 24.7 0.5 0.4 Thermax Neutral 1,146 - 13,651 6,091 6,988 9.4 9.7 29.5 35.6 38.8 32.2 5.9 5.1 16.0 17.0 2.2 1.9 ACC Neutral 1,560 - 29,289 12,249 13,960 14.9 15.6 56.1 69.1 27.8 22.6 3.5 3.2 13.0 14.9 2.1 1.9 Ambuja Cements Neutral 249 - 38,558 10,116 11,296 21.8 22.9 8.5 10.2 29.4 24.4 3.8 3.5 13.3 14.9 3.3 2.9 India Cements Buy 108 146 3,307 5,086 5,869 10.5 11.3 3.2 6.1 33.2 17.6 1.3 1.3 3.5 7.4 1.2 1.0 J K Lakshmi Cement Accumulate 388 437 4,566 2,475 3,312 17.7 20.6 9.8 21.8 39.6 17.8 3.3 2.9 8.6 17.3 2.3 1.7 Cement www.angelbroking.com Market Outlook February 02, 2015 Stock Watch Company Name Reco CMP Target Mkt Cap Sales ( Č cr ) OPM(%) EPS ( Č) PER(x) P/BV(x) RoE(%) ( Č) Price ( Č) ( Č cr ) FY15E FY16E FY15E FY16E FY15E FY16E FY15E FY16E FY15E FY16E EV/Sales(x) FY15E FY16E FY15E FY16E Cement Mangalam Cements Buy 321 389 857 1,001 1,189 13.4 15.0 16.7 29.9 19.2 10.7 1.6 1.5 8.5 14.1 1.2 0.9 Orient Cement Neutral 189 - 3,879 1,622 2,185 19.3 22.0 8.0 7.8 23.8 24.3 4.1 3.7 18.4 16.0 3.2 2.4 Ramco Cements Neutral 364 - 8,652 4,251 5,018 17.4 19.5 9.6 16.4 37.8 22.2 3.2 2.9 8.8 13.6 2.7 2.2 Shree Cement^ Neutral 10,956 - 38,169 6,558 8,056 24.4 25.3 272.3 360.5 40.2 30.4 7.2 6.0 19.4 21.5 5.4 4.4 UltraTech Cement Accumulate 3,140 3,526 86,157 24,053 28,387 20.7 23.3 91.0 129.0 34.5 24.3 4.4 3.8 13.6 16.9 3.7 3.1 Buy 438 561 908 2,038 2,507 11.2 12.4 43.0 43.0 10.2 10.2 1.4 1.2 15.9 12.6 1.1 1.1 Axis Bank Buy 589 686 139,163 22,498 26,155 3.6 3.7 31.3 37.1 18.8 15.9 3.2 2.8 17.9 18.4 - - Bank of Baroda Buy 193 264 41,514 18,371 20,677 2.0 2.1 23.8 27.3 8.1 7.1 1.1 1.0 13.5 13.8 - - Bank of India Buy 267 373 17,148 16,297 18,384 2.1 2.1 50.7 60.9 5.3 4.4 0.7 0.6 11.9 12.9 - - Canara Bank Buy 443 548 20,438 14,057 15,709 2.0 2.0 59.9 71.0 7.4 6.2 0.9 0.8 11.0 11.9 - - Dena Bank Buy Federal Bank Accumulate HDFC Construction MBL Infrastructures Financials 57 77 3,047 3,775 4,298 2.2 2.3 7.4 9.1 7.7 6.2 0.6 0.5 6.2 7.3 - - 142 150 12,155 3,182 3,506 3.2 3.2 11.7 12.2 12.1 11.6 1.6 1.4 13.6 12.9 - - Neutral 1,266 - 199,011 9,842 11,678 3.6 3.6 40.5 48.2 31.2 26.3 6.4 5.7 28.1 28.9 - - HDFC Bank Accumulate 1,076 1,140 260,261 30,897 37,011 4.4 4.4 42.5 52.1 25.3 20.7 5.0 4.2 21.5 22.3 - - ICICI Bank Buy 361 463 209,195 30,623 36,128 3.2 3.2 19.7 23.5 18.3 15.4 2.8 2.4 15.2 16.0 - - IDBI Bank Accumulate 71 81 11,372 9,378 10,281 1.9 1.9 6.2 7.0 11.4 10.1 0.5 0.5 4.5 4.9 - - Indian Bank Buy 186 255 8,625 6,094 6,679 2.5 2.5 23.3 27.3 8.0 6.8 0.6 0.6 7.6 8.4 - - LIC Housing Finance Accumulate 480 541 24,204 2,504 2,969 2.3 2.3 29.0 33.9 16.5 14.2 2.9 2.5 18.1 18.2 - - Punjab Natl.Bank Buy 190 256 34,379 22,911 25,755 3.0 3.0 21.6 31.0 8.8 6.1 1.0 0.9 11.3 13.8 - - South Ind.Bank Accumulate 28 31 3,740 1,849 1,984 2.4 2.4 2.9 3.5 9.6 7.9 1.1 1.0 11.4 12.6 - - St Bk of India Accumulate 310 355 231,438 75,211 86,339 3.0 3.0 18.2 24.0 17.0 12.9 2.0 1.7 11.3 13.8 - - Union Bank Buy 209 248 13,288 11,766 13,312 2.4 2.4 29.3 34.6 7.1 6.0 1.0 0.9 10.5 11.4 - - Vijaya Bank Buy 50 58 4,270 2,953 3,269 1.5 1.5 5.5 6.6 9.0 7.6 0.9 0.9 8.1 9.1 - - Yes Bank Buy 863 1,031 36,013 5,534 6,899 3.1 3.2 48.8 60.7 17.7 14.2 3.1 2.6 21.5 19.7 - - FMCG Asian Paints Neutral 857 - 82,246 14,498 16,653 16.0 16.0 15.6 17.7 55.0 48.5 16.0 12.9 32.4 29.4 5.6 4.8 Britannia Neutral 1,889 - 22,649 7,056 8,065 9.7 9.6 40.4 47.2 46.8 40.0 18.0 13.3 45.1 38.3 3.1 2.7 Colgate Neutral 1,880 - 25,563 4,165 4,836 17.7 18.4 43.5 50.5 43.3 37.2 37.2 28.4 94.1 86.7 6.0 5.1 Dabur India Neutral 256 - 44,993 8,135 9,370 17.1 17.1 6.4 7.3 40.3 34.9 13.3 10.5 36.9 33.7 5.5 4.7 GlaxoSmith Con* Neutral 5,626 - 23,659 4,259 4,919 15.7 15.9 143.2 168.3 39.3 33.4 11.8 9.5 33.1 31.4 5.1 4.3 www.angelbroking.com Market Outlook February 02, 2015 Stock Watch Company Name Reco CMP Target Mkt Cap ( Č) Price ( Č) ( Č cr ) Sales ( Č cr ) OPM(%) EPS ( Č) PER(x) P/BV(x) FY15E FY16E FY15E FY16E FY15E FY16E FY15E FY16E FY15E RoE(%) EV/Sales(x) FY16E FY15E FY16E FY15E FY16E FMCG Godrej Consumer Neutral 1,062 - 36,142 8,777 10,168 15.4 15.6 26.1 31.1 40.7 34.1 8.0 6.7 19.7 19.7 4.2 3.6 HUL Neutral 933 - 201,786 31,055 34,940 13.7 14.2 18.3 20.1 50.9 46.4 42.7 30.8 99.0 77.0 6.3 5.6 ITC Accumulate 369 409 294,876 38,185 44,068 37.7 37.8 12.7 14.6 29.0 25.2 9.5 8.1 32.7 32.1 7.4 6.4 Marico Neutral 359 - 23,177 5,406 6,351 15.7 15.7 8.6 10.4 41.8 34.6 12.9 10.1 30.7 29.0 4.2 3.6 Nestle* Neutral 7,109 - 68,543 10,356 11,691 22.0 22.2 138.0 160.9 51.5 44.2 21.7 16.5 48.0 55.0 6.5 5.7 Tata Global Buy 159 186 9,814 8,615 9,562 9.5 9.5 8.1 8.9 19.7 17.9 2.4 2.3 9.1 9.4 1.1 1.0 IT HCL Tech^ Accumulate 1,794 1,968 126,021 36,528 41,535 23.2 24.0 96.8 109.3 18.5 16.4 4.8 3.9 24.3 23.9 3.1 2.6 Infosys Accumulate 2,143 2,449 246,089 53,943 59,985 28.0 28.0 110.2 119.8 19.4 17.9 4.4 3.8 22.5 21.0 3.9 3.4 TCS Accumulate 2,481 2,833 485,960 95,106 108,420 29.6 29.2 110.2 123.9 22.5 20.0 8.1 7.2 35.9 35.7 4.8 4.2 Tech Mahindra Neutral 2,878 - 69,078 21,656 27,724 22.4 20.0 137.3 158.5 21.0 18.2 5.6 4.4 26.4 23.7 2.8 2.1 Wipro Buy 606 711 149,683 50,000 56,000 23.1 23.7 35.6 39.5 17.0 15.4 3.6 3.0 21.2 19.8 2.5 2.1 D B Corp Neutral 384 - 7,054 2,007 2,241 26.9 26.8 17.7 19.8 21.7 19.4 5.3 4.6 24.4 23.7 3.5 3.1 HT Media Neutral 134 - 3,119 2,301 2,495 12.4 12.4 7.5 8.0 17.9 16.7 1.6 1.5 9.0 8.7 0.9 0.8 Jagran Prakashan Accumulate 135 154 4,399 1,824 1,981 22.9 24.2 7.7 9.1 17.5 14.9 3.2 2.8 19.0 20.2 2.4 2.2 Sun TV Network Hindustan Media Ventures Metals & Mining Neutral 407 - 16,027 2,548 2,879 68.6 68.9 22.8 25.8 17.8 15.8 4.6 4.0 27.1 26.7 5.8 5.0 Buy 238 292 1,746 820 920 20.0 20.0 17.8 19.2 13.4 12.4 2.4 2.0 17.9 16.4 1.6 1.4 Coal India Buy 361 421 227,926 73,842 81,735 11.8 12.9 27.1 31.2 13.3 11.6 4.5 3.7 33.9 32.1 2.2 1.8 Hind. Zinc Neutral 175 - 73,859 13,881 15,410 47.0 48.9 17.0 19.0 10.3 9.2 1.7 1.5 16.9 16.4 3.2 2.6 Hindalco Neutral 140 - 28,868 97,816 104,037 11.2 11.4 17.9 19.5 7.8 7.2 0.7 0.6 8.6 8.6 0.8 0.7 JSW Steel Buy 977 1,287 23,623 57,358 60,796 18.8 19.3 117.0 123.0 8.4 8.0 1.0 0.9 12.2 11.4 1.1 1.0 NMDC Neutral 142 - 56,259 14,551 16,453 67.4 67.7 19.2 21.1 7.4 6.7 1.7 1.4 21.9 20.8 2.5 2.4 SAIL Neutral 77 - 31,946 52,835 56,944 13.3 14.4 7.9 9.8 9.8 7.9 0.7 0.7 7.4 8.8 1.0 1.0 Sesa Sterlite Neutral 202 - 59,872 86,780 Tata Steel Buy 390 539 Cairn India Neutral 233 GAIL Neutral 424 ONGC Neutral 351 - Petronet LNG Neutral 180 - Reliance Industries Accumulate 915 1,034 Media 89,360 32.2 30.4 19.3 21.2 10.5 9.5 0.7 0.7 7.9 6.5 0.9 0.8 37,921 147,705 155,401 13.3 14.2 49.0 60.7 8.0 6.4 1.0 0.9 12.4 13.5 0.7 0.7 - 43,759 17,818 19,412 69.4 68.2 44.3 51.7 5.3 4.5 0.7 0.6 13.0 13.2 1.1 0.9 - 53,815 59,990 66,199 11.9 12.8 34.2 42.8 12.4 9.9 1.8 1.6 15.3 15.9 0.9 0.8 300,683 177,311 201,041 31.2 35.4 30.4 44.7 11.6 7.9 1.7 1.5 14.2 17.8 1.6 1.3 42,913 4.2 4.9 10.5 13.7 17.1 13.1 2.4 2.1 14.2 15.7 0.4 0.4 296,149 378,320 368,790 9.3 12.8 89.9 112.8 10.2 8.1 1.1 1.0 11.4 12.8 0.7 0.7 Oil & Gas www.angelbroking.com 13,485 40,481 Market Outlook February 02, 2015 Stock Watch Company Name Reco CMP Target Mkt Cap ( Č) Price ( Č) ( Č cr ) Sales ( Č cr ) FY15E OPM(%) EPS ( Č) PER(x) P/BV(x) RoE(%) EV/Sales(x) FY16E FY15E FY16E FY15E FY16E FY15E FY16E FY15E FY16E FY15E FY16E FY15E FY16E Pharmaceuticals Alembic Pharma Neutral 471 - 8,881 2,188 2,542 19.4 19.3 15.7 18.4 30.0 25.6 9.7 7.3 37.2 32.6 4.1 3.5 Aurobindo Pharma Neutral 1,248 - 36,419 11,707 14,054 19.9 19.9 48.0 56.3 26.0 22.2 7.2 5.5 31.8 28.2 3.6 3.0 Aventis* Accumulate 3,334 3,700 7,678 1,912 2,226 15.5 16.4 104.5 123.1 31.9 27.1 4.5 3.7 17.6 20.7 3.7 3.0 Cadila Healthcare Neutral 1,639 - 33,564 8,505 10,176 16.7 17.2 49.8 61.9 32.9 26.5 7.9 6.3 26.5 26.5 4.1 3.4 Cipla Neutral 696 - 55,887 11,509 14,383 18.8 21.7 20.9 29.6 33.3 23.5 4.8 4.1 15.6 18.8 4.8 3.8 Dr Reddy's Buy 3,237 3,935 55,129 15,867 18,657 23.8 24.9 155.2 196.7 20.9 16.5 4.8 3.8 25.8 26.0 3.5 2.9 Dishman Pharma Buy 153 215 1,237 1,511 1,662 23.0 23.0 16.7 21.7 9.2 7.1 1.0 0.8 10.8 12.7 1.2 0.9 GSK Pharma* Neutral 3,396 - 28,768 2,640 2,853 19.7 20.5 54.5 59.4 62.3 57.2 14.7 14.6 23.4 25.7 10.2 9.4 Indoco Remedies Neutral 322 - 2,965 856 1,112 18.2 18.2 10.4 14.2 30.9 22.7 5.5 4.5 19.2 21.8 3.6 2.8 Ipca labs Buy 638 817 8,054 3,503 4,213 18.6 20.9 36.2 48.1 17.6 13.3 3.4 2.8 21.2 23.3 2.5 2.1 Lupin Neutral 1,584 - 71,190 13,921 16,021 26.9 26.9 53.0 60.8 29.9 26.1 7.8 6.1 27.8 26.1 5.1 4.4 Ranbaxy* Neutral 704 - 29,952 12,024 13,827 13.2 10.0 18.3 13.9 38.5 50.6 7.7 6.7 21.6 14.0 3.2 2.8 Sun Pharma Neutral 916 - 189,703 18,929 38,386 44.0 31.5 31.2 34.9 29.4 26.2 7.8 5.3 28.5 27.9 9.4 5.4 Power Tata Power Neutral 91 - 24,477 37,654 38,320 25.0 25.2 5.9 6.5 15.3 13.9 1.7 1.6 11.0 11.6 1.4 1.3 NTPC Accumulate 144 161 118,570 74,675 80,198 24.9 26.1 10.9 12.7 13.2 11.3 1.3 1.2 9.7 10.6 2.2 2.0 Bharti Airtel Buy 373 429 149,003 95,793 103,292 33.6 34.2 12.8 16.4 29.1 22.7 2.3 2.1 8.2 9.3 2.2 1.9 Idea Cellular Buy 155 192 55,599 30,636 34,560 32.0 32.4 7.5 8.6 20.6 18.0 2.7 2.3 13.9 13.8 2.4 2.1 Telecom zOthers Abbott India* Neutral 3,978 - 8,452 2,365 2,781 14.8 15.2 117.7 142.7 33.8 27.9 8.5 6.7 28.0 27.0 3.3 2.8 Bajaj Electricals Neutral 233 - 2,345 4,677 5,458 6.2 6.4 14.4 19.0 16.2 12.2 2.8 2.4 17.4 19.4 0.5 0.4 Cravatex Accumulate 400 442 103 207 239 6.6 6.6 20.2 27.8 19.8 14.4 2.3 2.0 11.7 14.2 0.8 0.7 Finolex Cables Neutral 254 - 3,880 2,527 2,815 11.1 11.4 14.4 16.8 17.6 15.1 3.0 2.6 17.1 17.0 1.4 1.2 Goodyear India* Buy 607 830 1,401 1,785 1,943 10.5 10.7 53.1 59.3 11.4 10.3 2.3 2.0 22.1 20.7 0.5 0.4 Hitachi Neutral 1,122 - 3,051 1,345 1,550 8.0 8.9 20.1 25.7 55.9 43.7 10.5 8.6 20.6 21.6 2.3 2.0 Jyothy Laboratories Neutral 288 - 5,206 1,554 1,891 13.3 13.5 8.9 9.4 32.4 30.5 5.5 4.6 17.6 16.5 3.5 2.7 MRF Neutral 39,992 - 16,961 14,450 15,981 16.1 16.3 2,760.4 3,190.2 14.5 12.5 3.0 2.4 23.0 21.4 1.2 1.0 Page Industries Neutral 11,786 - 13,146 1,442 1,773 20.6 21.0 174.4 219.9 67.6 53.6 32.4 23.0 56.0 50.2 9.2 7.5 Relaxo Footwears Neutral 659 - 3,954 1,462 1,756 12.0 12.3 14.8 19.8 44.4 33.3 11.0 8.4 24.7 25.0 2.8 2.3 Siyaram Silk Mills Neutral 999 - 937 1,505 1,810 10.7 11.4 74.2 118.8 13.5 8.4 2.2 1.8 17.4 23.3 0.8 0.6 Styrolution ABS India* Neutral 704 - 1,239 1,172 1,288 7.0 7.0 29.7 33.3 23.7 21.2 2.4 2.2 10.5 10.7 1.1 1.0 www.angelbroking.com Market Outlook February 02, 2015 Stock Watch Company Name Reco CMP Target Mkt Cap ( Č) Price ( Č) ( Č cr ) Sales ( Č cr ) FY15E OPM(%) EPS ( Č) FY16E FY15E FY16E FY15E PER(x) P/BV(x) RoE(%) EV/Sales(x) FY16E FY15E FY16E FY15E FY16E FY15E FY16E FY15E FY16E zOthers Tree House Neutral 465 - 1,967 206 246 54.7 54.7 15.9 19.2 29.2 24.2 4.1 3.6 14.1 15.1 9.2 7.6 TVS Srichakra Neutral 1,671 - 1,280 1,923 2,167 9.3 9.4 114.0 137.1 14.7 12.2 4.6 3.5 31.5 28.7 0.8 0.7 Vesuvius India* Neutral 714 - 1,450 688 758 17.8 18.0 35.4 39.8 20.2 18.0 3.2 2.8 16.8 16.4 1.9 1.7 HSIL Buy Kirloskar Engines India Buy Ltd M M Forgings Neutral 399 568 2,635 2,035 2,349 19.5 20.8 21.2 30.4 18.9 13.1 2.1 1.9 11.3 14.3 1.6 1.4 269 319 3,891 2,549 2,890 10.7 11.6 12.2 15.8 22.1 17.1 2.9 2.6 13.4 16.0 1.3 1.1 572 - 691 493 581 22.5 22.9 44.2 55.0 13.0 10.4 2.8 2.3 24.2 24.0 1.7 1.4 ITD Cementation India Neutral 493 - 765 1,386 1,636 11.1 11.3 9.4 28.2 52.7 17.5 1.4 1.3 2.6 7.3 1.0 0.9 Banco Products (India) Buy 139 182 993 1,313 1,536 13.3 13.7 14.3 18.2 9.7 7.6 1.6 1.3 16.8 19.0 0.8 0.7 Competent Automobiles Buy 92 115 56 872 977 2.6 3.0 16.6 23.1 5.5 4.0 0.6 0.5 11.3 13.7 0.1 0.1 121 174 193 968 1,177 8.4 8.7 10.5 24.8 11.6 4.9 0.6 0.5 4.8 10.5 0.4 0.3 Visaka Industries Buy Source: Company, Angel Research; Note: *December year end; #September year end; &October year end; Price as on January 30, 2015 www.angelbroking.com Market Outlook February 02, 2015 Research Team Tel: 022 - 39357800 E-mail: [email protected] Website: www.angelbroking.com DISCLAIMER This document is solely for the personal information of the recipient, and must not be singularly used as the basis of any investment decision. Nothing in this document should be construed as investment or financial advice. Each recipient of this document should make such investigations as they deem necessary to arrive at an independent evaluation of an investment in the securities of the companies referred to in this document (including the merits and risks involved), and should consult their own advisors to determine the merits and risks of such an investment. Angel Broking Pvt. Limited, its affiliates, directors, its proprietary trading and investment businesses may, from time to time, make investment decisions that are inconsistent with or contradictory to the recommendations expressed herein. The views contained in this document are those of the analyst, and the company may or may not subscribe to all the views expressed within. Reports based on technical and derivative analysis center on studying charts of a stock's price movement, outstanding positions and trading volume, as opposed to focusing on a company's fundamentals and, as such, may not match with a report on a company's fundamentals. The information in this document has been printed on the basis of publicly available information, internal data and other reliable sources believed to be true, but we do not represent that it is accurate or complete and it should not be relied on as such, as this document is for general guidance only. Angel Broking Pvt. Limited or any of its affiliates/ group companies shall not be in any way responsible for any loss or damage that may arise to any person from any inadvertent error in the information contained in this report. Angel Broking Pvt. Limited has not independently verified all the information contained within this document. Accordingly, we cannot testify, nor make any representation or warranty, express or implied, to the accuracy, contents or data contained within this document. While Angel Broking Pvt. Limited endeavours to update on a reasonable basis the information discussed in this material, there may be regulatory, compliance, or other reasons that prevent us from doing so. This document is being supplied to you solely for your information, and its contents, information or data may not be reproduced, redistributed or passed on, directly or indirectly. Angel Broking Pvt. Limited and its affiliates may seek to provide or have engaged in providing corporate finance, investment banking or other advisory services in a merger or specific transaction to the companies referred to in this report, as on the date of this report or in the past. Neither Angel Broking Pvt. Limited, nor its directors, employees or affiliates shall be liable for any loss or damage that may arise from or in connection with the use of this information. Note: Please refer to the important `Stock Holding Disclosure' report on the Angel website (Research Section). Also, please refer to the latest update on respective stocks for the disclosure status in respect of those stocks. Angel Broking Pvt. Limited and its affiliates may have investment positions in the stocks recommended in this report. www.angelbroking.com

© Copyright 2026