
A-REIT - Google Sites
Asia Pacific Equity Research 31 January 2015 SREITs Results Wrap Yield volatility takes precedence REITs’ results were mostly in line, with office and industrial showing promising signs. Headwinds in retail and hospitality persist. Monetary Authority of Singapore’s (MAS) unexpected easing and bond yield volatility suggest REITs will continue to trade sideways in 2015. Sector yield/yield spread of 5.4%/3.5% seems fair vs. a mean of 5.9%/4.0%. Our top OWs are AREIT, SUN, CRCT and ART. Forex concerns compound interest rate volatility. Bond yields could remain volatile, in the face of the improving US economy and uncertain growth in EU/China. The Treasury curve's continued flattening implies that lower oil prices and a stronger USD will reduce how much the Fed could tighten over time. While our Fixed Income Team has lowered their 10-year US bond yield forecasts by ~40 bps, we have maintained our risk-free rate assumption for REITs’ valuation at a conservative 3%. Further, MAS’ unexpected easing will lead to a weaker SGD currency and rise in interest rates, which are both negative for REITs. REITs results in line, as DPUs of 9 (out of 11) REITs we covered were within our estimates, driven by acquisitions and positive rent reversions. While we saw interest savings from refinancing of loans issued 3-5 years ago at higher cost, impact is mitigated by longer debt tenures. Office rent growth is healthy, as office REITs posted strong positive rent reversions in 2014 amid high retention rates. Limited supply in 2015-2H16 should see Grade A rent growth of 5% in 2015. Industrial occupancies improved, underpinned by business parks and hi-tech space. Rent reversions were better than expected. Acquisition outlook is mixed, with smaller deals and sponsor pipeline more likely. Singapore REITs Brandon Lee AC (65) 6882-7073 [email protected] J.P. Morgan Securities Singapore Private Limited Cusson Leung (852) 2800-8526 [email protected] J.P. Morgan Securities (Asia Pacific) Limited Terence M Khi (65) 6882-1518 [email protected] J.P. Morgan Securities Singapore Private Limited FSTREI vs FSTREH vs FSSTI FSSTI (LHS) / FSTREI, FSTREH (RHS) 3,500 900 3,400 850 800 3,300 750 3,200 700 3,100 650 3,000 Dec-12 FSSTI 600 Dec-13 FSTREI Dec-14 FSTREH Source: Bloomberg. Retail occupancy cost on the rise, implying landlords need to cut rents given tenant sales decline across suburban and urban malls. Rent reversion will slow as more retailers consolidate in a challenging climate. Hotel RevPAR continued to fall, with mid-tier segment seeing greater declines. A doubling in supply and lesser China/Indo tourists imply sustained downside pressures on room rates and occupancies in 2015. Strategy and stock picks. We expect REITs to trade sideways in 2015, given the volatile bond yield movements. Sector yield/yield spread of 5.4%/3.5% seems fair vs. mean of 5.9%/4.0%. We prefer REITs with strong sponsor pipelines, good sub-sector fundamentals and/or undemanding P/B ratios. Our top OWs are AREIT, SUN, CRCT and ART. UWs include CDREIT, FEHT, MCT and FCT. See page 51 for analyst certification and important disclosures, including non-US analyst disclosures. J.P. Morgan does and seeks to do business with companies covered in its research reports. As a result, investors should be aware that the firm may have a conflict of interest that could affect the objectivity of this report. Investors should consider this report as only a single factor in making their investment decision. www.jpmorganmarkets.com Brandon Lee (65) 6882-7073 [email protected] Asia Pacific Equity Research 31 January 2015 Equity Ratings and Price Targets Company A-REIT Ascott Residence Trust CapitaCommercial Trust CapitaMall Trust CapitaRetail China Trust CDL Hospitality Trusts Far East Hospitality Trust Frasers Centrepoint Trust Keppel REIT Mapletree Commercial Trust Mapletree Industrial Trust Suntec REIT Ticker AREIT SP ART SP CCT SP CT SP CRCT SP CDREIT SP FEHT SP FCT SP KREIT SP MCT SP MINT SP SUN SP Mkt Cap (S$ mn) 5,918.04 1,941.80 5,212.38 7,235.96 1,420.22 1,765.18 1,499.57 1,895.66 3,915.49 3,187.23 2,650.42 4,704.22 Source: Company data, Bloomberg, J.P. Morgan estimates. n/c = no change. All prices as of 30 Jan 15. 2 Rating Price (S$) 2.46 1.27 1.77 2.09 1.72 1.80 0.85 2.07 1.24 1.52 1.53 1.88 Cur OW OW N N OW UW UW UW N UW N OW Prev n/c n/c n/c n/c n/c n/c n/c n/c n/c n/c n/c n/c Price Target Cur Prev 2.55 n/c 1.40 n/c 1.75 n/c 2.15 n/c 1.80 n/c 1.70 n/c 0.80 n/c 1.85 n/c 1.25 n/c 1.40 n/c 1.55 n/c 2.10 n/c Brandon Lee (65) 6882-7073 [email protected] Asia Pacific Equity Research 31 January 2015 Table of Contents Interest rate still the swing factor ...........................................4 Office: Strong rental reversions............................................11 Retail: Occupancy cost concerns surface ...........................13 Industrial: Spillover from higher office rents .......................15 Hospitality: Supply concerns still weighing.........................17 Appendix .................................................................................19 A-REIT .....................................................................................27 Ascott Residence Trust .........................................................29 CapitaCommercial Trust ........................................................31 CapitaMall Trust......................................................................33 CapitaRetail China Trust........................................................35 CDL Hospitality Trusts...........................................................37 Far East Hospitality Trust ......................................................39 Frasers Centrepoint Trust .....................................................41 Keppel REIT ............................................................................43 Mapletree Commercial Trust .................................................45 Mapletree Industrial Trust......................................................47 Suntec REIT ............................................................................49 3 Brandon Lee (65) 6882-7073 [email protected] Asia Pacific Equity Research 31 January 2015 Interest rate still the swing factor Treasury volatilities weigh on yield-driven REITs Ten-year SG bond yield has fallen 37 bps to 1.91% YTD, slightly lower than the 45 bps decline in 10-year US bond yield to 1.72%. The unexpected yield compression started with the sharp decline in oil prices, which gave rise to concerns over inflation. Weakening growth resulted in the ECB announcing its €1.1tn QE plan, which was on a larger scale and longer-time horizon than what our Fixed Income Team had expected. Elsewhere, both Bank of Canada and Reserve Bank of India also surprised markets with interest rate cuts of 25 bps to address sluggish growth. While these global developments were pivotal in driving bond yields lower, recent data in the US have not helped, i.e., weakness in Dec-14 average hourly earnings, core CPI and retail sales. In the latest FOMC statement on 28-Jan-15, the Fed reiterated that it will be “patient” before raising interest rates and delivered a rather mixed message on the factors determining liftoff. Its improved upbeatness on the domestic economy was hawkish. A dovish stance was presented when the Fed noted that "international developments" will be a factor in deciding the first rate hike, given global economic risks and pace of USD appreciation. The continued flattening of the Treasury curve suggests that lower oil prices and a stronger USD will reduce how much the Fed will need to tighten over time. Given that the influence of lower inflation expectations is unlikely to reverse in the near term, our Fixed Income Team made material revisions to their interest rate forecasts. The 10-year US bond yield should reach 2.25% (vs. 2.70% previously) by 2Q15E and rise 15 bps to 2.40% (vs. 2.80% previously) by 4Q15E. While US Treasuries have historically served as an upper bound for Singapore bonds, this has gone the opposite direction over the past year or so, with the 10-year SG bond yield trading at 5-40 bps over the 10-year US bond yield. 4 Brandon Lee (65) 6882-7073 [email protected] Asia Pacific Equity Research 31 January 2015 Figure 1: 10-yr SG bond yield vs. 10-yr US bond yield % Figure 2: Spread between 10-yr SG bond yield and 10-yr US bond yield bps 6.0% 50 5.0% 0 4.0% (50) 3.0% (100) 2.0% (150) 1.0% (200) 0.0% (250) 10-Year Bond Singapore 10-Year Bond US Spread SG-US bond yield Source: Bloomberg. Source: Bloomberg. Table 1: JPM 10-yr US bond yield (old vs. new) % Mar-15 Jun-15 Sep-15 Dec-15 Old* 2.55% 2.70% 2.75% 2.80% US 10-yr bond yield estimates New 2.10% 2.25% 2.30% 2.40% Change -0.45% -0.45% -0.45% -0.40% Source: J.P. Morgan estimates.*Old estimates as of 12-Dec-2014. Maintaining a conservative stance on risk-free rate Our Dec-15 PTs are based on the average of our DDM and RNAV valuation estimates. Our DDM is predicated on our three-year DPU estimates, discount rate assumption and forecasted long-term growth rate (LTGR). Our present discount rate assumptions factor in a riskfree rate of 3%. As both cap rates and rent growth have not deviated from our current forecasts, we maintain our RNAVs. The table below illustrates our discount rate assumptions for the 12 REITs under our coverage. 5 Asia Pacific Equity Research 31 January 2015 Brandon Lee (65) 6882-7073 [email protected] Table 2: SREITs valuation assumptions Specified A-REIT Ascott Residence Trust CapitaCommercial Trust CapitaMall Trust CapitaRetail China Trust CDL Hospitality Trust Far East Hospitality Trust Frasers Centrepoint Trust Keppel REIT Mapletree Commercial Trust Mapletree Industrial Trust Suntec REIT Total / weighted average Share price 30-Jan-15 (S$) 2.47 1.27 1.80 2.14 1.73 1.80 0.84 2.01 1.25 1.54 1.53 1.91 Current Mkt cap (S$ MM) 5,942 1,949 5,286 7,409 1,433 1,765 1,491 1,841 3,963 3,229 2,642 4,775 41,726 Beta 0.92 1.14 0.92 0.76 1.36 1.24 1.36 1.00 1.00 0.82 1.10 0.80 0.95 Discount rate (%) 7.6% 8.7% 7.6% 6.8% 9.8% 9.2% 9.8% 8.0% 8.0% 7.1% 8.5% 7.0% 7.7% LT growth rate (%) 1.0% 2.0% 2.0% 1.0% 3.0% 1.5% 1.5% 1.5% 2.0% 1.5% 1.0% 2.0% 1.6% Terminal cap rate (%) 6.6% 6.7% 5.6% 5.8% 6.8% 7.7% 8.3% 6.5% 6.0% 5.6% 7.5% 5.0% 6.2% Implied LT growth rate (%) 1.3% 2.2% 2.9% 1.5% 3.1% 3.2% 4.0% 2.7% 2.9% 2.1% 1.4% 1.7% 2.1% NPV Current (S$) 2.40 1.23 1.55 1.99 1.72 1.48 0.62 1.71 1.09 1.39 1.46 2.00 Disc./Prem to NPV Current (%) 3.0% 3.1% 16.0% 7.7% 0.9% 21.8% 34.4% 17.6% 15.2% 10.6% 4.5% -4.9% 8.9% Source: Bloomberg, J.P. Morgan estimates. While the unexpected compression in bond yields did make us consider tweaking our risk-free rate, we decided to remain conservative and stick with our existing assumptions. Assuming the highest end of the premium spread, the revised 10-year SG bond yield of 2.80% is not too far from our current assumptions. Given the uncertain global macroeconomic outlook and interest rate volatility, we are mindful of unexpected changes in 10-year bond yields. Our sensitivity analysis shows that for every 20 bps rise in risk-free rate, our PTs would decrease by 1.7%. Table 3: Sensitivity analysis of PTs to risk-free rates S$ AREIT ART CCT CT CRCT CDREIT FEHT FCT KREIT MCT MINT SUN TP $2.55 $1.40 $1.75 $2.15 $1.80 $1.70 $0.80 $1.85 $1.25 $1.40 $1.55 $2.10 2.6% 2.60 1.40 1.80 2.20 1.85 1.75 0.80 1.90 1.30 1.45 1.55 2.20 Sensitivity analysis of PTs to risk-free rate* 2.8% 3.0% 3.2% 2.55 2.55 2.50 1.40 1.40 1.35 1.75 1.75 1.70 2.20 2.15 2.10 1.85 1.80 1.80 1.70 1.70 1.70 0.80 0.80 0.80 1.90 1.85 1.85 1.25 1.25 1.25 1.45 1.40 1.40 1.55 1.55 1.50 2.15 2.10 2.05 Source: J.P. Morgan estimates. *Refers to 10-yr Singapore bond yield. 6 3.4% 2.45 1.35 1.70 2.10 1.75 1.65 0.80 1.80 1.20 1.35 1.50 2.00 Asia Pacific Equity Research 31 January 2015 Brandon Lee (65) 6882-7073 [email protected] Table 4: Sensitivity analysis of PTs to risk-free rates % TP $2.55 $1.40 $1.75 $2.15 $1.80 $1.70 $0.80 $1.85 $1.25 $1.40 $1.55 $2.10 AREIT ART CCT CT CRCT CDREIT FEHT FCT KREIT MCT MINT SUN Wght Avg 2.6% 2.0% 0.0% 2.9% 2.3% 2.8% 2.9% 0.0% 2.7% 4.0% 3.6% 0.0% 4.8% 2.6% Sensitivity analysis of PTs to risk-free rate* 2.8% 3.0% 3.2% 0.0% 0.0% -2.0% 0.0% 0.0% -3.6% 0.0% 0.0% -2.9% 2.3% 0.0% -2.3% 2.8% 0.0% 0.0% 0.0% 0.0% 0.0% 0.0% 0.0% 0.0% 2.7% 0.0% 0.0% 0.0% 0.0% 0.0% 3.6% 0.0% 0.0% 0.0% 0.0% -3.2% 2.4% 0.0% -2.4% 1.2% 0.0% -1.7% 3.4% -3.9% -3.6% -2.9% -2.3% -2.8% -2.9% 0.0% -2.7% -4.0% -3.6% -3.2% -4.8% -3.2% Source: J.P. Morgan estimates. *Refers to 10-yr Singapore bond yield. MAS easing policy to hit REITs on double fronts Citing moderating inflationary pressures, the Monetary Authority of Singapore's (MAS) unexpectedly adjusted its prevailing monetary policy stance on 28-Jan-15 by reducing the slope of the S$NEER policy band. The immediate impact is a weakening in SGD (against USD), which has a strong positive co-relationship (86%) with REITs. In fact, the SGD has already weakened by a respective 3.3% and 4.7% in 2013 and 2014, respectively. Subsequent to the MAS easing, SGD weakened by a further 2% to 1.35. Our FX Team is forecasting USDSGD of 1.36 by end of Dec-15, representing a YoY decline of 2.6%. Figure 3: FSTREI vs. USD:SGD Figure 4: JPM forecasted USD:SGD Index (LHS) / S$ (RHS) S$ 1,200 1,000 800 600 400 FSTREI Index Source: Bloomberg. Jul-14 Jul-13 Jul-12 Jul-11 Jul-10 Jul-09 Jul-08 Jul-07 Jul-06 Jul-05 Jul-04 Jul-03 0 Jul-02 200 1.800 1.700 1.600 1.500 1.400 1.300 1.200 1.100 1.000 1.37 1.36 1.36 1.36 1.35 1.35 1.34 1.35 1.35 Jun-15 Sep-15 1.34 1.34 1.33 Mar-15 USDSGD Dec-15 USD:SGD Source: J.P. Morgan estimates. We believe this will be a negative for REITs, evidenced by the difference in returns an investor could make by factoring in any potential SGD appreciation. For example in 2012, REITs’ total return in SGD was 46.2%, but a relatively higher 55.1% after factoring in the SGD appreciation. 7 Asia Pacific Equity Research 31 January 2015 Brandon Lee (65) 6882-7073 [email protected] Figure 5: REITs’ (FSTREI Index) total return in SGD vs. USD % 100.0% 80.0% 60.0% 40.0% 20.0% 0.0% -20.0% -40.0% -60.0% -80.0% 87.3% 91.5% 17.7% 46.2% 28.8% 55.1% 16.4% 10.9% 3.9% 1.5% -3.8% -6.9% -10.7% -11.6% -55.9% -55.8% 2008 2009 2010 2011 SGD 2012 2013 2014 YTD USD Source: J.P. Morgan estimates, Bloomberg. Secondly, because of Singapore's exchange rate-based monetary policy and the uncovered interest rate parity theory, the weakening SGD would result in upward pressure on interest rates, including SIBOR and SOR. The former is the floating rate pegged to residential mortgage loans while the latter is the floating rate pegged to corporates' (including REITs’) loans. Based on Bloomberg consensus, SIBOR is expected to rise to 0.85% by end-15 from 0.67% currently while yields on 10Y SGS are also expected to increase to 2.58% from their current 1.83%. While SIBOR has been trading below SOR, SOR should trade down to the same level as SIBOR, given that the SGD depreciation theme is already well priced-in by the market and MAS also expects the forex volatility to ease in a few days. Table 5: Consensus forecast for 3M-SIBOR and 10Y SGS % 30-Jan Mar-15 Jun-15 Sep-15 Dec-15 3M SIBOR 0.67% 0.66% 0.66% 0.76% 0.85% 10Y SGS 1.83% 2.24% 2.34% 2.46% 2.58% Source: Bloomberg. (Weighted Average Forecast as of 30 Jan 15). Aside from medium-term notes and convertible bonds which are generally on fixed rates, REITs’ other loan facilities are structured as floating plus an interest spread margin. We understand a majority of REITs utilize SOR as their floating rates, which suggests any spike in SOR will affect DPUs. Nonetheless, REIT managers have been prudent in their capital management, by entering into interest rate swaps to have majority of their loans on fixed rates. According to our 8 Brandon Lee (65) 6882-7073 [email protected] Asia Pacific Equity Research 31 January 2015 estimates, ~75% of REITs' loans are on fixed rates, which mean that for every 100 bps rise in interest rate, DPU falls by 2.7%. Table 6: Sensitivity analysis of DPUs to interest rates % FY2014E/15E AREIT ART CCT CT CRCT CDREIT FEHT FCT KREIT MCT MINT SUN Wght Avg DPUs from 100 bps rise in debt cost FY2015E/16E -2.7% -2.5% -2.9% -3.5% -1.0% -0.9% -3.5% -3.4% -1.8% -1.5% -3.5% -3.4% -3.2% -3.4% -1.5% -1.4% -3.5% -3.2% -2.8% -2.7% -1.9% -2.0% -4.8% -4.2% -2.9% -2.7% FY2016E/17E -2.5% -3.4% -0.9% -3.2% -1.5% -3.3% -3.2% -1.4% -3.2% -2.6% -2.1% -4.1% -2.7% Source: J.P. Morgan estimates. Additionally, the DPU change could affect our PTs, which are derived from the average of our DDM and RNAV valuations. Based on our estimates, our DDM valuations would drop by 1.2% for every 50 bps rise in interest rates. Table 7: Sensitivity analysis of DDM to interest rates % AREIT ART CCT CT CRCT CDREIT FEHT FCT KREIT MCT MINT SUN Wght Avg -1.50% -3.9% -0.6% -1.0% -3.4% -1.8% -4.6% -4.7% -1.0% -6.0% -3.5% -1.8% -7.1% -3.5% -1.00% -2.6% -0.4% -0.7% -2.2% -1.2% -3.1% -3.2% -0.7% -4.0% -2.3% -1.2% -4.7% -2.4% Sensitivity analysis of DDM to interest rate -0.50% 0.00% 0.50% -1.3% 0.0% 1.3% -0.2% 0.0% 0.2% -0.3% 0.0% 0.3% -1.1% 0.0% 1.1% -0.6% 0.0% 0.6% -1.5% 0.0% 1.5% -1.6% 0.0% 1.6% -0.3% 0.0% 0.3% -2.0% 0.0% 2.0% -1.2% 0.0% 1.2% -0.6% 0.0% 0.6% -2.4% 0.0% 2.4% -1.2% 0.0% 1.2% 1.00% 2.6% 0.4% 0.7% 2.2% 1.2% 3.1% 3.2% 0.7% 4.0% 2.3% 1.2% 4.7% 2.4% 1.50% 3.9% 0.6% 1.0% 3.4% 1.8% 4.6% 4.7% 1.0% 6.0% 3.5% 1.8% 7.1% 3.5% Source: J.P. Morgan estimates. We also illustrate the impact of interest rates on book values, via a sensitivity analysis of RNAVs to changes in cap rates, which have a positive co-relationship with rates. For every 50 bps change in cap rates, our RNAVs would vary by ~10%. 9 Brandon Lee (65) 6882-7073 [email protected] Asia Pacific Equity Research 31 January 2015 Table 8: Sensitivity analysis of RNAVs to cap rates % AREIT ART CCT CT CRCT CDREIT FEHT FCT KREIT MCT MINT SUN Wght Avg -0.75% 17.8% 27.9% 20.0% 16.0% 20.8% -15.3% 23.1% 22.1% 36.9% 17.0% 18.8% 7.8% 18.0% Source: J.P. Morgan estimates. 10 -0.50% 11.4% 17.6% 12.3% 10.1% 13.2% -10.2% 14.6% 14.0% 22.8% 10.7% 12.0% 4.9% 11.3% Sensitivity analysis of RNAVs to cap rates -0.25% 0.00% 0.25% 5.5% 0.0% -5.1% 8.4% 0.0% -7.6% 5.7% 0.0% -5.0% 4.8% 0.0% -4.4% 6.3% 0.0% -5.8% -5.1% 0.0% 5.1% 6.9% 0.0% -6.3% 6.6% 0.0% -6.1% 10.6% 0.0% -9.3% 5.1% 0.0% -4.6% 5.8% 0.0% -5.4% 2.3% 0.0% -2.1% 5.3% 0.0% -4.8% 0.50% -9.8% -14.5% -9.5% -8.4% -11.1% 10.2% -12.0% -11.6% -17.5% -8.8% -10.4% -4.0% -9.1% 0.75% -14.1% -20.8% -13.5% -12.1% -16.1% 15.3% -17.2% -16.7% -24.9% -12.7% -15.0% -5.8% -13.1% Asia Pacific Equity Research 31 January 2015 Brandon Lee (65) 6882-7073 [email protected] Office: Strong rental reversions Results takeaways: strong rent reversion persists Aside from KREIT whose results missed our forecasts by 5% (due to higher interest cost and lower income support), CCT and SUN were both in line with our estimates. Healthy occupancies, resilient tenant retention rates (CCT: 86% and KREIT: 85%) and strong positive rental reversions reflected the limited supply through 1H16. KREIT and OUECT posted FY14 positive rent reversions of 17% and 15%, respectively while Suntec City Office's secured leases in 4Q14 were up 3% YoY to S$8.92 psf/mth. CCT's portfolio passing rent was up 6% YoY to S$8.61 psf, with expired spaces secured at improved rates in Six Battery Road (renewed: S$11.40-14.20 psf vs. expired: S$11.23 psf) and One George Street (renewed: S$10.20-11.90 psf vs. expired: S$10.00 psf). Cap rate movements were mixed, but upward revisions YoY were more than offset by improved rentals. Grade A buildings were generally valued at 3.75%. Table 9: Historical office occupancy % CCT SUN KREIT OUECT 31-Mar-13 95.3% 99.7% - 30-Jun-13 95.8% 99.7% 99.2% - 30-Sep-13 97.6% 99.8% 99.5% - 31-Dec-13 98.7% 99.6% 100.0% - 31-Mar-14 99.4% 99.4% 100.0% 100.0% 30-Jun-14 99.4% 99.7% 99.8% 100.0% 30-Sep-14 99.4% 100.0% 99.8% 100.0% 31-Dec-14 96.8% 100.0% 99.5% 100.0% Source: Company data. Table 10: Historical cap rate % CCT SUN KREIT OUECT 31-Dec-08 4.50% 4.93% NA NA 31-Dec-09 4.25% 4.75% NA NA 31-Dec-10 4.09% 4.61% NA NA 31-Dec-11 4.00% 4.54% NA NA 31-Dec-12 3.75% 4.33% NA NA 31-Dec-13 3.75% 4.46% 4.00% 3.50% 31-Dec-14 3.82% 4.32% 3.75% 3.75% Source: Company data. Outlook: landlords still enjoy limited supply story With CapitaGreen now 69.4% pre-committed and South Beach Tower expected to hit 90%, the amount of new vacant Grade A office space equates to 0.3m sqf over the next 18 months, vs. average net absorption of 0.9m sqf. However, a majority of demand continues to be underpinned by relocation (due to competitive rents) than expansion. While the new pool of diversified tenants (commodities, energy, legal and IT) has helped to offset the drop in demand from traditional large occupiers in the finance sector (which continues to downsize with the 11 Brandon Lee (65) 6882-7073 [email protected] Asia Pacific Equity Research 31 January 2015 latest being Standard Chartered Bank and RBS), the size which they require remains comparatively smaller at the 2,000-10,000 sqf level. Coupled with the estimated 0.5m sqf of secondary space, we expect Grade A rents to grow by a slower 5% in 2015 (vs. 15% in 2014). 12 Asia Pacific Equity Research 31 January 2015 Brandon Lee (65) 6882-7073 [email protected] Retail: Occupancy cost concerns surface Results takeaways: operating stats paint a tepid picture Results of all domestic retail REITs under our coverage (CT, MCT and FCT) were all within our projections, largely driven by acquisitions. On the flipside, major operating statistics continue to weaken across both suburban and urban malls. MCT's VivoCity and SGREIT's Wisma Atria posted a respective 2.8% YoY and 5.6% drop in Dec-14 quarter tenant sales, despite the traditionally busier 4Q14 holiday period. CT also recorded FY14 tenant sales decline of 1.9%. While the positive rent reversion trend remains, the pace has moderated. FCT’s +7.7% was a tad lower than the preceding quarter’s +10.9%, while CT’s +6.1% in FY14 is slightly below FY13’s +6.3%. Similarly for MCT, 9MFY15 rent reversion slowed to +15.1% from +37.6% in FY14. Occupancies generally improved QoQ, except FCT which saw 2.5%pts decline due to tenant remixing. Table 11: Retail occupancy % CT MCT FCT SGREIT* CRCT 31-Mar-13 98.3% 97.7% 98.2% 100.0% 96.5% 30-Jun-13 99.1% 98.3% 98.4% 99.5% 96.5% 30-Sep-13 99.5% 98.9% 98.4% 100.0% 98.3% 31-Dec-13 98.5% 98.7% 96.7% 99.9% 98.2% 31-Mar-14 98.8% 98.2% 96.8% 99.3% 98.4% 30-Jun-14 98.6% 99.0% 98.5% 99.5% 98.1% 30-Sep-14 98.5% 98.5% 98.9% 99.8% 97.6% 31-Dec-14 98.8% 99.5% 96.4% 100.0% 95.9% 31-Mar-13 6.2% 33.1% 10.2% NA 14.9% 30-Jun-13 6.4% 42.8% 9.4% NA 17.3% 30-Sep-13 6.3% 37.1% 10.8% NA 10.0% 31-Dec-13 6.3% 38.7% 2.5% NA 17.5% 31-Mar-14 6.2% 37.6% 9.3% 8.9% 23.0% 30-Jun-14 6.6% 16.2% 7.8% 12.3% 24.9% 30-Sep-14 6.3% 16.5% 10.9% 6.7% 22.6% 31-Dec-14 6.1% 15.1% 7.7% 17.0% 20.6% 30-Jun-13 3.3% NA 5.5% -30.2% 9.5% 30-Sep-13 2.8% NA 5.7% 9.4% 5.6% 31-Dec-13 2.5% NA 7.7% -8.2% 10.5% 31-Mar-14 -4.0% NA 2.4% -3.3% 14.3% 30-Jun-14 -3.7% NA 4.9% -0.4% 13.6% 30-Sep-14 -3.0% 0.6% 0.2% -7.5% 16.1% 31-Dec-14 -1.9% NA -2.8% -5.6% 21.3% Source: Company data. *Singapore retail only. Table 12: Retail rent reversions % CT1 MCT1 FCT SGREIT* CRCT Source: Company data. *Singapore retail only. 1Cumulative Table 13: Tenant sales growth (YoY) % CT MCT FCT SGREIT CRCT 31-Mar-13 2.4% NA 5.4% 11.3% Source: J.P. Morgan, Company data. Retail sentiments where CRCT operates continue to remain healthy, as tenant sales rose across all trade sectors, with 4Q14 YoY growth of 13 Brandon Lee (65) 6882-7073 [email protected] Asia Pacific Equity Research 31 January 2015 21% exceeding the preceding quarter’s +16%, which translates to a full-year increase of 16% (vs. +9% in FY13). Rent reversion for the quarter continued to be strong at +20.6%, led by CapitaMall Wangjing (+35.3%) and CapitaMall Saihan (+16.7%). Outlook: Occupancy cost is a worry A combination of tenant sales decline and rental increases (albeit at a slower pace) has naturally led to a rise in occupancy cost, which is best evidenced by CT’s 1.8%pts YoY rise to 17.6% and representing a record high. In fact, earlier signs have already emerged as MCT's occupancy cost crept upwards from 15.9% in FY12 to 17.0% in FY14. With islandwide sales turnover on a downward trend and more retailers consolidating their stores, we expect landlords to start adjusting downwards their rent expectations. Based on our estimates, Suntec City Mall Phase 3 revised its expected rent for part of the precommitted space. According to JLL, suburban rent fell 0.5% YoY in 2014, the first decline since 2009. However, prime rent rose 0.8%. Going forward, we expect existing headwinds in the retail sector to worsen, namely lower rents and tenant sales, as well as more consolidation among retailers. 14 Brandon Lee (65) 6882-7073 [email protected] Asia Pacific Equity Research 31 January 2015 Industrial: Spillover from higher office rents Results takeaways: Improved occupancies MINT’s results were in line with our projections, although AREIT slightly missed due to higher operating expenses and property taxes. AREIT (+1.2%pts QoQ) recorded a turnaround in portfolio occupancy after six quarters of decline, while occupancy for MLT declined (-0.3%pts) on single-user asset (SUA) to multi-tenanted (MTB) conversions. Occupancy at MINT (-0.7%pts) was impacted by redevelopment of its Telok Blangah Cluster. Both AREIT (+1.5%pts to 88%) and MINT (+2 pts to 81%) saw a pickup in business park occupancy, due to additional take-up at Aperia and The Signature. Table 14: Industrial occupancy % AREIT MINT MLT CACHE 31-Mar-13 94.0% 95.4% 98.5% 100.0% 30-Jun-13 93.6% 95.5% 98.2% 100.0% 30-Sep-13 90.1% 93.9% 98.7% 100.0% 31-Dec-13 89.7% 92.5% 98.4% 100.0% 31-Mar-14 89.6% 91.3% 98.3% 100.0% 30-Jun-14 88.1% 90.7% 97.6% 99.6% 30-Sep-14 85.6% 91.5% 97.2% 99.5% 31-Dec-14 86.8% 90.8% 96.9% 97.9% 31-Mar-13 14.5% NA 14.0% 30-Jun-13 9.6% NA 17.0% 30-Sep-13 10.8% 26.5% 24.0% 31-Dec-13 9.7% 23.6% 23.0% 31-Mar-14 NA 17.7% 17.0% 30-Jun-14 11.8% 17.1% 12.0% 30-Sep-14 6.3% 5.3% 9.0% 31-Dec-14 7.7% 5.8% 9.0% Source: Company data. Table 15: Industrial rent reversions % AREIT MINT MLT Source: Company data. Outlook: Mixed acquisition and rent growth outlook Vacancies are expected to rise on more SUA-MTB conversions, namely MLT (over half of 16 SUAs expiring in FY16 to convert to MTBs), CACHE (MTB conversions for three properties). AREIT also anticipates at least three of 16 buildings to convert in the next two years, though its SUA space due for renewal is substantially down (3QFY15: 9.6% of NPI over three years vs. 15.6% in 3QFY14). Acquisition and development outlook remain mixed, with MLT looking to reduce exposure to Sale and Leaseback transactions, especially for tenants seeking to recycle capital. Larger REITs may also slow development (BTS) activities as competitive 7% yield-oncost is deemed unattractive. Larger REITs (e.g., AREIT and MLT) are still looking to tap sponsor pipelines and overseas assets for acquisitions. Despite competition, smaller REITs (e.g., SSREIT, CREIT and VIT) are able to acquire third-party assets locally due to smaller transaction sizes, with CREIT and AAREIT slowing overseas expansion plans due to currency volatility and falling cap rates. 15 Brandon Lee (65) 6882-7073 [email protected] Asia Pacific Equity Research 31 January 2015 We expect business park rents to rise 2-3% in 2015 even with overall occupancy at 80% on spillover demand from rising office rent and strong pre-commitment (70-95%) of recent completions, i.e., Fusionopolis Phase 2 and Galaxis. Logistics rents should edge down 3% in 2015 on the back of a 9% supply growth in 2014. Factory rent is also expected to decline 5% in 2015 as REITs trim rentals to secure anchor tenants in large spaces, coupled with smaller strata-titled spaces competing for non-anchor tenants. 16 Asia Pacific Equity Research 31 January 2015 Brandon Lee (65) 6882-7073 [email protected] Hospitality: Supply concerns still weighing Results takeaways: RevPAR decline continues Results for CDREIT and ART were in line with our forecasts, though the former’s Singapore RevPar fell 1.6% YoY to S$188 in 2014 as ADR was cut by 3.7% to improve occupancy by 1.7 %pts to 89.1%. Mid-tier hotels (e.g., CDREIT’s Copthorne Kings and Studio M) appeared to be the most impacted by RevPAR weakness, as islandwide RevPAR was down 4.6% in 11M14 (vs. single-digit improvements in other segments). Similarly for serviced apartments, ART’s Singapore RevPAU declined 3% YoY to S$211 in 2014. While impact of slowing Chinese arrivals may be reversing, this is being offset by slowing arrivals from Indonesia. OUEHT reported that Mandarin Orchard Singapore’s contribution from Indonesians had dipped to 26% in 2014 from 30% in 2013. Table 16: Hospitality occupancy % CDREIT ART* OUEHT1 31-Mar-13 87.0% NA 94.1% 30-Jun-13 87.7% NA NA 30-Sep-13 87.6% NA NA 31-Dec-13 87.0% NA NA 31-Mar-14 88.2% NA NA 30-Jun-14 86.1% NA NA 30-Sep-14 92.0% NA NA 31-Dec-14 90.0% NA NA 30-Sep-13 191 230 261 31-Dec-13 187 220 249 31-Mar-14 192 205 248 30-Jun-14 181 207 242 30-Sep-14 192 225 252 31-Dec-14 185 205 255 30-Sep-13 -8.6% -3.8% NA 31-Dec-13 -10.5% -2.7% 2.5% 31-Mar-14 0.5% 6.2% -1.0% 30-Jun-14 -6.2% -9.2% -4.7% 30-Sep-14 0.5% -2.2% -3.4% 31-Dec-14 -1.1% -6.8% 2.4% Source: Company data. *Singapore serviced residences. 1Mandarin Orchard Singapore Table 17: Hospitality RevPAR S$ CDREIT ART* OUEHT1 31-Mar-13 191 193 251 30-Jun-13 193 228 254 Source: Company data. *Singapore serviced residences. 1Mandarin Orchard Singapore Table 18: Hospitality RevPAR growth (YoY) % CDREIT ART* OUEHT1 31-Mar-13 -10.3% -17.9% NA 30-Jun-13 -11.1% -8.1% NA Source: Company data. *Singapore serviced residences. 1Mandarin Orchard Singapore Outlook: Headwinds yet to dissipate Hospitality should remain challenging in the near term as both CDREIT and OUEHT guided for a weaker 1Q15 due to the absence of the biennial Air Show, the longer lead-up to the Chinese New Year and impact of latest AirAsia disaster. Room supply is expected to grow 5.7% (3,258 rooms) in 2015, almost double the 3.3% (1,789 rooms) rise in 2014, with growth in Orchard 17 Brandon Lee (65) 6882-7073 [email protected] Asia Pacific Equity Research 31 January 2015 (Hotel Grand Chancellor: 488 rooms), City Fringe (South Beach: 654 rooms) and Suburbs (Genting Singapore: 550 rooms). Chinese visitor growth picked up in Oct/Nov-14 (+13.5%/+9.9%), although arrivals are still down 26% YoY in 11M14. Notably, Indonesians, which form the largest group of visitors at 25% of total, slowed in late-2014, with Aug-Nov14 arrivals down 14% YoY over the same period in 2013. Hotel demand could, however, pick up by 2Q15, helped by SEA Games (Jun-15) and SG 50 Celebrations (3Q15). Nonetheless, this is balanced against the large upcoming supply of rooms. In the longer term, the government’s efforts to stem the new supply of hotel rooms and curb short-term home rentals will work toward alleviating the oversupply situation. 18 Asia Pacific Equity Research 31 January 2015 Brandon Lee (65) 6882-7073 [email protected] Appendix Table 19: SREITs results summary Specified DPU CapitaMall Trust QoQ % 5.1% Ascendas REIT CapitaCommercial Trust Suntec REIT -1.9% 2.4% 10.7% Keppel REIT Mapletree Commercial Trust Mapletree Industrial Trust Ascott Residence Trust Frasers Centrepoint Trust CDL Hospitality Trusts CapitaRetail China Trust -18.4% YoY 4Q14 4Q13 4Q14 Commentary % 5.1% 2.86 2.72 DPU up on higher occupancies, completion of AEIs and positive reversions. DPU slightly missed but is up YoY on the back of positive reversions, improving occupancies and new 1.4% 3.59 3.54 completions. 2.9% 2.15 2.09 DPU up on strong office reversions, lower financing costs, improved occupancies and completion of AEIs. 0.6% 2.58 2.56 DPU impacted by ongoing AEI works at Suntec City mitigated by capital distributions. DPU missed due to income loss on Prudential Tower divestment and enlarged unit base post-placement and -23.4% 1.51 1.97 acquisition of MBFC T3. 5.6% 11.5% 2.08 1.865 Higher DPU on positive reversions and improved NPI margins 2.7% -16.6% 6.4% 12.8% 2.67 1.76 2.51 DPU supported by positive reversions, improved NPI margins, lower borrowing costs and AEI completions. 1.56 Post-rights and one-off adjustments, DPU up on nine properties acquired and stronger performance in UK. -1.3% 19.9% 5.5% 10.0% 7.2% 12.7% 2.75 3.13 2.48 2.5 Higher DPU on positive reversions, acquisition of CCP and lower funding costs. 2.92 Higher income from Maldives offset against reduced rents in Singapore and Australia. 2.2 Higher DPU from Grand Canyon and strong rental reversions. Source: J.P. Morgan estimates, Company data. Table 20: SREITs valuation summary Specified SREITs A-REIT Ascott Residence Trust CapitaCommercial Trust CapitaMall Trust CapitaRetail China Trust CDL Hospitality Trust Far East Hospitality Trust Frasers Centrepoint Trust Keppel REIT Mapletree Commercial Trust Mapletree Industrial Trust Suntec REIT Total / Weighted Average JPM Rating OW OW N N OW UW UW UW N UW N OW Mkt Cap (S$m) 5,990 1,934 5,242 7,305 1,429 1,765 1,482 1,851 3,947 3,229 2,633 4,812 41,620 Share Price Price Target Upside Book P/B 29-Jan-15 Value (S$) (S$) (%) (S$) (x) 2.49 2.55 2.4% 2.03 1.23 1.26 1.40 11.1% 1.37 0.92 1.78 1.75 -1.7% 1.75 1.02 2.11 2.15 1.9% 1.81 1.17 1.73 1.80 4.3% 1.63 1.06 1.80 1.70 -5.6% 1.65 1.09 0.84 0.80 -4.2% 0.98 0.86 2.02 1.85 -8.4% 1.85 1.09 1.25 1.25 0.4% 1.41 0.88 1.54 1.40 -8.8% 1.17 1.31 1.52 1.55 2.0% 1.21 1.26 1.92 2.10 9.4% 2.12 0.91 0.9% 1.08 Implied Yield Implied yield P/B FY15E FY16E FY15E FY16E (x) 1.26 1.02 1.00 1.19 1.10 1.03 0.82 1.00 0.89 1.20 1.28 0.99 1.09 (%) 6.0% 6.8% 4.8% 5.4% 6.2% 6.3% 6.2% 5.7% 5.7% 5.1% 6.8% 5.4% 5.7% (%) 6.3% 6.9% 5.2% 5.6% 6.4% 6.3% 6.4% 5.8% 5.7% 5.2% 6.9% 5.5% 5.8% (%) 5.9% 6.1% 4.9% 5.3% 5.9% 6.7% 6.5% 6.3% 5.7% 5.6% 6.6% 4.9% 5.6% (%) 6.2% 6.2% 5.3% 5.5% 6.2% 6.7% 6.7% 6.3% 5.6% 5.7% 6.8% 5.0% 5.8% Implied Cap Rate (%) 5.4% 5.9% 5.6% 5.7% 6.7% 5.6% 5.0% 4.9% 4.4% 4.3% 6.1% 3.7% 5.2% 20 Day YTD Sh ADTV Gearing Perf (S$m) 24.2 1.9 19.9 30.9 1.5 2.2 0.3 3.2 7.8 3.5 3.7 14.5 (%) 34% 39% 29% 34% 29% 32% 31% 29% 43% 38% 33% 35% 34% (%) 3% 0% 1% 3% 6% 4% 4% 9% 2% 8% 4% -3% 3% Source: J.P. Morgan estimates, Bloomberg, Company data. 19 Asia Pacific Equity Research 31 January 2015 Brandon Lee (65) 6882-7073 [email protected] Table 21: SREITs sub-sector valuation – Industrial (Part 1) Specified SREITs INDUSTRIAL SREITS Ascendas REIT Mapletree Industrial Trust Mapletree Logistics Trust Cache Logistics Trust AIMS AMP Capital Industrial REIT Keppel DC REIT Cambridge Industrial Trust Sabana Shari'ah Compliant REIT Soilbuild Business Space REIT VIVA Industrial Trust Total / Wgt avg Mkt Cap* Price Target Upside (S$m) Share Price* 29-Jan-15 (S$) (S$) (%) 5,990 2,633 2,987 930 2.49 1.52 1.21 1.19 2.55 1.55 2.4% 2.0% 919 896 852 663 634 499 17,004 1.47 1.02 0.67 0.92 0.78 0.81 JPM Rating OW N Book Value P/B (S$) (x) 2.03 1.21 0.98 0.98 1.22 1.26 1.24 1.21 1.7 4.1 2.5 2.6 9.3 5.8 3.0 2.6 5.6 8.8 3.9 (1.7) 15.5 17.6 20.4 8.7 1.52 0.87 0.68 1.08 0.80 0.76 0.97 1.17 0.98 0.84 0.97 1.06 1.11 3.5 5.2 0.0 (2.7) 0.6 1.3 2.2 (0.3) NA (2.9) (8.0) 1.9 0.0 4.5 (1.7) NA (7.5) (11.2) (3.1) (1.8) 2.9 5.0 NA (1.4) (13.7) 5.3 3.9 12.2 1 3 Performance 6 12 Mth (%) ADTV 20 Day (S$m) FY14 3.4 3.7 2.1 2.6 24 4 5 1 14.2 10.0 7.2 8.7 15.0 10.3 7.7 8.8 15.7 10.5 7.8 9.5 16.1 10.6 8.0 9.6 5% 3% 7% 1% 5% 2% 1% 8% 2% 1% 3% 1% 3.5 4.6 0.0 (2.7) 0.0 1.3 2.6 0 5 1 1 1 0 10 11.0 6.1 5.0 7.7 6.2 NA 10.0 11.0 6.6 5.2 7.8 6.3 NA 10.5 11.5 6.9 5.3 7.8 6.4 NA 10.8 11.5 7.0 5.5 NA 6.3 NA 10.7 0% 8% 4% 1% 2% NA 4% 5% 5% 2% 0% 2% NA 3% 0% 1% 4% NA -2% NA 2% YTD FY15E FY16E DPU FY17E FY15E FY16E FY17E DPU Growth (S cts) (%) Source: J.P. Morgan estimates, Bloomberg, Company data. Note DPU forecast for non-covered companies based on Bloomberg consensus. Table 22: SREITs sub-sector valuation – Industrial (Part 2) Specified SREITs Mkt Cap* (S$m) Share Price* 29-Jan-15 (S$) INDUSTRIAL SREITS Ascendas REIT Mapletree Industrial Trust Mapletree Logistics Trust Cache Logistics Trust AIMS AMP Capital Industrial REIT Keppel DC REIT 5,990 2,633 2,987 930 919 896 2.49 1.52 1.21 1.19 1.47 1.02 Cambridge Industrial Trust Sabana Shari'ah Compliant REIT Soilbuild Business Space REIT VIVA Industrial Trust Total / Wgt avg 852 663 634 499 17,004 0.67 0.92 0.78 0.81 Price Target Upside (S$) (%) 2.55 1.55 2.4% 2.0% JPM Rating FY16E Yield FY17E SGS 10Y Yield (%) OW N Source: J.P. Morgan estimates, Bloomberg, Company data. Note DPU forecast for non-covered companies based on Bloomberg consensus. 20 FY15E FY15E FY17E Gearing (%) FY16E Yield Spread (%) (%) (%) 5.7% 6.6% 6.0% 7.3% 7.5% 6.0% 6.0% 6.8% 6.4% 7.4% 7.5% 6.5% 6.3% 6.9% 6.4% 8.0% 7.8% 6.8% 1.91% 1.91% 1.91% 1.91% 1.91% 1.91% 3.8% 4.7% 4.0% 5.4% 5.6% 4.1% 4.1% 4.9% 4.5% 5.5% 5.6% 4.6% 4.4% 5.0% 4.5% 6.1% 5.9% 4.9% 29.6% 34.4% 33.1% 30.7% 31.5% NA 7.5% 8.4% 7.9% NA 6.2% 7.8% 8.5% 8.1% NA 6.5% 7.9% 8.5% 8.2% NA 6.7% 1.91% 1.91% 1.91% 1.91% 1.91% 5.6% 6.5% 6.0% NA 4.3% 5.9% 6.6% 6.2% NA 4.6% 6.0% 6.6% 6.3% NA 4.8% 28.1% 36.2% 35.0% 43.7% 30.4% Asia Pacific Equity Research 31 January 2015 Brandon Lee (65) 6882-7073 [email protected] Table 23: SREITs sub-sector valuation – Retail (Part 1) Specified SREITs Mkt Cap* (S$m) RETAIL SREITS CapitaMall Trust Mapletree Commercial Trust Frasers Centrepoint Trust Starhill Global REIT SPH REIT Total / Wgt avg 7,305 3,229 1,851 1,787 2,660 16,833 Share Price* 29-Jan-15 (S$) Price Target Upside (S$) (%) 2.11 1.54 2.02 0.83 1.06 2.15 1.40 1.85 1.9% (8.8%) (8.4%) JPM Rating N UW UW Book Value P/B (S$) (x) 1.81 1.17 1.85 0.92 0.93 1.16 1.32 1.09 0.90 1.13 1.15 1 3.9 7.4 8.4 4.4 1.4 4.7 3 Performance 6 12 Mth (%) 7.9 7.4 7.6 3.7 0.0 6.1 6.6 8.2 6.5 -0.6 -0.5 5.0 12.8 30.9 21.2 9.2 7.7 16.0 YTD 3.4 8.2 8.7 4.4 1.4 4.7 ADTV 20 Day (S$m) FY14 31 3 3 2 2 15 10.8 7.4 11.2 5.0 5.4 8.7 FY15E FY16E FY17E DPU (S cts) 11.3 7.9 11.6 5.1 5.4 9.1 11.7 7.9 11.7 5.2 5.7 9.4 12.1 8.2 11.8 5.4 5.9 9.6 Source: J.P. Morgan estimates, Bloomberg, Company data. Note DPU forecast for non-covered companies based on Bloomberg consensus. Table 24: SREITs sub-sector valuation – Retail (Part 2) Specified SREITs Mkt Cap* (S$m) RETAIL SREITS CapitaMall Trust Mapletree Commercial Trust Frasers Centrepoint Trust Starhill Global REIT SPH REIT Total / Wgt avg Share Price* 29-Jan-15 (S$) Price Target Upside (S$) (%) 2.11 1.54 2.02 0.83 1.06 2.15 1.40 1.85 1.9% (8.8%) (8.4%) 7,305 3,229 1,851 1,787 2,660 16,833 JPM Rating FY15E FY16E Yield FY17E SGS 10Y Yield FY15E FY17E Gearing (%) FY16E Yield Spread (%) (%) (%) 3.2% 2.9% 3.6% 4.1% 3.2% 3.3% 3.4% 3.2% 3.8% 4.2% 3.2% 3.5% 3.6% 3.3% 3.9% 4.4% 3.5% 3.7% 32.1% 38.6% 29.3% 28.7% 25.8% 31.7% (%) N UW UW 5.1% 4.8% 5.5% 6.0% 5.1% 5.2% 5.4% 5.1% 5.7% 6.1% 5.1% 5.4% 5.6% 5.2% 5.8% 6.3% 5.4% 5.6% 1.91% 1.91% 1.91% 1.91% 1.91% 1.91% Source: J.P. Morgan estimates, Bloomberg, Company data. Note DPU forecast for non-covered companies based on Bloomberg consensus. Table 25: SREITs sub-sector valuation – Office (Part 1) Specified SREITs Mkt Cap* (S$m) OFFICE SREITS CapitaCommercial Trust Suntec REIT Keppel REIT OUE Commercial REIT* Frasers Commercial Trust* Total / Wgt avg 5,242 4,812 3,947 722 1,012 15,736 Share Price* 29-Jan-15 (S$) Price Target Upside (S$) (%) 1.78 1.92 1.25 0.83 1.49 1.75 2.10 1.25 (1.7%) 9.4% 0.4% 0.00 JPM Rating N OW N Book Value P/B (S$) (x) 1.75 2.12 1.41 1.10 1.59 1.02 0.91 0.89 0.75 0.94 0.93 1 3.2 -3.6 2.5 0.0 4.2 0.9 3 8.2 6.8 1.6 0.6 5.0 5.6 Performance 6 12 Mth (%) 5.6 5.0 -2.0 -3.0 5.3 3.1 25.4 17.7 10.7 1.3 18.4 17.8 YTD 1.4 -3.3 2.0 0.0 4.6 0.3 ADTV 20 Day (S$m) FY14 20 14 8 1 2 13 8.5 9.4 7.2 5.4 8.4 8.3 FY15E FY16E FY17E DPU (S cts) 8.6 10.3 7.1 5.5 9.8 8.7 9.2 10.5 7.0 5.5 10.0 9.0 9.3 10.8 6.8 5.3 10.0 9.0 Source: J.P. Morgan estimates, Bloomberg, Company data. Note DPU forecast for non-covered companies based on Bloomberg consensus. 21 Asia Pacific Equity Research 31 January 2015 Brandon Lee (65) 6882-7073 [email protected] Table 26: SREITs sub-sector valuation – Office (Part 2) Specified SREITs Mkt Cap* (S$m) OFFICE SREITS CapitaCommercial Trust Suntec REIT Keppel REIT OUE Commercial REIT* Frasers Commercial Trust* Total / Wgt avg Share Price* 29-Jan-15 (S$) Price Target Upside (S$) (%) 1.78 1.92 1.25 0.83 1.49 1.75 2.10 1.25 (1.7%) 9.4% 0.4% 5,242 4,812 3,947 722 1,012 15,736 JPM Rating FY15E FY16E Yield FY17E SGS 10Y Yield FY15E FY17E Gearing (%) FY16E Yield Spread (%) (%) (%) 2.8% 3.0% 3.9% 4.6% 3.7% 3.3% 2.9% 3.5% 3.8% 4.7% 4.7% 3.5% 3.3% 3.6% 3.8% 4.7% 4.8% 3.6% 16.4% 34.7% 36.4% 41.9% 36.8% 29.5% (%) N OW N 4.8% 4.9% 5.8% 6.5% 5.6% 5.2% 0.00 4.8% 5.4% 5.7% 6.6% 6.6% 5.4% 5.2% 5.5% 5.7% 6.6% 6.7% 5.6% 1.91% 1.91% 1.91% 1.91% 1.91% 1.91% Source: J.P. Morgan estimates, Bloomberg, Company data. Note DPU forecast for non-covered companies based on Bloomberg consensus. Table 27: SREITs sub-sector valuation – Hospitality (Part 1) Specified SREITs Mkt Cap* (S$m) HOSPITALITY SREITS Ascott Residence Trust CDL Hospitality Trusts Far East Hospitality Trust OUE Hospitality Trust Ascendas Hospitality Trust Total / Wgt avg 1,934 1,765 1,482 1,238 756 7,175 Share Price* 29-Jan-15 (S$) Price Target Upside (S$) (%) 1.26 1.80 0.84 0.94 0.68 1.40 1.70 0.80 11.1% (5.6%) (4.2%) JPM Rating OW UW UW Book Value P/B (S$) (x) 1.37 1.65 1.00 0.90 0.77 0.92 1.09 0.84 1.03 0.88 0.96 1 0.8 4.3 3.0 3.3 0.7 2.6 3 Performance 6 12 Mth (%) 3.7 5.6 3.7 3.9 -2.8 3.5 2.0 2.3 -3.4 5.0 -9.9 0.2 7.2 12.5 7.6 7.4 -5.5 7.3 YTD 0.0 3.7 3.7 3.9 0.7 2.4 ADTV 20 Day (S$m) FY14 2 2 0 1 0 1 8.2 11.0 5.4 6.7 5.8 7.8 FY15E FY16E FY17E DPU (S cts) 8.6 11.4 5.2 6.9 5.5 7.9 8.7 11.4 5.4 7.1 6.2 8.1 8.9 11.7 0.0 7.1 6.2 7.1 Source: J.P. Morgan estimates, Bloomberg, Company data. Note DPU forecast for non-covered companies based on Bloomberg consensus. Table 28: SREITs sub-sector valuation – Hospitality (Part 2) Specified SREITs Mkt Cap* (S$m) HOSPITALITY SREITS Ascott Residence Trust CDL Hospitality Trusts Far East Hospitality Trust OUE Hospitality Trust Ascendas Hospitality Trust Total / Wgt avg 1,934 1,765 1,482 1,238 756 7,175 Share Price* 29-Jan-15 (S$) Price Target Upside (S$) (%) 1.26 1.80 0.84 0.94 0.68 1.40 1.70 0.80 11.1% (5.6%) (4.2%) JPM Rating FY16E Yield FY17E SGS 10Y Yield (%) OW UW UW Source: J.P. Morgan estimates, Bloomberg, Company data. Note DPU forecast for non-covered companies based on Bloomberg consensus. 22 FY15E 6.5% 6.1% 6.5% 7.2% 8.5% 6.7% 6.8% 6.3% 6.2% 7.4% 8.1% 6.8% 6.9% 6.3% 6.4% 7.6% 9.1% 7.0% 1.91% 1.91% 1.91% 1.91% 1.91% 1.91% FY15E FY17E Gearing (%) FY16E Yield Spread (%) (%) (%) 4.6% 4.2% 4.6% 5.3% 6.6% 4.8% 4.9% 4.4% 4.3% 5.5% 6.2% 4.9% 5.0% 4.4% 4.5% 5.7% 7.2% 5.1% 37.6% 31.6% 30.9% 31.7% 35.6% 33.5% Asia Pacific Equity Research 31 January 2015 Brandon Lee (65) 6882-7073 [email protected] Table 29: SREITs sub-sector valuation – Healthcare (Part 1) Specified SREITs Mkt Cap* (S$m) HEALTHCARE SREITS Parkway Life REIT First REIT Religare Health Trust Total / Wgt avg 1,452 978 811 3,240 Share Price* 29-Jan-15 (S$) Price Target Upside (S$) (%) JPM Rating 2.40 1.33 1.02 Book Value P/B (S$) (x) 1.71 1.02 0.89 1.40 1.30 1.14 1.31 1 1.7 4.8 4.0 3.2 3 Performance 6 12 Mth (%) 1.3 6.9 5.6 4.1 0.8 7.8 10.8 5.4 7.1 26.4 35.5 20.0 YTD 1.7 4.8 3.0 2.9 ADTV 20 Day (S$m) FY14 1 1 2 1 12.0 8.1 7.9 9.8 FY15E FY16E FY17E DPU (S cts) 12.6 8.5 7.6 10.1 12.4 8.8 8.1 10.2 12.3 9.3 8.8 10.5 Source: J.P. Morgan estimates, Bloomberg, Company data. Note DPU forecast for non-covered companies based on Bloomberg consensus. Table 30: SREITs sub-sector valuation – Healthcare (Part 2) Specified SREITs Mkt Cap* Share Price* 29-Jan-15 (S$) (S$m) HEALTHCARE SREITS Parkway Life REIT First REIT Religare Health Trust Total / Wgt avg 1,452 978 811 3,240 Price Target Upside (S$) (%) JPM Rating FY15E FY16E Yield FY17E SGS 10Y Yield FY15E FY17E Gearing (%) FY16E Yield Spread (%) (%) (%) 3.1% 4.2% 5.8% 4.1% 3.3% 4.5% 5.5% 4.2% 3.3% 4.7% 6.0% 4.4% 35.0% 32.7% 6.7% 27.2% (%) 2.40 1.33 1.02 5.0% 6.1% 7.7% 6.0% 5.3% 6.4% 7.5% 6.2% 5.2% 6.6% 7.9% 6.3% 1.91% 1.91% 1.91% 1.91% Source: J.P. Morgan estimates, Bloomberg, Company data. Note DPU forecast for non-covered companies based on Bloomberg consensus. Table 31: SREITs sub-sector valuation – International (Part 1) Specified SREITs INTERNATIONAL SREITS Ascendas India Trust CapitaRetail China Trust Mapletree Greater China Commercial Trust Fortune REIT (HK$) Croesus Retail Trust Lippo Malls Indonesia Retail Trust Total / Wgt avg Mkt Cap* (S$m) Share Price* 29-Jan-15 (S$) 806 1,429 0.88 1.73 2,754 16,418 481 932 22,819 1.02 8.75 0.94 0.35 Price Target Upside (S$) (%) 1.80 4.3% JPM Rating OW Book Value P/B (S$) (x) 0.60 1.49 1.46 1.16 9.4 6.5 8.1 7.2 4.8 1.5 27.0 29.9 1.06 11.93 0.83 0.41 0.96 0.73 1.13 0.83 0.83 7.4 13.5 2.2 4.4 11.5 9.7 25.5 0.0 -5.3 20.0 11.5 19.6 -7.4 -13.4 15.1 25.2 46.4 7.4 -13.4 38.9 1 3 Performance 6 12 Mth (%) ADTV 20 Day (S$m) FY14 6.1 6.2 1 1 4.5 9.8 4.8 10.6 5.3 11.1 5.4 11.4 7.4 13.0 1.6 4.4 11.1 4 6 0 1 5 5.9 41.8 7.4 2.8 31.8 6.3 45.1 8.5 3.1 34.3 6.7 46.9 8.6 3.1 35.7 6.7 51.0 7.8 NA 38.6 YTD FY15E FY16E FY17E DPU (S cts) Source: J.P. Morgan estimates, Bloomberg, Company data. Note DPU forecast for non-covered companies based on Bloomberg consensus. 23 Asia Pacific Equity Research 31 January 2015 Brandon Lee (65) 6882-7073 [email protected] Table 32: SREITs sub-sector valuation – Hospitality (Part 2) Specified SREITs Mkt Cap* INTERNATIONAL SREITS Ascendas India Trust CapitaRetail China Trust Mapletree Greater China Commercial Trust Fortune REIT (HK$) Croesus Retail Trust Lippo Malls Indonesia Retail Trust Total / Wgt avg (S$m) Share Price* 29-Jan-15 (S$) 806 1,429 0.88 1.73 2,754 16,418 481 932 22,819 1.02 8.75 0.94 0.35 Price Target Upside (S$) (%) 1.80 4.3% JPM Rating FY15E FY16E Yield FY17E SGS 10Y Yield (%) OW FY15E FY17E Gearing (%) FY16E Yield Spread (%) (%) (%) 5.1% 5.7% 5.5% 6.2% 6.1% 6.4% 1.91% 1.91% 3.2% 3.8% 3.6% 4.2% 4.1% 4.5% 22.1% 28.5% 5.8% 4.8% 7.9% 8.1% 5.2% 6.2% 5.2% 9.0% 9.0% 5.6% 6.6% 5.4% 9.1% 9.0% 5.8% 1.91% 1.91% 1.91% 1.91% 1.91% 3.9% 2.9% 6.0% 6.2% 3.3% 4.3% 3.2% 7.1% 7.1% 3.7% 4.7% 3.5% 7.2% 7.1% 3.9% 38.0% 29.2% 51.7% 34.0% 30.7% Source: J.P. Morgan estimates, Bloomberg, Company data. Note DPU forecast for non-covered companies based on Bloomberg consensus. Table 33: SREITs trading range (Part 1) Specified SREITs A-REIT Ascott Residence Trust CapitaCommercial Trust CapitaMall Trust CapitaRetail China Trust CDL Hospitality Trusts Far East Hospitality Trust Frasers Centrepoint Trust Keppel REIT Mapletree Commercial Trust Mapletree Industrial Trust Suntec REIT Total / Weighted Average Mkt Cap* Current Implied (S$m) 5,990 1,934 5,242 7,305 1,429 1,765 1,482 1,851 3,947 3,229 2,633 4,812 41,620 1.25 0.97 1.06 1.26 1.18 1.13 0.84 1.30 0.97 1.44 1.38 0.92 1.15 1.25 1.02 1.00 1.18 1.21 1.03 0.80 1.00 0.89 1.20 1.28 0.99 1.09 Source: J.P. Morgan estimates, Bloomberg, Company data. 24 P/B Mean Mean ex-GFC (x) 1.31 1.34 0.88 0.92 0.88 0.91 1.27 1.30 1.27 1.32 1.20 1.25 0.94 0.94 1.10 1.14 0.82 0.86 1.11 1.11 1.23 1.23 0.80 0.83 1.08 1.10 Trough Peak Current Implied 0.60 0.24 0.20 0.47 0.45 0.30 0.79 0.46 0.22 0.89 1.08 0.25 0.47 2.11 1.57 1.68 2.25 3.31 2.54 1.31 1.70 1.63 1.44 1.43 1.30 1.83 5.8% 6.5% 4.6% 5.1% 5.5% 6.1% 6.6% 5.5% 6.2% 4.7% 6.5% 4.9% 5.5% 5.8% 5.7% 4.7% 5.1% 5.7% 6.5% 6.8% 6.1% 6.1% 4.7% 6.6% 4.5% 5.5% Dividend Yield Mean Mean ex-GFC (%) 6.6% 6.4% 7.4% 6.8% 5.8% 5.4% 5.2% 5.1% 6.4% 6.0% 6.5% 5.8% 6.4% 6.4% 6.0% 5.6% 6.6% 6.1% 5.4% 5.4% 7.0% 7.0% 7.0% 6.4% 6.2% 5.9% Trough Peak Current Implied 13.7% 23.7% 17.4% 11.0% 16.2% 23.5% 7.2% 12.9% 17.8% 6.2% 7.9% 22.7% 14.9% 4.2% 3.2% 2.8% 2.9% 2.1% 2.9% 5.0% 3.4% 2.3% 4.3% 5.9% 3.8% 3.5% 6.3% 6.7% 4.7% 5.3% 6.4% 6.3% 6.2% 5.8% 5.7% 4.7% 6.9% 5.4% 5.7% 6.1% 6.1% 4.8% 5.2% 6.1% 6.7% 6.5% 6.3% 5.7% 5.2% 6.7% 4.9% 5.6% Forward Yield Mean Mean ex-GFC (%) 6.9% 6.8% 7.5% 7.0% 5.9% 5.6% 5.4% 5.4% 6.8% 6.3% 6.7% 6.2% 6.0% 6.0% 6.4% 6.1% 6.5% 6.1% 5.9% 5.9% 7.5% 7.5% 7.2% 6.6% 6.4% 6.2% Trough Peak 12.0% 20.4% 15.9% 8.8% 17.7% 19.5% 7.0% 13.6% 15.7% 7.4% 8.6% 22.3% 13.7% 4.6% 3.8% 2.9% 3.2% 2.1% 3.7% 4.6% 3.7% 2.9% 4.6% 6.3% 4.6% 3.9% Asia Pacific Equity Research 31 January 2015 Brandon Lee (65) 6882-7073 [email protected] Table 34: SREITs trading range (Part 2) Specified SREITs A-REIT Ascott Residence Trust CapitaCommercial Trust CapitaMall Trust CapitaRetail China Trust CDL Hospitality Trusts Far East Hospitality Trust Frasers Centrepoint Trust Keppel REIT Mapletree Commercial Trust Mapletree Industrial Trust Suntec REIT Total / Weighted Average Mkt Cap* (S$m) 5,990 1,934 5,242 7,305 1,429 1,765 1,482 1,851 3,947 3,229 2,633 4,812 41,620 10Y SGS Yield (%) 1.9% 1.9% 1.9% 1.9% 1.9% 1.9% 1.9% 1.9% 1.9% 1.9% 1.9% 1.9% 1.9% Current Implied 3.9% 4.6% 2.7% 3.2% 3.6% 4.2% 4.7% 3.6% 4.3% 2.8% 4.6% 3.0% 3.6% 3.9% 3.8% 2.8% 3.2% 3.8% 4.6% 4.9% 4.2% 4.1% 2.8% 4.7% 2.6% 3.6% Dividend Yield Spread Mean Mean 4.7% 5.5% 3.8% 3.3% 4.5% 4.6% 4.5% 4.1% 4.7% 3.5% 5.1% 5.1% 4.3% 4.5% 4.9% 3.5% 3.2% 4.1% 3.9% 4.5% 3.7% 4.2% 3.5% 5.1% 4.5% 4.0% Trough Peak Current Implied 11.8% 21.8% 15.5% 9.0% 14.3% 21.6% 5.3% 11.0% 15.9% 4.3% 6.0% 20.8% 13.0% 2.3% 1.3% 0.9% 1.0% 0.2% 1.0% 3.1% 1.5% 0.4% 2.4% 4.0% 1.9% 1.6% 4.4% 4.8% 2.8% 3.4% 4.4% 4.4% 4.3% 3.9% 3.8% 2.8% 5.0% 3.5% 3.8% 4.2% 4.2% 2.9% 3.3% 4.2% 4.8% 4.6% 4.4% 3.8% 3.2% 4.8% 3.0% 3.7% Forward Yield Spread Mean Mean 5.0% 5.6% 4.0% 3.5% 4.9% 4.7% 4.1% 4.5% 4.6% 4.0% 5.6% 5.3% 4.5% 4.9% 5.1% 3.7% 3.5% 4.4% 4.3% 4.1% 4.2% 4.2% 4.0% 5.6% 4.7% 4.3% Trough Peak 10.1% 18.5% 13.9% 6.9% 15.8% 17.5% 5.0% 11.6% 13.8% 5.5% 6.7% 20.4% 11.8% 2.7% 1.9% 1.0% 1.3% 0.2% 1.8% 2.7% 1.8% 0.9% 2.7% 4.4% 2.6% 2.0% Source: J.P. Morgan estimates, Bloomberg, Company data. 25 Asia Pacific Equity Research 31 January 2015 Brandon Lee (65) 6882-7073 [email protected] Table 35: S-REITs Credit profile Specified CapitaMall Trust Ascendas REIT CapitaCommercial Trust Suntec REIT Keppel REIT Mapletree Commercial Trust Mapletree Industrial Trust Ascott Residence Trust Frasers Centrepoint Trust CDL Hospitality Trusts Far East Hospitality Trust CapitaRetail China Trust Covered Stocks Share price 30-Jan-15 (S$) 2.11 2.46 1.78 1.90 1.25 1.53 1.54 1.27 2.06 1.81 0.85 1.72 Current Mkt Cap (S$ MM) 7,305.2 5,918.0 5,241.8 4,749.8 3,947.2 3,208.3 2,668.3 1,949.5 1,887.3 1,772.9 1,502.4 1,420.2 41,570.9 Target Price 2.15 2.55 1.75 2.10 1.25 1.40 1.55 1.40 1.85 1.70 0.80 1.80 Current gearing (%) 33.8% 33.6% 29.3% 34.7% 43.3% 37.9% 32.8% 38.5% 29.3% 31.7% 31.4% 28.7% 34.1% Interest coverage (x) 4.5 6.1 7.2 4.3 5.0 5.5 8.1 4.3 6.3 8.6 NA 6.2 5.5 Avg. debt duration (year) 4.7 3.9 3.9 3.6 3.6 3.0 4.0 4.4 2.3 2.8 2.5 2.8 3.7 Interest cost (%) 3.5% 2.7% 2.3% 2.4% 2.2% 2.2% 2.2% 3.0% 2.7% 2.3% 2.2% 3.3% 2.6% Fixed borrowings (%) 100% 66% 83% 60% 65% 74% 86% 80% 87% 41% 60% 73% 75.8% BVPS/ NAV (S$) 1.81 2.03 1.75 2.12 1.41 1.17 1.21 1.37 1.85 1.65 0.98 1.63 WALE (years) NA 3.9 8.1 3.0 6.1 2.0 2.6 NA 1.7 NA NA 9.0 3.2 Occupancy (%) 98.8% 86.8% 96.4% 100.0% 99.3% 99.2% 90.8% NA 96.4% 90.0% 87.1% 95.9% 90.9% Source: J.P. Morgan estimates, Bloomberg, Company data. Table 36: S-REITs Debt expiry profile Specified A-REIT Ascott Residence Trust CapitaCommercial Trust CapitaMall Trust CapitaRetail China Trust CDL Hospitality Trust Far East Hospitality Trust Frasers Centrepoint Trust Keppel REIT Mapletree Commercial Trust Mapletree Industrial Trust Suntec REIT Covered Stocks Share price 30-Jan-15 (S$) 2.46 1.27 1.78 2.11 1.72 1.81 0.85 2.06 1.25 1.53 1.54 1.90 Current Mkt cap (S$ MM) 5,918 1,949 5,242 7,305 1,420 1,773 1,502 1,887 3,947 3,208 2,668 4,750 41,571 Total debt (S$ MM) 2,664 1,560 2,239 3,428 673 777 798 739 3,545 1,551 1,086 2,646 21,706 CY2015 (S$ MM) 215 249 270 577 123 318 316 95 300 0 0 0 2,463 CY2016 (S$ MM) 350 263 946 412 105 84 0 264 403 289 126 370 3,611 CY2017 (S$ MM) 675 141 175 250 131 0 250 190 733 354 139 200 3,237 CY2018 (S$ MM) 448 222 200 505 139 219 132 60 715 230 109 966 3,945 CY2019 (S$ MM) 457 128 248 158 75 156 100 60 1,045 0 185 800 3,412 CY2020 (S$ MM) 0 149 275 226 100 0 0 70 350 448 289 310 2,216 CY2021 (S$ MM) 62 268 125 412 0 0 0 0 0 160 93 0 1,120 > CY2021 (S$ MM) 457 141 0 888 0 0 0 0 0 70 145 0 1,701 Total debt (S$ MM) 2,664 1,560 2,239 3,428 673 777 798 739 3,545 1,551 1,086 2,646 21,706 CY2015 (S$ MM) 8% 16% 12% 17% 18% 41% 40% 13% 8% 0% 0% 0% 11% CY2016 (S$ MM) 13% 17% 42% 12% 16% 11% 0% 36% 11% 19% 12% 14% 17% CY2017 (S$ MM) 25% 9% 8% 7% 19% 0% 31% 26% 21% 23% 13% 8% 15% CY2018 (S$ MM) 17% 14% 9% 15% 21% 28% 17% 8% 20% 15% 10% 37% 18% CY2019 (S$ MM) 17% 8% 11% 5% 11% 20% 13% 8% 29% 0% 17% 30% 16% CY2020 (S$ MM) 0% 10% 12% 7% 15% 0% 0% 9% 10% 29% 27% 12% 10% CY2021 (S$ MM) 2% 17% 6% 12% 0% 0% 0% 0% 0% 10% 9% 0% 5% > CY2021 (S$ MM) 17% 9% 0% 26% 0% 0% 0% 0% 0% 5% 13% 0% 8% Source: J.P. Morgan estimates, Bloomberg, Company data. Table 37: S-REITs Debt expiry composition Specified A-REIT Ascott Residence Trust CapitaCommercial Trust CapitaMall Trust CapitaRetail China Trust CDL Hospitality Trust Far East Hospitality Trust Frasers Centrepoint Trust Keppel REIT Mapletree Commercial Trust Mapletree Industrial Trust Suntec REIT Covered Stocks Share price 30-Jan-15 (S$) 2.46 1.27 1.78 2.11 1.72 1.81 0.85 2.06 1.25 1.53 1.54 1.90 Current Mkt cap (S$ MM) 5,918 1,949 5,242 7,305 1,420 1,773 1,502 1,887 3,947 3,208 2,668 4,750 41,571 Source: J.P. Morgan estimates, Bloomberg, Company data. 26 Asia Pacific Equity Research 31 January 2015 Brandon Lee (65) 6882-7073 [email protected] A-REIT Company Data Shares O/S (mn) Market Cap (S$ mn) Market Cap ($ mn) Price (S$) Date Of Price Free Float(%) 3M - Avg daily vol (mn) 3M - Avg daily val (S$ mn) 3M - Avg daily val ($ mn) FTSTI Exchange Rate Price Target End Date 2,406 5,918 4,371 2.46 30 Jan 15 8.22 19.51 14.4 3419.05 1.35 31-Dec-15 Ascendas Real Estate Investment Trust (Reuters: AEMN.SI, Bloomberg: AREIT SP) S$ in mn, year-end Mar FY13A FY14A FY15E FY16E FY17E Revenue (S$ mn) 576 614 655 681 695 Net property income (S$ mn) 409 436 463 481 491 Distributable Profit (S$ mn) 306 342 361 378 388 EPU (S$) 0.12 0.14 0.15 0.15 0.16 DPU (S$) 0.14 0.14 0.15 0.16 0.16 BVPU (S$) 1.94 2.02 2.01 2.01 2.01 Revenue growth (%) 14.4% 6.6% 6.7% 4.0% 2.0% DPU growth (%) 1.3% 3.6% 5.4% 4.6% 2.4% P/E (x) 20.7 17.6 16.8 16.1 15.7 P/BV (x) 1.3 1.2 1.2 1.2 1.2 Dividend Yield 5.6% 5.8% 6.1% 6.4% 6.5% Gearing 28.4% 29.6% 32.9% 32.9% 32.9% RNAV/Share 2.49 Source: Company data, Bloomberg, J.P. Morgan estimates. Investment Thesis, Valuation and Risks A-REIT (Overweight; Price Target: S$2.55) Investment Thesis A-REIT is one of the most defensive REITs, with a 34% gearing ratio as of Dec-14, a stable lease expiry profile and reasonable in-place rents. The REIT’s focus on internal portfolio growth will drive a three-year DPU CAGR of 4%, on our estimates. Valuation Our Dec-15 price target of S$2.55 is based on the average of our DDM and RNAV estimates, with DDM using a 7.6% discount rate and long-term growth rate of 1.0%. RNAV is estimated at S$299psf. Risks to Rating and Price Target Key upside risks include better-than-expected execution of its China expansion and improved occupancy rates, especially for business parks. Key downside risks include an inability to execute on ongoing development projects, rent reduction by competing industrial landlords in order to fill up space, and SUAMTB conversions having trouble filling up space. 27 Brandon Lee (65) 6882-7073 [email protected] Asia Pacific Equity Research 31 January 2015 A-REIT: Summary of Financials Income Statement S$ in millions, year end Mar FY14 FY15E Revenues 614 655 % change Y/Y 6.6% 6.7% EBIT 395 421 % change Y/Y 8.6% 6.5% EBIT Margin (%) 64.4% 64.3% Net Interest (36) (68) Earnings before tax 505 353 % change Y/Y 49.8% (30.1%) Tax (23) (2) as % of EBT 4.6% 0.5% Net income (reported) 336 352 % change Y/Y 27.2% 4.6% Core net profit 336 352 % change Y/Y 27.2% 4.6% Shares outstanding 2,403 2,406 EPS (reported) (S$) 0.14 0.15 % change Y/Y 17.9% 4.5% DPU (reported) (S$) 0.14 0.15 % change Y/Y 3.6% 5.4% Balance sheet S$ in millions, year end Mar FY14 FY15E Cash and cash equivalents 66 59 Accounts receivable 66 52 Inventories Others 13 13 Current assets 144 124 LT investments 6,923 7,304 Net fixed assets 0 1 Total Assets 7,357 7,719 Liabilities ST Loans 946 946 Payables 127 131 Others 33 33 Total current liabilities 1,107 1,110 Long-term debt 1,231 1,591 Other liabilities 171 171 Total Liabilities 2,509 2,872 Shareholders' equity 4,849 4,846 BVPS 2.02 2.01 Source: Company reports and J.P. Morgan estimates. 28 FY16E 681 4.0% 439 4.3% 64.5% (68) 371 5.0% (2) 0.6% 369 4.8% 369 4.8% 2,409 0.15 4.7% 0.16 4.6% FY17E 695 2.0% 449 2.2% 64.6% (68) 380 2.6% (2) 0.6% 378 2.6% 378 2.6% 2,412 0.16 2.5% 0.16 2.4% FY16E 56 54 13 124 7,307 1 7,722 FY17E 56 56 13 124 7,307 1 7,722 946 136 33 1,115 1,591 171 2,878 4,844 2.01 946 139 33 1,118 1,591 171 2,880 4,842 2.01 Cash flow statement S$ in millions, year end Mar EBIT Depr. & amortization Change in working capital Others Cash flow from operations FY14 395 1 5 66 407 FY15E 421 1 17 75 444 FY16E 439 1 3 75 448 FY17E 449 1 2 75 456 Capex Disposal/(purchase) Net Interest Free cash flow (0) 441 (1) 511 (1) 515 (1) 523 Equity raised/(repaid) Debt raised/(repaid) Other Dividends paid Beginning cash Ending cash DPU reported 0 170 (70) (326) 20 66 0.14 0 360 (71) (361) 66 59 0.15 0 0 (71) (378) 59 56 0.16 0 0 (71) (388) 56 56 0.16 Ratio Analysis S$ in millions, year end Mar EBIT Margin Net margin FY14 64.4% 54.8% FY15E 64.3% 53.7% FY16E 64.5% 54.1% FY17E 64.6% 54.5% Sales growth Net profit growth EPS growth Interest coverage (x) Net debt to total capital Net debt to equity Sales/assets (x) Assets/equity (x) ROE ROCE 6.6% 27.2% 17.9% 11.0 30.3% 43.5% 0.1 1.5 7.1% 5.5% 6.7% 4.6% 4.5% 6.2 33.8% 51.1% 0.1 1.6 7.3% 5.8% 4.0% 4.8% 4.7% 6.5 33.9% 51.2% 0.1 1.6 7.6% 5.9% 2.0% 2.6% 2.5% 6.6 33.9% 51.2% 0.1 1.6 7.8% 6.0% Asia Pacific Equity Research 31 January 2015 Brandon Lee (65) 6882-7073 [email protected] Ascott Residence Trust Company Data Shares O/S (mn) Market Cap (S$ mn) Market Cap ($ mn) Price (S$) Date Of Price Free Float(%) 3M - Avg daily vol (mn) 3M - Avg daily val (S$ mn) 3M - Avg daily val ($ mn) FTSTI Exchange Rate Price Target End Date 1,535 1,942 1,434 1.27 30 Jan 15 1.09 1.38 1.0 3419.05 1.35 31-Dec-15 Ascott Residence Trust (Reuters: ASRT.SI, Bloomberg: ART SP) S$ in mn, year-end Dec FY12A FY13A FY14A Revenue (S$ mn) 304 317 357 Net property income (S$ mn) 159 161 180 Distributable Profit (S$ mn) 100 115 126 EPU (S$) 0.06 0.05 0.05 DPU (S$) 0.09 0.08 0.08 BVPU (S$) 1.44 1.44 1.44 Revenue growth (%) 5.3% 4.2% 12.8% DPU growth (%) 2.7% (4.1%) (2.4%) P/E (x) 21.6 26.0 26.1 P/BV (x) 0.9 0.9 0.9 Dividend Yield 6.9% 6.6% 6.5% Gearing 39.0% 33.4% 37.6% RNAV/Share - FY15E 407 209 133 0.07 0.09 1.42 14.0% 4.6% 18.1 0.9 6.8% 37.7% 1.42 FY16E 413 213 135 0.07 0.09 1.41 1.5% 1.1% 17.9 0.9 6.9% 38.0% - Source: Company data, Bloomberg, J.P. Morgan estimates. Investment Thesis, Valuation and Risks Ascott Residence Trust (Overweight; Price Target: S$1.40) Investment Thesis ART has a diversified serviced residence portfolio across Asia and Europe/UK, with fixed lease structures in volatile Europe regions and variable lease structures in improving Asia markets. Inorganic growth has primarily been through sponsorrelated acquisitions from Ascott Group. However, the trust's portfolio remains highly sensitive toward global economic growth trends. Valuation Our Dec-15 price target of S$1.40 is based on the average of our DDM and RNAV estimates, with DDM utilizing an 8.7% discount rate and long-term growth rate of 2.0%. Tenure adjusted RNAV is estimated @ S$408,081 per key. Risks to Rating and Price Target Key upside/downside risks stem from any volatility in global GDP growth, which would magnify RevPAU forecast errors, given high operating leverage in the business. Additional downside risk would be on further exchange rate fluctuations. 29 Brandon Lee (65) 6882-7073 [email protected] Asia Pacific Equity Research 31 January 2015 Ascott Residence Trust: Summary of Financials Income Statement S$ in millions, year end Dec FY14 Revenues 357 % change Y/Y 12.8% EBIT 160 % change Y/Y 8.1% EBIT Margin (%) 44.9% Net Interest (41) Earnings before tax 167 % change Y/Y (33.5%) Tax (37) as % of EBT 22.1% Net income (reported) 74 % change Y/Y 18.3% Core net profit 74 % change Y/Y 18.3% Shares outstanding 1,535 EPS (reported) (S$) 0.05 % change Y/Y (0.1%) DPU (reported) (S$) 0.08 % change Y/Y (2.4%) Balance sheet S$ in millions, year end Dec FY14 Cash and cash equivalents 193 Accounts receivable 36 Inventories 0 Others 88 Current assets 317 LT investments 3,724 Net fixed assets 54 Total Assets 4,122 Liabilities ST Loans 249 Payables 119 Others 8 Total current liabilities 376 Long-term debt 1,302 Other liabilities 91 Total Liabilities 1,918 Shareholders' equity 2,106 BVPS 1.44 Source: Company reports and J.P. Morgan estimates. 30 FY15E 407 14.0% 184 14.6% 45.1% (48) 135 (19.1%) (20) 15.0% 108 45.3% 108 45.3% 1,548 0.07 44.0% 0.09 4.6% FY16E 413 1.5% 187 1.6% 45.2% (48) 138 2.2% (21) 15.0% 110 2.2% 110 2.2% 1,561 0.07 1.3% 0.09 1.1% FY17E 422 2.2% 191 2.4% 45.2% (48) 143 3.2% (21) 15.0% 114 3.3% 114 3.3% 1,575 0.07 2.4% 0.09 2.2% FY15E 207 41 0 88 336 3,754 48 4,164 FY16E 203 41 0 88 332 3,784 41 4,184 FY17E 200 42 0 88 330 3,814 34 4,205 249 143 8 400 1,322 91 1,962 2,097 1.42 249 145 8 402 1,342 91 1,984 2,088 1.41 249 148 8 405 1,362 91 2,007 2,078 1.40 Cash flow statement S$ in millions, year end Dec EBIT Depr. & amortization Change in working capital Others Cash flow from operations FY14 160 16 (26) 88 153 FY15E 184 16 20 71 215 FY16E 187 17 1 72 200 FY17E 191 17 2 72 205 Capex Disposal/(purchase) Net Interest Free cash flow (10) 0 (40) 175 (10) 0 (48) 246 (10) 0 (48) 231 (10) 0 (48) 236 Equity raised/(repaid) Debt raised/(repaid) Other Dividends paid Beginning cash Ending cash DPU reported 148 315 (46) (120) 205 193 0.08 0 20 (51) (133) 193 207 0.09 0 20 (51) (135) 207 203 0.09 0 20 (51) (140) 203 200 0.09 Ratio Analysis S$ in millions, year end Dec EBIT Margin Net margin FY14 44.9% 20.8% FY15E 45.1% 26.5% FY16E 45.2% 26.6% FY17E 45.2% 26.9% Sales growth Net profit growth EPS growth Interest coverage (x) Net debt to total capital Net debt to equity Sales/assets (x) Assets/equity (x) ROE ROCE 12.8% 18.3% (0.1%) 4.3 38.1% 61.6% 0.1 1.8 3.5% 3.6% 14.0% 45.3% 44.0% 4.1 38.3% 62.0% 0.1 2.0 5.1% 4.3% 1.5% 2.2% 1.3% 4.2 38.7% 63.1% 0.1 2.0 5.3% 4.3% 2.2% 3.3% 2.4% 4.3 39.1% 64.2% 0.1 2.0 5.5% 4.4% Asia Pacific Equity Research 31 January 2015 Brandon Lee (65) 6882-7073 [email protected] CapitaCommercial Trust Company Data Shares O/S (mn) Market Cap (S$ mn) Market Cap ($ mn) Price (S$) Date Of Price Free Float(%) 3M - Avg daily vol (mn) 3M - Avg daily val (S$ mn) 3M - Avg daily val ($ mn) FTSTI Exchange Rate Price Target End Date 2,945 5,212 3,850 1.77 30 Jan 15 7.62 13.30 9.8 3419.05 1.35 31-Dec-15 CapitaCommercial Trust (Reuters: CACT.SI, Bloomberg: CCT SP) S$ in mn, year-end Dec FY12A FY13A FY14A Revenue (S$ mn) 376 251 263 Net property income (S$ mn) 296 197 205 Distributable Profit (S$ mn) 229 234 249 EPU (S$) 0.07 0.07 0.08 DPU (S$) 0.08 0.08 0.08 BVPU (S$) 1.66 1.71 1.75 Revenue growth (%) 4.0% (33.1%) 4.4% DPU growth (%) 7.0% 1.2% 4.0% P/E (x) 25.0 23.8 22.6 P/BV (x) 1.1 1.0 1.0 Dividend Yield 4.5% 4.6% 4.8% Gearing 29.6% 13.9% 16.4% RNAV/Share - FY15E 257 207 253 0.08 0.09 1.74 (2.3%) 1.3% 22.7 1.0 4.8% 17.1% 1.81 FY16E 252 203 273 0.08 0.09 1.73 (1.8%) 7.8% 21.1 1.0 5.2% 17.8% - Source: Company data, Bloomberg, J.P. Morgan estimates. Investment Thesis, Valuation and Risks CapitaCommercial Trust (Neutral; Price Target: S$1.75) Investment Thesis CCT is a pure-play on the broader office market. Sector fundamentals are improving, evidenced by rental growth trends and a lower-than-average supply pipeline in the next two years. Earnings have also troughed, in our view, post One George Street's income-support expiry, together with 9% of leases due for renewal/rent review this year. Valuation Our Dec-15 price target of S$1.75 is based on the average of our DDM and RNAV estimates, with DDM using a 7.6% discount rate and LT growth rate of 2.0%. Tenure adjusted RNAV is estimated @ S$2,090 psf. Risks to Rating and Price Target Key downside risks include a worse-than-expected rental reversion and management’s inability to back-fill space vacated by certain clients and remaining vacant space in CapitaGreen. Key upside risks include a rise in the pre-commitment rate of CapitaGreen from the existing 69%, better-than-expected office rent reversions, and forward-leasing of expiring office space in 2015-17. 31 Brandon Lee (65) 6882-7073 [email protected] Asia Pacific Equity Research 31 January 2015 CapitaCommercial Trust: Summary of Financials Income Statement S$ in millions, year end Dec FY14 FY15E Revenues 263 257 % change Y/Y 4.4% (2.3%) EBIT 194 195 % change Y/Y 4.8% 0.7% EBIT Margin (%) 73.9% 76.2% Net Interest (33) (28) Earnings before tax 449 230 % change Y/Y 19.8% (48.8%) Tax (0) 0 as % of EBT 0.0% 0.0% Net income (reported) 229 230 % change Y/Y 7.5% 0.6% Core net profit 229 230 % change Y/Y 7.5% 0.6% Shares outstanding 2,945 2,952 EPS (reported) (S$) 0.08 0.08 % change Y/Y 5.7% (0.6%) DPU (reported) (S$) 0.08 0.09 % change Y/Y 4.0% 1.3% Balance sheet S$ in millions, year end Dec FY14 FY15E Cash and cash equivalents 101 165 Accounts receivable 38 13 Inventories 0 0 Others 0 0 Current assets 139 178 LT investments 4,882 4,892 Net fixed assets 1 1 Total Assets 6,521 6,549 Liabilities ST Loans 270 270 Payables 47 51 Others 11 11 Total current liabilities 329 333 Long-term debt 801 851 Other liabilities 238 238 Total Liabilities 1,368 1,422 Shareholders' equity 5,153 5,128 BVPS 1.75 1.74 Source: Company reports and J.P. Morgan estimates. 32 FY16E 252 (1.8%) 196 0.1% 77.6% (28) 247 7.6% 0 0.0% 247 7.6% 247 7.6% 2,959 0.08 7.4% 0.09 7.8% FY17E 253 0.5% 197 0.5% 77.6% (28) 250 0.9% 0 0.0% 250 0.9% 250 0.9% 2,965 0.08 0.6% 0.09 0.6% FY16E 195 13 0 0 208 4,902 5 6,576 FY17E 226 13 0 0 239 4,912 9 6,603 270 50 11 332 901 238 1,471 5,105 1.73 270 51 11 332 951 238 1,521 5,082 1.71 Cash flow statement S$ in millions, year end Dec EBIT Depr. & amortization Change in working capital Others Cash flow from operations FY14 194 4 (5) (39) 189 FY15E 195 5 29 (44) 221 FY16E 196 1 (1) (62) 186 FY17E 197 1 0 (64) 188 Capex Disposal/(purchase) Net Interest Free cash flow (0) 0 221 (5) 0 243 (5) 0 209 (5) 0 210 Equity raised/(repaid) Debt raised/(repaid) Other Dividends paid Beginning cash Ending cash DPU reported (170) 220 (31) (243) 84 101 0.08 0 50 (33) (253) 101 165 0.09 0 50 (33) (273) 165 195 0.09 0 50 (33) (276) 195 226 0.09 Ratio Analysis S$ in millions, year end Dec EBIT Margin Net margin FY14 73.9% 87.1% FY15E 76.2% 89.6% FY16E 77.6% 98.2% FY17E 77.6% 98.6% Sales growth Net profit growth EPS growth Interest coverage (x) Net debt to total capital Net debt to equity Sales/assets (x) Assets/equity (x) ROE ROCE 4.4% 7.5% 5.7% 6.1 15.8% 18.8% 0.0 1.3 4.5% 3.2% (2.3%) 0.6% (0.6%) 7.3 15.7% 18.6% 0.0 1.3 4.5% 3.1% (1.8%) 7.6% 7.4% 7.1 16.0% 19.1% 0.0 1.3 4.8% 3.1% 0.5% 0.9% 0.6% 7.2 16.4% 19.6% 0.0 1.3 4.9% 3.1% Asia Pacific Equity Research 31 January 2015 Brandon Lee (65) 6882-7073 [email protected] CapitaMall Trust Company Data Shares O/S (mn) Market Cap (S$ mn) Market Cap ($ mn) Price (S$) Date Of Price Free Float(%) 3M - Avg daily vol (mn) 3M - Avg daily val (S$ mn) 3M - Avg daily val ($ mn) FTSTI Exchange Rate Price Target End Date 3,462 7,236 5,345 2.09 30 Jan 15 9.21 18.95 14.0 3419.05 1.35 31-Dec-15 CapitaMall Trust (Reuters: CMLT.SI, Bloomberg: CT SP) S$ in mn, year-end Dec FY12A FY13A FY14A Revenue (S$ mn) 662 638 659 Net property income (S$ mn) 445 439 448 Distributable Profit (S$ mn) 317 356 375 EPU (S$) 0.09 0.10 0.11 DPU (S$) 0.09 0.10 0.11 BVPU (S$) 1.65 1.74 1.81 Revenue growth (%) 4.9% (3.6%) 3.3% DPU growth (%) 1.0% 8.6% 5.6% P/E (x) 24.3 19.9 19.3 P/BV (x) 1.3 1.2 1.2 Dividend Yield 4.5% 4.9% 5.2% Gearing 36.1% 30.4% 32.1% RNAV/Share - FY15E 699 483 392 0.12 0.11 1.82 6.1% 4.3% 17.8 1.2 5.4% 32.6% 2.17 FY16E 724 501 406 0.12 0.12 1.82 3.6% 3.7% 17.0 1.1 5.6% 32.8% - Source: Company data, Bloomberg, J.P. Morgan estimates. Investment Thesis, Valuation and Risks CapitaMall Trust (Neutral; Price Target: S$2.15) Investment Thesis CT is a pure-play on domestic retail trends, with 41% of the REIT's portfolio being suburban retail malls and another 41% allocated to downtown retail. We think the outlook for the sector remains stable with five-year averaged rental reversions at 6+%. Valuation Our Dec-15 price target of S$2.15 is based on the average of our DDM and RNAV estimates, with DDM @ 6.8% discount rate and projected LT growth rate of 1.0%. Tenure adjusted RNAV is estimated @ S$1,778 psf (excl. hotels). Risks to Rating and Price Target Key risks include: 1) worse-than-expected rental reversions; 2) inability to make further investments and deploy surplus capital; and 3) prolonged challenges in retail sector, leading to tenant consolidation, declining sales turnover, rising business costs and slowing shopper traffic. 33 Brandon Lee (65) 6882-7073 [email protected] Asia Pacific Equity Research 31 January 2015 CapitaMall Trust: Summary of Financials Income Statement S$ in millions, year end Dec FY14 FY15E Revenues 659 699 % change Y/Y 3.3% 6.1% EBIT 402 442 % change Y/Y 1.5% 9.8% EBIT Margin (%) 61.0% 63.2% Net Interest (99) (107) Earnings before tax 619 406 % change Y/Y 7.7% (34.4%) Tax (0) 0 as % of EBT 0.0% 0.0% Net income (reported) 375 406 % change Y/Y 3.5% 8.3% Core net profit 375 406 % change Y/Y 3.5% 8.3% Shares outstanding 3,462 3,465 EPS (reported) (S$) 0.11 0.12 % change Y/Y 3.4% 8.2% DPU (reported) (S$) 0.11 0.11 % change Y/Y 5.6% 4.3% Balance sheet S$ in millions, year end Dec FY14 FY15E Cash and cash equivalents 1,130 1,160 Accounts receivable 25 14 Inventories 0 0 Others 0 0 Current assets 1,155 1,174 LT investments 7,510 7,510 Net fixed assets 2 6 Total Assets 9,858 9,880 Liabilities ST Loans 762 762 Payables 217 175 Others 36 36 Total current liabilities 1,016 973 Long-term debt 2,407 2,457 Other liabilities 153 153 Total Liabilities 3,576 3,583 Shareholders' equity 6,282 6,297 BVPS 1.81 1.82 Source: Company reports and J.P. Morgan estimates. 34 FY16E 724 3.6% 458 3.8% 63.3% (107) 426 4.8% 0 0.0% 426 4.8% 426 4.8% 3,468 0.12 4.7% 0.12 3.7% FY17E 742 2.4% 470 2.5% 63.4% (107) 438 3.0% 0 0.0% 438 3.0% 438 3.0% 3,471 0.13 2.9% 0.12 2.9% FY16E 1,233 14 0 0 1,248 7,510 9 9,956 FY17E 1,311 15 0 2 1,328 7,510 13 10,037 762 181 36 979 2,507 153 3,639 6,316 1.82 762 185 36 984 2,557 154 3,695 6,343 1.83 Cash flow statement S$ in millions, year end Dec EBIT Depr. & amortization Change in working capital Others Cash flow from operations FY14 402 1 6 27 409 FY15E 442 2 (32) 35 411 FY16E 458 2 6 33 466 FY17E 470 2 7 33 480 (1) (65) 507 (5) 0 514 (5) 0 568 (5) 0 582 Equity raised/(repaid) Debt raised/(repaid) Other Dividends paid Beginning cash Ending cash DPU reported 0 320 (110) (370) 830 1,130 0.11 0 50 (111) (392) 1,130 1,160 0.11 0 50 (111) (406) 1,160 1,233 0.12 0 50 (110) (419) 1,233 1,311 0.12 Ratio Analysis S$ in millions, year end Dec EBIT Margin Net margin FY14 61.0% 56.9% FY15E 63.2% 58.1% FY16E 63.3% 58.8% FY17E 63.4% 59.1% Sales growth Net profit growth EPS growth Interest coverage (x) Net debt to total capital Net debt to equity Sales/assets (x) Assets/equity (x) ROE ROCE 3.3% 3.5% 3.4% 4.1 24.5% 32.5% 0.1 1.6 6.1% 4.4% 6.1% 8.3% 8.2% 4.1 24.6% 32.7% 0.1 1.6 6.5% 4.7% 3.6% 4.8% 4.7% 4.3 24.4% 32.2% 0.1 1.6 6.7% 4.8% 2.4% 3.0% 2.9% 4.4 24.1% 31.7% 0.1 1.6 6.9% 4.9% Capex Net acquisitions Net Interest Free cash flow Asia Pacific Equity Research 31 January 2015 Brandon Lee (65) 6882-7073 [email protected] CapitaRetail China Trust Company Data Shares O/S (mn) Market Cap (S$ mn) Market Cap ($ mn) Price (S$) Date Of Price Free Float(%) 3M - Avg daily vol (mn) 3M - Avg daily val (S$ mn) 3M - Avg daily val ($ mn) FTSTI Exchange Rate Price Target End Date 828 1,420 1,049 1.72 30 Jan 15 0.88 1.42 1.0 3419.05 1.35 31-Dec-15 CapitaRetail China Trust (Reuters: CRCT.SI, Bloomberg: CRCT SP) S$ in mn, year-end Dec FY11A FY12A FY13A Revenue (S$ mn) 132 153 160 Net property income (S$ mn) 86 100 103 Distributable Profit (S$ mn) 57 67 70 EPU (S$) 0.08 0.08 0.08 DPU (S$) 0.09 0.10 0.09 BVPU (S$) 1.33 1.31 1.48 Revenue growth (%) 10.8% 15.7% 4.9% DPU growth (%) 4.1% 9.7% (5.5%) P/E (x) 22.7 21.8 22.4 P/BV (x) 1.3 1.3 1.2 Dividend Yield 5.1% 5.6% 5.3% Gearing 28.2% 28.2% 32.6% RNAV/Share - FY14A 203 132 81 0.08 0.10 1.63 27.0% 8.9% 20.5 1.1 5.7% 28.5% FY15E 214 146 88 0.10 0.11 1.62 5.2% 8.1% 17.3 1.1 6.2% 28.7% 1.72 Source: Company data, Bloomberg, J.P. Morgan estimates. Investment Thesis, Valuation and Risks CapitaRetail China Trust (Overweight; Price Target: S$1.80) Investment Thesis CRCT is a pure-play on the China retail market. The sector outlook remains stable given the portfolio's focus on non-discretionary retail malls, with five-year averaged rental reversions stable at 9%. Asset injections via the sponsor pipeline also remain another key catalyst for the stock. Valuation Our Dec-15 price target of S$1.80 is based on the average of our DDM and RNAV estimates, with DDM utilising a 9.8% discount rate and LT growth rate of 3.0%. Tenure adjusted RNAV is estimated @ RMB16,794 psm. Risks to Rating and Price Target Key upside risks to our rating and price target include management's ability to grow the portfolio and better-than-expected operating fundamentals. Key downside risks mainly stem from continued growth in the e-commerce space, leading to more consumers heading offline.Worse-than-expected tenant sales growth and worse-than-expected retail rent reversions also add to downside risks. 35 Brandon Lee (65) 6882-7073 [email protected] Asia Pacific Equity Research 31 January 2015 CapitaRetail China Trust: Summary of Financials Income Statement S$ in millions, year end Dec FY14 FY15E Revenues 203 214 % change Y/Y 27.0% 5.2% EBIT 118 133 % change Y/Y 27.0% 12.3% EBIT Margin (%) 58.2% 62.2% Net Interest (21) (21) Earnings before tax 203 112 % change Y/Y 10.3% (44.8%) Tax (57) (28) as % of EBT 28.1% 25.0% Net income (reported) 68 83 % change Y/Y 17.3% 21.0% Core net profit 68 83 % change Y/Y 17.3% 21.0% Shares outstanding 829 833 EPS (reported) (S$) 0.08 0.10 % change Y/Y 8.9% 19.0% DPU (reported) (S$) 0.10 0.11 % change Y/Y 8.9% 8.1% Balance sheet S$ in millions, year end Dec FY14 FY15E Cash and cash equivalents 87 97 Accounts receivable 11 11 Inventories Others 0 0 Current assets 98 108 LT investments 2,251 2,256 Net fixed assets 8 7 Total Assets 2,358 2,372 Liabilities ST Loans 123 123 Payables 51 53 Others 3 3 Total current liabilities 177 179 Long-term debt 549 559 Other liabilities 255 255 Total Liabilities 980 993 Shareholders' equity 1,350 1,350 BVPS 1.63 1.62 Source: Company reports and J.P. Morgan estimates. 36 FY16E 221 3.4% 138 4.0% 62.6% (21) 118 4.8% (29) 25.0% 87 4.9% 87 4.9% 836 0.10 4.4% 0.11 4.3% FY17E 226 2.4% 142 2.8% 62.8% (21) 122 3.3% (30) 25.0% 89 3.3% 89 3.3% 840 0.11 2.9% 0.11 2.8% FY16E 107 11 0 118 2,261 6 2,386 FY17E 115 11 0 127 2,266 5 2,399 123 55 3 181 569 255 1,004 1,350 1.61 123 57 3 182 579 255 1,016 1,350 1.61 Cash flow statement S$ in millions, year end Dec EBIT Depr. & amortization Change in working capital Others Cash flow from operations FY14 118 3 2 38 111 FY15E 133 2 3 28 116 FY16E 138 2 1 28 118 FY17E 142 2 1 29 121 Capex Disposal/(purchase) Net Interest Free cash flow (3) 0 1 124 (1) 0 1 130 (1) 0 1 133 (1) 0 1 135 Equity raised/(repaid) Debt raised/(repaid) Other Dividends paid Beginning cash Ending cash DPU reported 0 (44) (24) (49) 105 87 0.10 0 10 (22) (88) 87 97 0.11 0 10 (22) (93) 97 107 0.11 0 10 (22) (96) 107 115 0.11 Ratio Analysis S$ in millions, year end Dec EBIT Margin Net margin FY14 58.2% 33.6% FY15E 62.2% 38.6% FY16E 62.6% 39.1% FY17E 62.8% 39.5% Sales growth Net profit growth EPS growth Interest coverage (x) Net debt to total capital Net debt to equity Sales/assets (x) Assets/equity (x) ROE ROCE 27.0% 17.3% 8.9% 5.8 29.8% 42.5% 0.1 1.8 5.4% 4.3% 5.2% 21.0% 19.0% 6.6 29.8% 42.4% 0.1 1.8 6.1% 4.9% 3.4% 4.9% 4.4% 6.8 29.8% 42.4% 0.1 1.8 6.4% 5.1% 2.4% 3.3% 2.9% 7.0 29.8% 42.4% 0.1 1.8 6.6% 5.2% Asia Pacific Equity Research 31 January 2015 Brandon Lee (65) 6882-7073 [email protected] CDL Hospitality Trusts Company Data Shares O/S (mn) Market Cap (S$ mn) Market Cap ($ mn) Price (S$) Date Of Price Free Float(%) 3M - Avg daily vol (mn) 3M - Avg daily val (S$ mn) 3M - Avg daily val ($ mn) FTSTI Exchange Rate Price Target End Date 981 1,765 1,304 1.80 30 Jan 15 1.19 2.07 1.5 3419.05 1.35 31-Dec-15 CDL Hospitality Trusts (Reuters: CDLT.SI, Bloomberg: CDREIT SP) S$ in mn, year-end Dec FY12A FY13A FY14A Revenue (S$ mn) 150 149 167 Net property income (S$ mn) 139 137 141 Distributable Profit (S$ mn) 109 107 108 EPU (S$) 0.11 0.11 0.11 DPU (S$) 0.11 0.11 0.11 BVPU (S$) 1.61 1.63 1.65 Revenue growth (%) 6.0% (0.5%) 12.1% DPU growth (%) 2.4% (3.1%) 0.1% P/E (x) 16.2 16.9 16.8 P/BV (x) 1.1 1.1 1.1 Dividend Yield 6.3% 6.1% 6.1% Gearing 24.8% 29.6% 31.6% RNAV/Share - FY15E 164 148 112 0.11 0.11 1.64 (1.6%) 3.4% 16.2 1.1 6.3% 32.3% 1.78 FY16E 166 149 114 0.11 0.11 1.64 1.0% 0.3% 16.2 1.1 6.3% 32.7% - Source: Company data, Bloomberg, J.P. Morgan estimates. Investment Thesis, Valuation and Risks CDL Hospitality Trusts (Underweight; Price Target: S$1.70) Investment Thesis CDREIT is a hospitality REIT with 74% of portfolio exposure in Singapore hotels. Sector headwinds continue to persist arising from flat demand growth and continued supply in the mid/mass segments. Sector-wide occupied room nights in 2013 were also down 3% Y/Y. Having said that, we note that year-on-year RevPAR declines are expected to stabilize due to low base effects. Valuation Our Dec-15 price target of S$1.70 is based on the average of our DDM and RNAV estimates, with DDM using a 9.2% discount rate and LT growth rate of 1.5%. Tenure adjusted RNAV is estimated @ S$504,856 per key. Risks to Rating and Price Target Key upside risks stem from better-than-expected visitor arrivals and therefore room rate growth, improvement in global macroeconomic environment, which leads to higher corporate budgets as well as an unexpected increase in the dividend payout ratio. We also highlight the high sensitivity to any forecast errors in RevPAR and business cyclicality given the high operating leverage. Currency fluctuation also adds on to downside risk. 37 Asia Pacific Equity Research 31 January 2015 Brandon Lee (65) 6882-7073 [email protected] CDL Hospitality Trusts: Summary of Financials Income Statement S$ in millions, year end Dec Revenues % change Y/Y EBIT % change Y/Y EBIT Margin (%) Net Interest Earnings before tax % change Y/Y Tax as % of EBT Net income (reported) % change Y/Y Distributable Income % change Y/Y Shares outstanding EPS (reported) (S$) % change Y/Y DPU (reported) (S$) % change Y/Y Balance sheet S$ in millions, year end Dec Cash and cash equivalents Accounts receivable Inventories Others Current assets LT investments Net fixed assets Total Assets FY14 167 12.1% 123 (0.3%) 73.5% (16) 124 (13.3%) (1) 1.2% 105 1.1% 108 0.8% 982 0.11 0.4% 0.11 0.1% FY15E 164 (1.6%) 133 8.6% 81.1% (19) 114 (7.9%) (5) 4.2% 109 4.3% 112 4.5% 990 0.11 3.5% 0.11 3.4% FY16E 166 1.0% 135 1.0% 81.1% (19) 115 1.1% (5) 4.2% 110 1.0% 114 1.1% 997 0.11 0.3% 0.11 0.3% FY17E 171 2.9% 139 3.0% 81.1% (19) 119 3.5% (5) 4.2% 114 3.5% 117 3.3% 1,005 0.11 2.7% 0.12 2.6% FY14 76 20 1 98 FY15E 87 16 1 105 FY16E 110 17 1 128 FY17E 132 17 1 151 2,206 145 2,450 2,206 150 2,462 2,206 155 2,490 Liabilities ST Loans 317 Payables 40 Others 1 Total current liabilities 358 Long-term debt 458 Other liabilities 19 Total Liabilities 834 Shareholders' equity 1,616 BVPS 1.65 Source: Company reports and J.P. Morgan estimates. 38 317 25 1 343 478 19 839 1,623 1.64 317 25 1 343 498 19 859 1,631 1.64 Cash flow statement S$ in millions, year end Dec EBIT Depr. & amortization Change in working capital Others Cash flow from operations Capex Net acquisitions Net Interest Free cash flow Equity raised/(repaid) Debt raised/(repaid) Other Dividends paid Beginning cash Ending cash DPU reported Ratio Analysis S$ in millions, year end Dec EBIT Margin Net margin Sales growth Net profit growth 2,206 EBIT growth 160 EPS growth 2,518 Interest coverage (x) Net debt to total capital 317 Net debt to equity 26 Sales/assets (x) 1 Assets/equity (x) 344 ROE 518 ROCE 19 880 1,638 1.63 FY14 123 0 4 31 139 FY15E 133 0 (11) 29 127 FY16E 135 0 0 30 140 FY17E 139 0 0 30 144 (66) (27) (16) 90 (5) 0 (19) 141 (5) 0 (19) 153 (5) 0 (19) 158 0 84 (18) (106) 69 76 0.11 0 20 (20) (112) 76 87 0.11 0 20 (20) (114) 87 110 0.11 0 20 (20) (117) 110 132 0.12 FY14 73.5% 62.8% FY15E 81.1% 66.6% FY16E 81.1% 66.6% FY17E 81.1% 66.9% 12.1% 1.1% (0.3%) 0.4% (1.6%) 4.3% 8.6% 3.5% 1.0% 1.0% 1.0% 0.3% 2.9% 3.5% 3.0% 2.7% 7.6 30.2% 43.2% 0.1 1.5 6.5% 5.2% 7.0 30.4% 43.6% 0.1 1.5 6.8% 5.3% 7.0 30.2% 43.2% 0.1 1.5 6.8% 5.3% 7.2 30.0% 42.9% 0.1 1.5 7.0% 5.4% Asia Pacific Equity Research 31 January 2015 Brandon Lee (65) 6882-7073 [email protected] Far East Hospitality Trust Company Data Shares O/S (mn) Market Cap (S$ mn) Market Cap ($ mn) Price (S$) Date Of Price Free Float(%) 3M - Avg daily vol (mn) 3M - Avg daily val (S$ mn) 3M - Avg daily val ($ mn) FTSTI Exchange Rate Price Target End Date Price Target (S$) 1,775 1,500 1,108 0.85 30 Jan 15 0.41 0.34 0.2 3419.05 1.35 31-Dec-15 0.80 Far East Hospitality Trust (Reuters: FAEH.SI, Bloomberg: FEHT SP) S$ in mn, year-end Dec FY12A FY13A FY14E Revenue (S$ mn) 42 122 129 Distributable Profit (S$ mn) 34 95 97 EPU (S$) 0.01 0.05 0.05 DPU (S$) 0.02 0.06 0.05 BVPU (S$) 0.97 0.98 0.98 Revenue growth (%) 190.1% 5.2% DPU growth (%) 169.9% (3.6%) P/E (x) 75.0 16.7 17.3 P/BV (x) 0.9 0.9 0.9 Dividend Yield 2.5% 6.7% 6.4% Gearing 29.2% 30.8% 30.9% RNAV/Share Net property income (S$ mn) 39 112 117 FY15E 128 93 0.05 0.05 0.97 (0.7%) (4.8%) 18.3 0.9 6.1% 31.0% 0.89 116 FY16E 132 96 0.05 0.05 0.96 3.0% 3.5% 17.6 0.9 6.3% 31.2% 120 Source: Company data, Bloomberg, J.P. Morgan estimates. Investment Thesis, Valuation and Risks Far East Hospitality Trust (Underweight; Price Target: S$0.80) Investment Thesis FEHT is a pure-play domestic hospitality REIT with 73% of GAV exposure in Singapore hotels and 16% in serviced residences. We believe sector fundamentals remain challenging from flat demand growth and continued supply in the midrange/mass hotel segments. Sectorwide occupied room nights in 2013 were down 3% Y/Y. Having said that, YoY RevPAR declines are expected to stabilize due to low base effects. Valuation Our Dec-15 PT of S$0.80 is based on the average of our DDM and RNAV valuation estimates, with DDM using a 9.8% discount rate and LTGR of 1.5%. Tenureadjusted RNAV is estimated at S$716,708 per key. Risks to Rating and Price Target Key upside risks to our rating and PT stem from better-than-expected visitor arrivals and therefore better growth in room rates. FEHT has high sensitivity to forecast errors in RevPAR, such that a 5% change in RevPAR would translate into a 7% change in our DPU estimates. 39 Brandon Lee (65) 6882-7073 [email protected] Asia Pacific Equity Research 31 January 2015 Far East Hospitality Trust: Summary of Financials Income Statement S$ in millions, year end Dec FY13 FY14E Revenues 122 129 % change Y/Y 190.1% 5.2% EBIT 100 104 % change Y/Y 349.4% 4.1% EBIT Margin (%) 81.3% 80.4% Net Interest (15) (17) Earnings before tax 138 86 % change Y/Y 98.7% (37.4%) Tax 0 0 as % of EBT 0.0% 0.0% Net income (reported) 84 86 % change Y/Y 366.8% 2.4% Core net profit 84 86 % change Y/Y 366.8% 2.4% Shares outstanding 1,765 1,777 EPS (reported) (S$) 0.05 0.05 % change Y/Y 348.0% (3.3%) DPU (reported) (S$) 0.06 0.05 % change Y/Y 169.9% (3.6%) Balance sheet S$ in millions, year end Dec FY13 FY14E Cash and cash equivalents 29 37 Accounts receivable 22 19 Inventories 0 0 Others 6 6 Current assets 57 63 LT investments 2,475 2,475 Net fixed assets 0 1 Total Assets 2,532 2,538 Liabilities ST Loans 0 0 Payables 4 6 Others 5 5 Total current liabilities 9 11 Long-term debt 779 784 Other liabilities 8 8 Total Liabilities 797 804 Shareholders' equity 1,735 1,735 BVPS 0.98 0.98 Source: Company reports and J.P. Morgan estimates. 40 FY15E 128 (0.7%) 103 (0.5%) 80.6% (21) 82 (4.6%) 0 0.0% 82 (4.6%) 82 (4.6%) 1,789 0.05 (5.3%) 0.05 (4.8%) FY16E 132 3.0% 107 3.7% 81.1% (21) 86 4.6% 0 0.0% 86 4.6% 86 4.6% 1,801 0.05 3.9% 0.05 3.5% FY15E 41 19 0 6 66 2,475 2 2,543 FY16E 44 20 0 6 70 2,475 3 2,548 0 6 5 11 789 8 809 1,734 0.97 0 7 5 11 794 8 814 1,734 0.96 Cash flow statement S$ in millions, year end Dec EBIT Depr. & amortization Change in working capital Others Cash flow from operations FY13 100 0 2 24 111 FY14E 104 0 5 27 118 FY15E 103 0 0 30 113 FY16E 107 0 (0) 30 116 Capex Disposal/(purchase) Net Interest Free cash flow 0 126 (1) 134 (1) 132 (1) 136 Equity raised/(repaid) Debt raised/(repaid) Other Dividends paid Beginning cash Ending cash DPU reported 68 132 (14) (103) 36 29 0.06 0 0 (12) (97) 29 37 0.05 0 0 (16) (93) 37 41 0.05 0 0 (16) (96) 41 44 0.05 FY13 81.3% 68.9% FY14E 80.4% 67.1% FY15E 80.6% 64.4% FY16E 81.1% 65.4% 190.1% 366.8% 348.0% 6.6 30.2% 43.2% 0.1 1.4 5.1% 4.2% 5.2% 2.4% (3.3%) 6.0 30.1% 43.1% 0.1 1.5 5.0% 4.1% (0.7%) (4.6%) (5.3%) 5.0 30.2% 43.2% 0.1 1.5 4.8% 4.1% 3.0% 4.6% 3.9% 5.2 30.2% 43.3% 0.1 1.5 5.0% 4.2% Ratio Analysis S$ in millions, year end Dec EBIT Margin Net margin Sales growth Net profit growth EPS growth Interest coverage (x) Net debt to total capital Net debt to equity Sales/assets (x) Assets/equity (x) ROE ROCE Asia Pacific Equity Research 31 January 2015 Brandon Lee (65) 6882-7073 [email protected] Frasers Centrepoint Trust Company Data Shares O/S (mn) Market Cap (S$ mn) Market Cap ($ mn) Price (S$) Date Of Price Free Float(%) 3M - Avg daily vol (mn) 3M - Avg daily val (S$ mn) 3M - Avg daily val ($ mn) FTSTI Exchange Rate Price Target End Date Price Target (S$) 916 1,896 1,400 2.07 30 Jan 15 1.13 2.18 1.6 3419.05 1.35 31-Dec-15 1.85 Frasers Centrepoint Trust (Reuters: FCRT.SI, Bloomberg: FCT SP) S$ in mn, year-end Sep FY13A FY14A FY15E Revenue (S$ mn) 158 169 188 Distributable Profit (S$ mn) 90 95 106 EPU (S$) 0.10 0.11 0.11 DPU (S$) 0.11 0.11 0.12 BVPU (S$) 1.77 1.85 1.85 Revenue growth (%) 7.3% 6.8% 11.6% DPU growth (%) 9.3% 2.4% 3.7% P/E (x) 19.9 19.6 18.3 P/BV (x) 1.2 1.1 1.1 Dividend Yield 5.3% 5.4% 5.6% Gearing 27.6% 29.3% 29.2% RNAV/Share 1.87 Net property income (S$ mn) 112 118 133 FY16E 190 108 0.11 0.12 1.85 1.0% 1.1% 18.1 1.1 5.7% 29.2% 134 FY17E 191 108 0.11 0.12 1.84 0.1% 0.3% 18.1 1.1 5.7% 29.2% 135 Source: Company data, Bloomberg, J.P. Morgan estimates. Investment Thesis, Valuation and Risks Frasers Centrepoint Trust (Underweight; Price Target: S$1.85) Investment Thesis FCT is a pure-play on domestic non-discretionary retail trends, with the portfolio comprising suburban retail malls. While rental reversions in FY13 were strong at 9% post the completion of Causeway Point AEI, they are expected to moderate as the asset stabilizes. One key catalyst could potentially be from the injection of Changi City Point. Valuation Our Dec-15 price target of S$1.85 is based on the average of our DDM and RNAV estimates, with DDM using an 8.0% discount rate and a LT growth rate of 1.5%. Tenure-adjusted RNAV is estimated @ S$2,152 psf. Risks to Rating and Price Target Key upside risks to our rating and price target include better-than expected rental reversions. Key downside risks include prolonged challenges in the retail sector, leading to tenant consolidation, declining sales turnover, rising business costs and slowing shopper traffic. 41 Asia Pacific Equity Research 31 January 2015 Brandon Lee (65) 6882-7073 [email protected] Frasers Centrepoint Trust: Summary of Financials Income Statement S$ in millions, year end Sep Revenues % change Y/Y EBIT % change Y/Y EBIT Margin (%) Net Interest Earnings before tax % change Y/Y Tax as % of EBT Net income (reported) % change Y/Y Distributable Income % change Y/Y Shares outstanding EPS (reported) (S$) % change Y/Y DPU (reported) (S$) % change Y/Y Balance sheet S$ in millions, year end Sep Cash and cash equivalents Accounts receivable Inventories Others Current assets LT investments Net fixed assets Total Assets FY14 169 6.8% 104 5.0% 61.4% (18) 165 (42.6%) 0 0.0% 90 5.1% 95 5.9% 916 0.11 1.2% 0.11 2.4% FY15E 188 11.6% 117 13.0% 62.1% (18) 104 (37.2%) 0 0.0% 104 15.0% 106 11.6% 918 0.11 7.3% 0.12 3.7% FY16E 190 1.0% 118 1.1% 62.2% (18) 105 1.3% 0 0.0% 105 1.3% 108 1.3% 919 0.11 1.1% 0.12 1.1% FY17E 191 0.1% 119 0.1% 62.2% (18) 105 0.2% 0 0.0% 105 0.2% 108 0.5% 921 0.11 (0.0%) 0.12 0.3% FY14 42 5 0 0 47 FY15E 43 4 0 0 47 FY16E 36 4 0 0 40 FY17E 29 4 0 0 33 2,400 0 2,522 2,405 2 2,529 2,410 4 2,529 Liabilities ST Loans 95 Payables 40 Others 18 Total current liabilities 153 Long-term debt 644 Other liabilities 26 Total Liabilities 823 Shareholders' equity 1,699 BVPS 1.85 Source: Company reports and J.P. Morgan estimates. 42 95 47 18 160 644 26 830 1,699 1.85 95 48 18 161 644 26 831 1,699 1.85 Cash flow statement S$ in millions, year end Sep EBIT Depr. & amortization Change in working capital Others Cash flow from operations FY14 104 0 (6) 16 100 FY15E 117 0 9 16 129 FY16E 118 0 0 16 122 FY17E 119 0 0 16 121 Capex Net acquisitions Net Interest Free cash flow (0) (300) 119 (2) (5) 145 (2) (5) 138 (2) (5) 138 161 150 (20) (94) 40 42 0.11 0 0 (18) (106) 42 43 0.12 0 0 (18) (108) 43 36 0.12 0 0 (18) (108) 36 29 0.12 FY14 61.4% 53.4% FY15E 62.1% 55.1% FY16E 62.2% 55.2% FY17E 62.2% 55.2% 6.8% 5.1% 5.0% 1.2% 11.6% 15.0% 13.0% 7.3% 1.0% 1.3% 1.1% 1.1% 0.1% 0.2% 0.1% (0.0%) 5.6 29.1% 41.0% 0.1 1.5 5.7% 4.6% 6.4 29.1% 41.0% 0.1 1.5 6.1% 4.8% 6.5 29.3% 41.4% 0.1 1.5 6.2% 4.9% 6.5 29.5% 41.8% 0.1 1.5 6.2% 4.9% Equity raised/(repaid) Debt raised/(repaid) Other Dividends paid Beginning cash Ending cash DPU reported Ratio Analysis S$ in millions, year end Sep EBIT Margin Net margin Sales growth Net profit growth 2,415 EBIT growth 6 EPS growth 2,529 Interest coverage (x) Net debt to total capital 95 Net debt to equity 48 Sales/assets (x) 18 Assets/equity (x) 161 ROE 644 ROCE 26 831 1,698 1.84 Asia Pacific Equity Research 31 January 2015 Brandon Lee (65) 6882-7073 [email protected] Keppel REIT Company Data Shares O/S (mn) Market Cap (S$ mn) Market Cap ($ mn) Price (S$) Date Of Price Free Float(%) 3M - Avg daily vol (mn) 3M - Avg daily val (S$ mn) 3M - Avg daily val ($ mn) FTSTI Exchange Rate Price Target End Date Price Target (S$) 3,170 3,915 2,892 1.24 30 Jan 15 4.73 5.77 4.3 3419.05 1.35 31-Dec-15 1.25 Keppel REIT (Reuters: KASA.SI, Bloomberg: KREIT SP) S$ in mn, year-end Dec FY13A FY14A Revenue (S$ mn) 174 184 Distributable Profit (S$ mn) 214 206 EPU (S$) 0.05 0.05 DPU (S$) 0.08 0.07 BVPU (S$) 1.40 1.41 Revenue growth (%) 10.9% 5.8% DPU growth (%) 1.4% (8.2%) P/E (x) 23.0 24.0 P/BV (x) 0.9 0.9 Dividend Yield 6.4% 5.9% Gearing 39.6% 36.4% RNAV/Share Net property income (S$ mn) 138 151 FY15E 178 227 0.04 0.07 1.37 (3.3%) (2.0%) 29.0 0.9 5.7% 36.8% 1.34 140 FY16E 184 227 0.04 0.07 1.34 3.2% (0.5%) 27.7 0.9 5.7% 37.1% 144 FY17E 188 223 0.05 0.07 1.31 2.4% (2.8%) 26.7 0.9 5.5% 37.4% 150 Source: Company data, Bloomberg, J.P. Morgan estimates. Investment Thesis, Valuation and Risks Keppel REIT (Neutral; Price Target: S$1.25) Investment Thesis K-REIT is a Singapore-listed office REIT with one of the best office portfolios for Singapore and some exposure to the Australia prime office sector. Sector fundamentals for KREIT are improving, as evidenced by rental growth trends and a lower-than average supply pipeline in the next two years. However, 28% of FY14 income contributions are from income support arrangements, which have factored in rental growth expectations. Valuation Our Dec-15 PT of S$1.25 is based on the average of our DDM and RNAV valuation estimates, with DDM using an 8.0% discount rate and a long-term growth rate of 2.0%. Tenure-adjusted RNAV is estimated at S$2,269 psf. Risks to Rating and Price Target Key upside risks to our rating and price target stem mainly from better-than-expected office rent reversions, resulting in actual rent closing the gap between incomesupported rent; the forward-leasing of expiring office space in 2015-17; and AUD appreciation. Key downside risks include an unexpected worsening in office rent reversions and AUD depreciation. 43 Brandon Lee (65) 6882-7073 [email protected] Asia Pacific Equity Research 31 January 2015 Keppel REIT: Summary of Financials Income Statement S$ in millions, year end Dec FY14 FY15E Revenues 184 178 % change Y/Y 5.8% (3.3%) EBIT 111 92 % change Y/Y (4.6%) (17.6%) EBIT Margin (%) 60.4% 51.4% Net Interest (23) (30) Earnings before tax 384 143 % change Y/Y (30.5%) (62.7%) Tax (12) (7) as % of EBT 3.0% 5.1% Net income (reported) 147 136 % change Y/Y 1.2% (7.9%) Core net profit 147 136 % change Y/Y 1.2% (7.9%) Shares outstanding 3,170 3,199 EPS (reported) (S$) 0.05 0.04 % change Y/Y (3.9%) (17.3%) DPU (reported) (S$) 0.07 0.07 % change Y/Y (8.2%) (2.0%) Balance sheet S$ in millions, year end Dec FY14 FY15E Cash and cash equivalents 200 182 Accounts receivable 25 27 Inventories 0 0 Others 1 1 Current assets 225 209 LT investments 3,614 3,604 Net fixed assets 0 0 Total Assets 7,329 7,252 Liabilities ST Loans 275 275 Payables 84 82 Others 21 21 Total current liabilities 380 378 Long-term debt 2,390 2,390 Other liabilities 99 99 Total Liabilities 2,870 2,867 Shareholders' equity 4,459 4,385 BVPS 1.41 1.37 Source: Company reports and J.P. Morgan estimates. 44 FY16E 184 3.2% 95 3.8% 51.7% (36) 148 3.7% (5) 3.4% 143 5.6% 143 5.6% 3,228 0.04 4.7% 0.07 (0.5%) FY17E 188 2.4% 100 5.5% 53.3% (36) 155 4.4% (5) 3.0% 150 4.9% 150 4.9% 3,258 0.05 3.9% 0.07 (2.8%) FY16E 163 28 0 1 192 3,594 0 7,186 FY17E 154 28 0 1 183 3,584 0 7,131 275 85 21 380 2,390 99 2,870 4,316 1.34 275 87 21 382 2,390 99 2,872 4,259 1.31 Cash flow statement S$ in millions, year end Dec EBIT Depr. & amortization Change in working capital Others Cash flow from operations FY14 111 0 (74) (31) 43 FY15E 92 0 (4) (17) 114 FY16E 95 0 2 (18) 127 FY17E 100 0 1 (19) 132 (0) 26 (23) 64 0 (10) (30) 143 0 (10) (36) 162 0 (10) (36) 167 228 (20) (61) (215) 91 200 0.07 0 0 (58) (227) 200 182 0.07 0 0 (58) (227) 182 163 0.07 0 0 (58) (223) 163 154 0.07 Ratio Analysis S$ in millions, year end Dec EBIT Margin Net margin FY14 60.4% 80.0% FY15E 51.4% 76.2% FY16E 51.7% 78.0% FY17E 53.3% 79.8% Sales growth Net profit growth EPS growth Interest coverage (x) Net debt to total capital Net debt to equity Sales/assets (x) Assets/equity (x) ROE ROCE 5.8% 1.2% (3.9%) 4.9 35.6% 55.3% 0.0 1.7 3.5% 1.6% (3.3%) (7.9%) (17.3%) 3.0 36.2% 56.6% 0.0 1.6 3.1% 1.2% 3.2% 5.6% 4.7% 2.7 36.7% 58.0% 0.0 1.7 3.3% 1.3% 2.4% 4.9% 3.9% 2.8 37.1% 59.0% 0.0 1.7 3.5% 1.4% Capex Net acquisitions Net Interest Free cash flow Equity raised/(repaid) Debt raised/(repaid) Other Dividends paid Beginning cash Ending cash DPU reported Asia Pacific Equity Research 31 January 2015 Brandon Lee (65) 6882-7073 [email protected] Mapletree Commercial Trust Company Data Shares O/S (mn) Market Cap (S$ mn) Market Cap ($ mn) Price (S$) Date Of Price Free Float(%) 3M - Avg daily vol (mn) 3M - Avg daily val (S$ mn) 3M - Avg daily val ($ mn) FTSTI Exchange Rate Price Target End Date Price Target (S$) 2,104 3,187 2,354 1.52 30 Jan 15 2.05 2.97 2.2 3419.05 1.35 31-Dec-15 1.40 Mapletree Commercial Trust (Reuters: MACT.SI, Bloomberg: MCT SP) S$ in mn, year-end Mar FY13A FY14A FY15E FY16E Revenue (S$ mn) 219 267 284 295 Distributable Profit (S$ mn) 124 153 164 167 EPU (S$) 0.06 0.07 0.07 0.07 DPU (S$) 0.06 0.07 0.08 0.08 BVPU (S$) 1.06 1.16 1.16 1.16 Revenue growth (%) 23.8% 21.7% 6.3% 3.7% DPU growth (%) 23.2% 13.7% 6.6% 1.1% P/E (x) 25.3 22.2 20.5 20.3 P/BV (x) 1.4 1.3 1.3 1.3 Dividend Yield 4.3% 4.9% 5.2% 5.2% Gearing 40.8% 38.6% 38.4% 38.4% RNAV/Share 1.34 Net property income (S$ mn) 156 195 211 212 FY17E 304 173 0.08 0.08 1.15 3.2% 3.6% 19.5 1.3 5.4% 38.3% 219 Source: Company data, Bloomberg, J.P. Morgan estimates. Investment Thesis, Valuation and Risks Mapletree Commercial Trust (Underweight; Price Target: S$1.40) Investment Thesis MCT is predominantly a retail play, with the VivoCity mall expected to drive 70% of portfolio NPI growth in the next three years. We believe near-term DPU growth will continue to be organically driven, with VivoCity's rental reversions expected to remain stable. Valuation Our Dec-15 price target of S$1.40 is based on the average of our DDM and RNAV estimates, with DDM using a 7.1% discount rate and a long-term growth rate of 1.5%. Tenure-adjusted RNAV is estimated at S$2,044 psf. Risks to Rating and Price Target Key downside risks include 1) prolonged challenges in retail sector, leading to tenant consolidation, declining sales turnover, rising business costs and slowing shopper traffic 2) worse-than-expected retail rent reversions. 45 Brandon Lee (65) 6882-7073 [email protected] Asia Pacific Equity Research 31 January 2015 Mapletree Commercial Trust: Summary of Financials Income Statement S$ in millions, year end Mar FY14 FY15E Revenues 267 284 % change Y/Y 21.7% 6.3% EBIT 176 190 % change Y/Y 25.7% 8.1% EBIT Margin (%) 65.8% 66.9% Net Interest (35) (36) Earnings before tax 343 154 % change Y/Y 10.4% (55.1%) Tax 0 0 as % of EBT 0.0% 0.0% Net income (reported) 141 154 % change Y/Y 24.0% 9.1% Core net profit 141 154 % change Y/Y 24.0% 9.1% Shares outstanding 2,083 2,090 EPS (reported) (S$) 0.07 0.07 % change Y/Y 13.7% 8.4% DPU (reported) (S$) 0.07 0.08 % change Y/Y 13.7% 6.6% Balance sheet S$ in millions, year end Mar FY14 FY15E Cash and cash equivalents 70 86 Accounts receivable 4 9 Inventories Others 1 1 Current assets 75 95 LT investments 4,034 4,039 Net fixed assets 0 0 Total Assets 4,110 4,135 Liabilities ST Loans 339 339 Payables 54 71 Others 8 8 Total current liabilities 400 418 Long-term debt 1,249 1,249 Other liabilities 35 43 Total Liabilities 1,684 1,710 Shareholders' equity 2,426 2,425 BVPS 1.16 1.16 Source: Company reports and J.P. Morgan estimates. 46 FY16E 295 3.7% 192 0.8% 65.0% (35) 156 1.5% 0 0.0% 156 1.5% 156 1.5% 2,097 0.07 1.1% 0.08 1.1% FY17E 304 3.2% 198 3.4% 65.1% (35) 163 4.1% 0 0.0% 163 4.1% 163 4.1% 2,104 0.08 3.8% 0.08 3.6% FY16E 84 9 1 93 4,044 0 4,138 FY17E 82 9 1 91 4,049 0 4,141 339 74 8 420 1,249 45 1,714 2,424 1.16 339 76 8 423 1,249 46 1,718 2,423 1.15 Cash flow statement S$ in millions, year end Mar EBIT Depr. & amortization Change in working capital Others Cash flow from operations FY14 176 0 3 44 189 FY15E 190 0 21 45 221 FY16E 192 0 4 44 205 FY17E 198 0 3 45 211 (0) (4) 0 223 0 (5) 0 257 0 (5) 1 240 0 (5) 1 246 0 0 (35) (126) 47 70 0.07 0 0 (36) (164) 70 86 0.08 0 0 (36) (167) 86 84 0.08 0 0 (36) (173) 84 82 0.08 Ratio Analysis S$ in millions, year end Mar EBIT Margin Net margin FY14 65.8% 52.9% FY15E 66.9% 54.3% FY16E 65.0% 53.1% FY17E 65.1% 53.6% Sales growth Net profit growth EPS growth Interest coverage (x) Net debt to total capital Net debt to equity Sales/assets (x) Assets/equity (x) ROE ROCE 21.7% 24.0% 13.7% 5.1 38.5% 62.5% 0.1 1.7 6.1% 4.5% 6.3% 9.1% 8.4% 5.3 38.2% 61.9% 0.1 1.7 6.4% 4.7% 3.7% 1.5% 1.1% 5.4 38.3% 62.0% 0.1 1.7 6.5% 4.8% 3.2% 4.1% 3.8% 5.6 38.3% 62.1% 0.1 1.7 6.7% 4.9% Capex Net acquisitions Net Interest Free cash flow Equity raised/(repaid) Debt raised/(repaid) Other Dividends paid Beginning cash Ending cash DPU reported Asia Pacific Equity Research 31 January 2015 Brandon Lee (65) 6882-7073 [email protected] Mapletree Industrial Trust Company Data Shares O/S (mn) Market Cap (S$ mn) Market Cap ($ mn) Price (S$) Date Of Price Free Float(%) 3M - Avg daily vol (mn) 3M - Avg daily val (S$ mn) 3M - Avg daily val ($ mn) FTSTI Exchange Rate Price Target End Date Price Target (S$) 1,732 2,650 1,958 1.53 30 Jan 15 2.39 3.57 2.6 3419.05 1.35 31-Dec-15 1.55 Mapletree Industrial Trust (Reuters: MAPI.SI, Bloomberg: MINT SP) S$ in mn, year-end Mar FY13A FY14A FY15E Revenue (S$ mn) 276 299 319 Distributable Profit (S$ mn) 151 166 174 EPU (S$) 0.09 0.10 0.10 DPU (S$) 0.09 0.10 0.10 BVPU (S$) 1.10 1.20 1.20 Revenue growth (%) 12.2% 8.3% 6.5% DPU growth (%) 10.0% 7.9% 2.9% P/E (x) 17.3 15.6 15.1 P/BV (x) 1.4 1.3 1.3 Dividend Yield 6.1% 6.5% 6.7% Gearing 34.8% 34.4% 35.1% RNAV/Share 1.47 Net property income (S$ mn) 195 215 227 FY16E 328 178 0.10 0.11 1.20 2.9% 2.2% 14.8 1.3 6.9% 37.0% 234 FY17E 334 180 0.10 0.11 1.20 2.0% 1.2% 14.6 1.3 6.9% 38.6% 239 Source: Company data, Bloomberg, J.P. Morgan estimates. Investment Thesis, Valuation and Risks Mapletree Industrial Trust (Neutral; Price Target: S$1.55) Investment Thesis MINT is a pure-play on Singapore industrial real-estate, with primary exposure to flatted factory assets (48% of portfolio). While sector fundamentals for MINT remain stable, we note that portfolio occupancy/retention levels have seen fluctuations due to tenant turnover in recent quarters. We also note that MINT's tenant base remains more fragmented against some of its listed peers. Valuation Our Dec-15 price target of S$1.55 is based on the average of our DDM and RNAV estimates, with DDM using a 8.5% discount rate and LT growth rate of 1.0%. RNAV is estimated @ S$244 psf. Risks to Rating and Price Target Key upside risks to our rating and price target mainly stem from better-than-expected rent reversions, a pick-up in occupancy of business parks and announcements of more AEIs. Key downside risks to our rating and price target include an unexpected deterioration in operating fundamentals or rent reductions in order to fill up vacant space and rising competition from strata-titled factories. 47 Brandon Lee (65) 6882-7073 [email protected] Asia Pacific Equity Research 31 January 2015 Mapletree Industrial Trust: Summary of Financials Income Statement S$ in millions, year end Mar FY14 FY15E Revenues 299 319 % change Y/Y 8.3% 6.5% EBIT 189 200 % change Y/Y 9.8% 5.7% EBIT Margin (%) 63.2% 62.8% Net Interest (26) (29) Earnings before tax 314 171 % change Y/Y 12.1% (45.5%) Tax (0) 0 as % of EBT 0.0% 0.0% Net income (reported) 164 171 % change Y/Y 13.3% 4.7% Core net profit 164 171 % change Y/Y 13.3% 4.7% Shares outstanding 1,690 1,692 EPS (reported) (S$) 0.10 0.10 % change Y/Y 11.1% 2.9% DPU (reported) (S$) 0.10 0.10 % change Y/Y 7.9% 2.9% Balance sheet S$ in millions, year end Mar FY14 FY15E Cash and cash equivalents 96 8 Accounts receivable 5 6 Inventories 0 0 Others 4 4 Current assets 105 19 LT investments 3,170 3,280 Net fixed assets 0 1 Total Assets 3,275 3,300 Liabilities ST Loans 344 344 Payables 68 64 Others 1 1 Total current liabilities 413 408 Long-term debt 784 814 Other liabilities 50 50 Total Liabilities 1,246 1,272 Shareholders' equity 2,029 2,028 BVPS 1.20 1.20 Source: Company reports and J.P. Morgan estimates. 48 FY16E 328 2.9% 206 2.9% 62.8% (31) 175 2.3% 0 0.0% 175 2.3% 175 2.3% 1,693 0.10 2.2% 0.11 2.2% FY17E 334 2.0% 210 2.0% 62.8% (33) 177 1.3% 0 0.0% 177 1.3% 177 1.3% 1,695 0.10 1.2% 0.11 1.2% FY16E 9 7 0 4 19 3,380 2 3,401 FY17E 11 7 0 4 21 3,468 3 3,492 344 66 1 410 914 50 1,374 2,027 1.20 344 67 1 412 1,004 50 1,465 2,027 1.20 Cash flow statement S$ in millions, year end Mar EBIT Depr. & amortization Change in working capital Others Cash flow from operations FY14 189 0 3 23 190 FY15E 200 0 (5) 31 197 FY16E 206 0 2 33 210 FY17E 210 0 1 35 213 Capex Net acquisitions Net Interest Free cash flow 0 (138) 0 215 (1) (111) 0 225 (1) (100) 0 240 (1) (88) 0 245 0 94 (25) (97) 72 96 0.10 0 30 (29) (174) 96 8 0.10 0 100 (31) (178) 8 9 0.11 0 90 (33) (180) 9 11 0.11 Ratio Analysis S$ in millions, year end Mar EBIT Margin Net margin FY14 63.2% 54.6% FY15E 62.8% 53.7% FY16E 62.8% 53.4% FY17E 62.8% 53.0% Sales growth Net profit growth EPS growth Interest coverage (x) Net debt to total capital Net debt to equity Sales/assets (x) Assets/equity (x) ROE ROCE 8.3% 13.3% 11.1% 7.4 33.7% 50.9% 0.1 1.6 8.5% 6.3% 6.5% 4.7% 2.9% 6.9 36.2% 56.7% 0.1 1.6 8.4% 6.3% 2.9% 2.3% 2.2% 6.7 38.1% 61.6% 0.1 1.7 8.6% 6.4% 2.0% 1.3% 1.2% 6.4 39.7% 66.0% 0.1 1.7 8.8% 6.3% Equity raised/(repaid) Debt raised/(repaid) Other Dividends paid Beginning cash Ending cash DPU reported Asia Pacific Equity Research 31 January 2015 Brandon Lee (65) 6882-7073 [email protected] Suntec REIT Company Data Shares O/S (mn) Market Cap (S$ mn) Market Cap ($ mn) Price (S$) Date Of Price Free Float(%) 3M - Avg daily vol (mn) 3M - Avg daily val (S$ mn) 3M - Avg daily val ($ mn) FTSTI Exchange Rate Price Target End Date Price Target (S$) 2,502 4,704 3,475 1.88 30 Jan 15 12.13 23.27 17.2 3419.05 1.35 31-Dec-15 2.10 Suntec REIT (Reuters: SUNT.SI, Bloomberg: SUN SP) S$ in mn, year-end Dec FY12A FY13A Revenue (S$ mn) 262 234 Distributable Profit (S$ mn) 213 211 EPU (S$) 0.07 0.05 DPU (S$) 0.09 0.09 BVPU (S$) 2.12 2.20 Revenue growth (%) (3.1%) (10.6%) DPU growth (%) (4.5%) (1.7%) P/E (x) 28.8 41.3 P/BV (x) 0.9 0.9 Dividend Yield 5.0% 5.0% Gearing 36.7% 38.0% RNAV/Share Net property income (S$ mn) 163 149 FY14A 282 230 0.09 0.09 2.16 20.6% 0.8% 20.6 0.9 5.0% 34.7% 192 FY15E 337 261 0.08 0.10 2.14 19.3% 10.1% 24.2 0.9 5.5% 37.1% 2.04 230 FY16E 355 267 0.08 0.10 2.11 5.4% 1.4% 22.3 0.9 5.6% 37.5% 268 Source: Company data, Bloomberg, J.P. Morgan estimates. Investment Thesis, Valuation and Risks Suntec REIT (Overweight; Price Target: S$2.10) Investment Thesis SUN is primarily exposed to the Singapore office and retail segments, with the group’s recent expansion into the Australian office market. Key catalysts we expect for the stock are progressive leasing of Suntec City Mall Phase 3 and strong office rent growth in 2015. Valuation Our Dec-15 price target of S$2.10 is based on the average of our DDM and RNAV estimates, with DDM using a 7.0% discount rate and LT growth rate of 2%. We estimate tenure-adjusted RNAV at S$1,994 psf. Risks to Rating and Price Target Key downside risks include worse-than-expected rental reversions, an inability to lease out remaining vacant space at Suntec City Mall Phase 3 AEI and acquisitions of offshore assets. Key upside risks include stronger-than-expected rental reversions and a rise in the pre-commitment rate of Suntec City Mall's Phase 3 AEI from the existing 60%. 49 Asia Pacific Equity Research 31 January 2015 Brandon Lee (65) 6882-7073 [email protected] Suntec REIT: Summary of Financials Income Statement S$ in millions, year end Dec Revenues % change Y/Y EBIT % change Y/Y EBIT Margin (%) Net Interest Earnings before tax % change Y/Y Tax as % of EBT Net income (reported) % change Y/Y Distributable Income % change Y/Y Shares outstanding EPS (reported) (S$) % change Y/Y DPU (reported) (S$) % change Y/Y Balance sheet S$ in millions, year end Dec Cash and cash equivalents Accounts receivable Inventories Others Current assets LT investments Net fixed assets Total Assets FY14 282 20.6% 134 20.5% 47.4% (45) 323 (14.5%) (7) 2.2% 223 116.9% 230 9.1% 2,506 0.09 100.4% 0.09 0.8% FY15E 337 19.3% 184 37.7% 54.7% (39) 203 (37.1%) (3) 1.3% 196 (12.2%) 261 13.5% 2,526 0.08 (14.7%) 0.10 10.1% FY16E 355 5.4% 220 19.3% 61.9% (58) 221 8.7% (2) 0.9% 214 9.3% 267 2.3% 2,547 0.08 8.4% 0.10 1.4% FY17E 368 3.6% 235 6.9% 63.9% (64) 230 4.5% (2) 0.9% 223 4.5% 278 3.9% 2,568 0.09 3.7% 0.11 3.0% FY14 150 17 0 0 166 FY15E 173 7 0 0 180 FY16E 200 7 0 0 207 FY17E 212 7 0 0 220 5,948 3 8,602 6,204 6 8,844 6,239 9 8,884 Liabilities ST Loans 13 Payables 107 Others 10 Total current liabilities 130 Long-term debt 2,981 Other liabilities 73 Total Liabilities 3,184 Shareholders' equity 5,418 BVPS 2.16 Source: Company reports and J.P. Morgan estimates. 50 13 67 10 91 3,281 73 3,444 5,399 2.14 13 71 10 94 3,331 73 3,498 5,386 2.11 Cash flow statement S$ in millions, year end Dec EBIT Depr. & amortization Change in working capital Others Cash flow from operations Capex Net acquisitions Net Interest Free cash flow Equity raised/(repaid) Debt raised/(repaid) Other Dividends paid Beginning cash Ending cash DPU reported Ratio Analysis S$ in millions, year end Dec EBIT Margin Net margin Sales growth Net profit growth 6,239 EBIT growth 12 EPS growth 8,872 Interest coverage (x) Net debt to total capital 13 Net debt to equity 74 Sales/assets (x) 10 Assets/equity (x) 97 ROE 3,331 ROCE 73 3,501 5,372 2.09 FY14 134 1 14 (43) 196 FY15E 184 2 (29) 33 202 FY16E 220 2 3 39 258 FY17E 235 2 2 45 273 (96) 5 31 143 (256) (5) 44 (16) (36) (5) 26 280 0 (5) 20 337 350 (518) 232 (224) 181 150 0.09 0 300 (82) (261) 150 173 0.10 0 50 (84) (267) 173 200 0.10 0 0 (84) (278) 200 212 0.11 FY14 47.4% 78.9% FY15E 54.7% 58.0% FY16E 61.9% 60.2% FY17E 63.9% 60.7% 20.6% 116.9% 20.5% 100.4% 19.3% (12.2%) 37.7% (14.7%) 5.4% 9.3% 19.3% 8.4% 3.6% 4.5% 6.9% 3.7% 3.0 34.4% 52.5% 0.0 1.7 4.4% 1.6% 4.8 36.6% 57.8% 0.0 1.6 3.7% 2.2% 3.8 36.9% 58.4% 0.0 1.7 4.1% 2.5% 3.7 36.8% 58.3% 0.0 1.7 4.3% 2.7% Brandon Lee (65) 6882-7073 [email protected] Asia Pacific Equity Research 31 January 2015 Analyst Certification: The research analyst(s) denoted by an “AC” on the cover of this report certifies (or, where multiple research analysts are primarily responsible for this report, the research analyst denoted by an “AC” on the cover or within the document individually certifies, with respect to each security or issuer that the research analyst covers in this research) that: (1) all of the views expressed in this report accurately reflect his or her personal views about any and all of the subject securities or issuers; and (2) no part of any of the research analyst's compensation was, is, or will be directly or indirectly related to the specific recommendations or views expressed by the research analyst(s) in this report. For all Korea-based research analysts listed on the front cover, they also certify, as per KOFIA requirements, that their analysis was made in good faith and that the views reflect their own opinion, without undue influence or intervention. Important Disclosures Lead or Co-manager: J.P. Morgan acted as lead or co-manager in a public offering of equity and/or debt securities for Ascott Residence Trust within the past 12 months. Analyst Position: The following analysts (and/or their associates or household members) own a long position in the shares of CapitaRetail China Trust: Brandon Lee. The following analysts (and/or their associates or household members) own a long position in the shares of Frasers Centrepoint Trust: Brandon Lee. The following analysts (and/or their associates or household members) own a long position in the shares of Mapletree Industrial Trust: Brandon Lee. Client: J.P. Morgan currently has, or had within the past 12 months, the following company(ies) as clients: Ascott Residence Trust, CapitaCommercial Trust, CapitaMall Trust, CapitaRetail China Trust, Keppel REIT, Suntec REIT. Client/Investment Banking: J.P. Morgan currently has, or had within the past 12 months, the following company(ies) as investment banking clients: Ascott Residence Trust. Client/Non-Investment Banking, Securities-Related: J.P. Morgan currently has, or had within the past 12 months, the following company(ies) as clients, and the services provided were non-investment-banking, securities-related: Ascott Residence Trust, Keppel REIT. Investment Banking (past 12 months): J.P. Morgan received in the past 12 months compensation from investment banking Ascott Residence Trust. Investment Banking (next 3 months): J.P. Morgan expects to receive, or intends to seek, compensation for investment banking services in the next three months from Ascott Residence Trust. Non-Investment Banking Compensation: J.P. Morgan has received compensation in the past 12 months for products or services other than investment banking from Ascott Residence Trust, Keppel REIT. “J.P. Morgan (S.E.A.) Limited (“J.P. Morgan”) is acting as a Joint Lead Manager and Joint Bookrunners for DBS Trustee Limited in its capacity as trustee of Ascott Residence Trust (“Ascott”) for its subordinated perpetual issuance as announced on 17 October 2014. J.P. Morgan will be receiving fees for so acting. J.P. Morgan and/or its affiliates may perform, or may seek to perform, other financial or advisory services for Ascott and/or its affiliates and may have other interests in or relationships with Ascott and/or its affiliates, and receive fees, commissions or other compensation in such capacities. This research report and the information herein is not intended to serve as an endorsement of the proposed transaction or result in procurement, withholding or revocation of a proxy or any other action by a security holder. This report is based solely on publicly available information. No representation is made that it is accurate or complete.” Company-Specific Disclosures: Important disclosures, including price charts and credit opinion history tables, are available for compendium reports and all J.P. Morgan–covered companies by visiting https://jpmm.com/research/disclosures, calling 1-800-477-0406, or e-mailing [email protected] with your request. J.P. Morgan’s Strategy, Technical, and Quantitative Research teams may screen companies not covered by J.P. Morgan. For important disclosures for these companies, please call 1-800-4770406 or e-mail [email protected]. 51 Asia Pacific Equity Research 31 January 2015 Brandon Lee (65) 6882-7073 [email protected] A-REIT (AEMN.SI, AREIT SP) Price Chart OW S$3.154 OW OW S$2.928 S$2.593 OW S$2.5 OW S$1.65 N S$2.1 N S$2.18 5 OW S$3.001 OWOW S$2.943 S$2.992 OW S$2.649 OW S$1.7 OW S$2 N S$2.05 N S$2.1N S$2.15 N S$2.2 N S$2.65 4 OW S$3.05 OW S$3.324 OWOW S$2.876 S$2.953 OW S$2.572 OW S$2.3 OW S$1.85 OW N S$2.05 S$2.05 N S$2.2 N S$2.25 N S$2.3 N S$2.7 OW S$2.4 3 Price(S$) 2 1 0 Oct 06 Apr 08 Oct 09 Apr 11 Source: Bloomberg and J.P. Morgan; price data adjusted for stock splits and dividends. Break in coverage Aug 25, 2014 - Dec 09, 2014. 52 Oct 12 Apr 14 Date Rating Share Price Price Target (S$) (S$) 19-Jan-07 OW 2.69 3.05 19-Jul-07 OW 2.97 3.32 23-Aug-07 OW 2.45 3.00 19-Oct-07 OW 2.40 3.15 21-Jan-08 OW 2.18 2.88 25-Jan-08 OW 2.28 2.94 19-Feb-08 OW 2.25 2.93 19-Apr-08 OW 2.36 2.95 11-May-08 OW 2.48 2.99 16-Jun-08 OW 2.20 2.59 OW S$2.55 23-Sep-08 OW 2.05 2.57 19-Oct-08 OW 1.50 2.65 NR OW S$2.5 13-Nov-08 OW 1.49 2.50 15-Jan-09 OW 1.25 2.30 19-Apr-09 OW 1.47 1.70 05-May-09 OW 1.43 1.65 18-Jul-09 OW 1.65 1.85 17-Aug-09 OW 1.62 2.00 18-Jan-10 OW 2.04 2.05 20-Jan-10 N 2.03 2.05 16-Mar-10 N 1.94 2.10 20-Apr-10 N 1.99 2.05 18-Jul-10 N 2.01 2.10 18-Oct-10 N 2.11 2.18 11-Jan-11 N 2.16 2.20 21-Mar-11 N 1.89 2.15 08-Jul-11 N 2.14 2.25 28-Aug-11 N 2.09 2.20 31-Jul-12 N 2.24 2.30 02-Oct-12 N 2.40 2.65 28-Apr-13 N 2.71 2.70 31-Aug-13 OW 2.18 2.40 25-Aug-14 NR 2.35 -- 09-Dec-14 OW 2.29 2.50 22-Jan-15 2.52 2.55 OW Asia Pacific Equity Research 31 January 2015 Brandon Lee (65) 6882-7073 [email protected] Ascott Residence Trust (ASRT.SI, ART SP) Price Chart 2 N S$1.45 N S$1.35 NROW S$1.4 1.5 Date Rating Share Price Price Target (S$) (S$) 28-Apr-13 1 Price(S$) 0.5 N 1.45 1.45 31-Aug-13 N 1.20 1.35 25-Aug-14 NR 1.23 -- 09-Dec-14 OW 1.26 1.40 0 Mar 10 Dec 10 Sep 11 Jun 12 Mar 13 Dec 13 Sep 14 Source: Bloomberg and J.P. Morgan; price data adjusted for stock splits and dividends. Break in coverage Aug 25, 2014 - Dec 09, 2014. CapitaCommercial Trust (CACT.SI, CCT SP) Price Chart 4 UW S$2.204 UW S$2.602 OW S$2.268 N S$2.105 N S$0.81 N S$1 UW S$1.484 UW S$2.446 N S$1.924 OW S$2.299 N S$1.14 N S$0.9 3 N S$1.4 OW S$1.75 N S$1.35 UW S$1.4 N S$1.5 OW OW S$1.4 S$1.6 N S$1.75 UW S$1.481 UW S$2.402 UW S$2.359 UW OW S$2.214 S$2.227 N S$1.2 N S$0.85 N S$1.1 N S$1.15 N S$1.3 UW S$1.35 N S$1.45 N S$1.3 OW S$1.3 OW S$1.5 OW S$1.85 OW S$1.6 OW S$1.7 NR N S$1.7 Price(S$) 2 1 0 Oct 06 Apr 08 Oct 09 Apr 11 Source: Bloomberg and J.P. Morgan; price data adjusted for stock splits and dividends. Break in coverage Aug 25, 2014 - Dec 09, 2014. Oct 12 Apr 14 Date Rating Share Price Price Target (S$) (S$) 18-Oct-06 UW 1.59 1.48 08-Nov-06 UW 1.61 1.48 18-Jan-07 UW 1.93 2.20 05-Apr-07 UW 1.97 2.40 25-Apr-07 UW 1.96 2.45 20-Jul-07 UW 2.11 2.60 23-Aug-07 UW 1.86 2.36 03-Jan-08 UW 1.67 2.21 21-Jan-08 N 1.46 1.92 19-Mar-08 OW 1.45 2.27 28-Apr-08 OW 1.60 2.23 09-Jun-08 OW 1.63 2.30 16-Jun-08 N 1.47 2.10 18-Nov-08 N 0.63 1.20 20-Jan-09 N 0.64 1.14 30-Apr-09 N 0.62 0.81 22-May-09 N 0.77 0.85 22-Jul-09 N 0.88 0.90 17-Aug-09 N 0.86 1.00 23-Sep-09 N 1.04 1.10 18-Mar-10 N 1.13 1.15 18-Jul-10 N 1.35 1.30 25-Jul-10 N 1.40 1.35 11-Jan-11 UW 1.51 1.35 19-Jan-11 UW 1.51 1.40 25-Jun-11 N 1.42 1.45 14-Jul-11 N 1.45 1.50 28-Aug-11 N 1.17 1.40 14-Sep-11 N 1.13 1.30 04-Feb-12 OW 1.09 1.30 11-Apr-12 OW 1.22 1.40 20-Jul-12 OW 1.34 1.50 31-Jul-12 OW 1.34 1.60 02-Oct-12 OW 1.50 1.75 53 Asia Pacific Equity Research 31 January 2015 Brandon Lee (65) 6882-7073 [email protected] 28-Apr-13 CapitaMall Trust (CMLT.SI, CT SP) Price Chart 6 OW S$3.735 OW S$4.3 OW S$3.672 OW S$3.253 OW S$2.05 OW S$1.8 OW S$2.1 OWOW S$3.494 S$4.281 OW S$4.003 OW S$3.327 OW OW S$2.2 S$1.45 OW S$2 N S$2 OW S$2.2 OW S$2.15 OW S$2.35 OW S$2.2 4 OW S$2.761 OW S$4.206 OW S$3.9 OW S$3.928 OW S$2.78 OW S$1.5 OW S$1.9 OW S$2.15 N S$2.05 OW S$2.2 OWOW S$2.1 S$2.15 OW S$2.15 Price(S$) 2 0 Oct 06 Apr 08 Oct 09 Apr 11 Source: Bloomberg and J.P. Morgan; price data adjusted for stock splits and dividends. Break in coverage Aug 25, 2014 - Dec 09, 2014. 54 Oct 12 Apr 14 OW 1.71 1.85 31-Aug-13 OW 1.36 1.60 21-Apr-14 OW 1.64 1.70 25-Aug-14 NR 1.68 -- 09-Dec-14 N 1.68 1.70 21-Jan-15 N 1.90 1.75 Date Rating Share Price Price Target (S$) (S$) 20-Oct-06 OW 2.14 2.76 17-Jan-07 OW 2.32 3.49 19-Jan-07 OW 2.46 3.73 05-Apr-07 OW 3.02 4.21 20-Apr-07 OW 3.02 4.28 25-Apr-07 OW 3.21 4.30 23-Aug-07 OW 2.85 3.90 29-Nov-07 OW 2.59 4.00 21-Jan-08 OW 2.32 3.67 22-May-08 OW 2.86 3.93 16-Jun-08 OW 2.47 3.33 N S$2.15 23-Sep-08 OW 2.04 3.25 22-Oct-08 OW 1.72 2.78 OW NR S$2.15 25-Nov-08 OW 1.29 2.20 22-Jan-09 OW 1.22 2.05 10-Feb-09 OW 1.11 1.50 17-Apr-09 OW 1.30 1.45 26-Jul-09 OW 1.58 1.80 17-Aug-09 OW 1.46 1.90 23-Oct-09 OW 1.73 2.00 24-Jan-10 OW 1.75 2.10 22-Jul-10 OW 1.98 2.15 22-Oct-10 OW 2.02 2.20 11-Jan-11 N 1.96 2.00 01-Mar-11 N 1.81 2.05 21-Mar-11 OW 1.71 2.15 20-Jul-11 OW 1.92 2.20 18-Jan-12 OW 1.75 2.10 04-May-12 OW 1.80 2.15 31-Jul-12 OW 1.94 2.20 02-Oct-12 OW 2.02 2.35 31-Aug-13 OW 1.86 2.15 25-Aug-14 NR 2.00 -- 09-Dec-14 OW 1.98 2.15 23-Jan-15 2.25 2.15 N Asia Pacific Equity Research 31 January 2015 Brandon Lee (65) 6882-7073 [email protected] 2.11 2.60 2.67 3.42 26-Jul-07 OW 2.47 3.46 23-Aug-07 OW 2.21 2.78 18-Oct-07 OW 2.49 3.00 24-Oct-07 OW 2.42 3.06 14-Apr-08 OW 1.18 1.64 OW S$1.8 16-Jun-08 OW 1.30 1.55 23-Sep-08 OW 0.66 1.52 OW S$1.52 OW S$1.45 N S$1.25 N S$1.2 N S$1.65 OW S$2.6 OWOW S$3.46 S$3.06 OW S$1.64 OW S$1.549 OW S$1.05 OW S$1.3 N S$1.3 N S$1.3 N S$1.25 N S$1.3 N S$1.25 N S$1.45 N S$1.8 N S$1.55 3 OW NR S$1.75 29-Sep-08 OW 0.67 1.55 20-Jan-09 OW 0.59 1.05 23-Jul-09 OW 1.21 1.30 17-Aug-09 OW 1.20 1.45 20-Jan-10 N 1.28 1.30 31-Jan-10 N 1.25 1.25 20-Oct-10 N 1.25 1.30 21-Mar-11 N 1.22 1.25 15-Jul-11 N 1.23 1.30 16-Oct-11 N 1.19 1.20 28-Jan-12 N 1.14 1.25 31-Jul-12 N 1.44 1.45 02-Oct-12 N 1.48 1.65 28-Apr-13 N 1.70 1.80 31-Aug-13 N 1.34 1.55 25-Aug-14 NR 1.65 -- 09-Dec-14 OW 1.59 1.75 29-Jan-15 OW 1.72 1.80 Date Rating Share Price Price Target (S$) (S$) 19-Jan-07 Price(S$) 2 1 0 Dec 06 Jun 08 Dec 09 Jun 11 Dec 12 Jun 14 Source: Bloomberg and J.P. Morgan; price data adjusted for stock splits and dividends. Break in coverage Aug 25, 2014 - Dec 09, 2014. OW 1.63 2.00 17-May-07 OW 2.01 2.27 22-Jun-07 N 2.43 2.51 31-Jul-07 N 2.25 2.52 23-Aug-07 N 2.25 2.28 01-Nov-07 OW 2.39 2.80 21-Jan-08 OW 2.20 2.55 UW NR S$1.65 19-Mar-08 UW 1.90 1.51 16-Jun-08 UW 1.80 1.61 16-Jul-08 UW 1.52 1.32 03-May-09 UW 0.61 0.55 02-Aug-09 OW 1.21 1.80 01-Nov-09 OW 1.59 1.85 20-Jan-10 OW 1.75 2.00 02-May-10 OW 1.98 2.10 31-Oct-10 OW 2.17 2.30 11-Jan-11 OW 2.05 2.35 21-Mar-11 OW 1.89 2.10 28-Aug-11 N 1.78 1.80 19-Oct-11 N 1.46 1.50 31-Jan-12 N 1.78 1.55 31-Jul-12 N 2.07 1.90 02-Oct-12 N 2.03 2.10 20-Oct-12 UW 2.05 2.00 06-Jan-13 UW 1.94 1.90 CDL Hospitality Trusts (CDLT.SI, CDREIT SP) Price Chart 4 N S$2.51 OW S$2.8 UW S$1.608 OW S$1.8 OW S$2.35N S$1.5 N S$2.1 UW S$1.7 3 OW OW S$1.999 S$2.275 N S$2.282 UW S$1.507 UW S$0.545 OWOW S$2 S$2.1 OW S$2.3 N S$1.8 N S$1.55 N S$1.9 UW S$1.9N S$1.6 Price(S$) 2 1 0 Oct 06 Apr 08 Oct 09 Apr 11 Source: Bloomberg and J.P. Morgan; price data adjusted for stock splits and dividends. Break in coverage Aug 25, 2014 - Dec 09, 2014. Oct 12 Apr 14 17-Jan-07 OW 5 4 OW S$3.416 OW S$2.78OW S$1.55 Rating Share Price Price Target (S$) (S$) 22-Mar-07 OW CapitaRetail China Trust (CRCT.SI, CRCT SP) Price Chart OW S$3 Date 55 Asia Pacific Equity Research 31 January 2015 Brandon Lee (65) 6882-7073 [email protected] 31-Aug-13 N 1.56 1.60 25-Aug-14 NR 1.66 -- 09-Dec-14 UW 1.72 1.65 28-Jan-15 UW 1.80 1.70 Date Rating Share Price Price Target (S$) (S$) 28-Apr-13 Far East Hospitality Trust (FAEH.SI, FEHT SP) Price Chart 2 1.5 UW S$1.05 UW S$0.8 NR UW S$0.8 1 Price(S$) 0.5 UW 1.16 1.05 31-Aug-13 UW 0.84 0.80 25-Aug-14 NR 0.82 -- 09-Dec-14 UW 0.82 0.80 0 Aug 12 Nov 12 Feb 13 May 13 Aug 13 Nov 13 Feb 14 May 14 Aug 14 Nov 14 Feb 15 Source: Bloomberg and J.P. Morgan; price data adjusted for stock splits and dividends. Break in coverage Aug 25, 2014 - Dec 09, 2014. Frasers Centrepoint Trust (FCRT.SI, FCT SP) Price Chart 4 N S$2.1 3 N S$1.845 OW S$1.683 N S$2.05 N S$1.708 OW S$1.862 OW S$1.537 OW S$1.359 OW S$1.151 OW S$0.997 OW S$1.3 OW S$1.65OW OW S$1.8 S$1.65 N S$1.65 UW S$1.85 N S$1.85N S$2.15 N S$1.85 NR Price(S$) 2 1 0 Oct 06 Apr 08 Oct 09 Apr 11 Source: Bloomberg and J.P. Morgan; price data adjusted for stock splits and dividends. Break in coverage Sep 08, 2014 - Dec 09, 2014. 56 Oct 12 Apr 14 Date Rating Share Price Price Target (S$) (S$) 19-Jan-07 N 1.53 1.71 24-Apr-07 N 1.71 1.85 13-Aug-07 OW 1.38 1.86 23-Aug-07 OW 1.51 1.68 21-Jan-08 OW 1.23 1.54 16-Jun-08 OW 1.22 1.36 23-Oct-08 OW 0.64 1.15 24-Apr-09 OW 0.70 1.00 17-Aug-09 OW 0.98 1.30 10-Jan-10 OW 1.40 1.65 26-Oct-10 OW 1.50 1.80 21-Mar-11 OW 1.42 1.65 20-Jul-11 N 1.57 1.65 31-Jul-12 N 1.80 1.85 02-Oct-12 N 1.82 2.05 23-Oct-12 N 1.91 2.10 28-Apr-13 N 2.30 2.15 31-Aug-13 N 1.79 1.85 08-Sep-14 NR 1.98 -- 09-Dec-14 UW 1.91 1.85 Asia Pacific Equity Research 31 January 2015 Brandon Lee (65) 6882-7073 [email protected] Keppel REIT (KASA.SI, KREIT SP) Price Chart 2 Date UW S$1.198 UW S$0.66 N S$1.4 UW S$0.8 N S$0.85N S$1.1 N S$1.35 N S$1.25 NR N S$1.25 16-Jun-08 UW 1.25 1.20 19-Jan-09 UW 0.59 0.66 25-Jun-11 N 1.32 1.40 28-Aug-11 N 1.14 1.30 14-Sep-11 N 1.10 1.10 18-Oct-11 1.03 0.80 04-Feb-12 N 0.88 0.85 11-Apr-12 N 0.93 0.95 17-Jul-12 N 1.10 1.05 31-Jul-12 N 1.12 1.10 02-Oct-12 N 1.18 1.30 28-Apr-13 N 1.53 1.35 31-Aug-13 N 1.20 1.25 25-Aug-14 NR 1.25 -- 09-Dec-14 N 1.21 1.25 1.5 Price(S$) 1 0.5 0 Jun 08 Mar 09 Dec 09 Sep 10 Jun 11 Mar 12 Dec 12 Sep 13 Rating Share Price Price Target (S$) (S$) Jun 14 Source: Bloomberg and J.P. Morgan; price data adjusted for stock splits and dividends. Break in coverage Aug 25, 2014 - Dec 09, 2014. UW Mapletree Commercial Trust (MACT.SI, MCT SP) Price Chart 2 OW S$0.92 OW S$1.25 N S$0.92 OW S$1.15 N S$1.4 N S$1.25 OW S$1.4 NR UW S$1.4 Date Rating Share Price Price Target (S$) (S$) 08-Jun-11 N 1.5 Price(S$) 1 0.5 0 Apr 11 Jan 12 Oct 12 Jul 13 Apr 14 0.88 0.92 28-Aug-11 OW 0.84 0.92 31-Jul-12 OW 1.09 1.15 02-Oct-12 OW 1.17 1.25 20-Oct-12 N 1.26 1.25 28-Apr-13 N 1.45 1.40 31-Aug-13 N 1.12 1.25 24-Apr-14 OW 1.26 1.40 25-Aug-14 NR 1.44 -- 09-Dec-14 UW 1.44 1.40 Jan 15 Source: Bloomberg and J.P. Morgan; price data adjusted for stock splits and dividends. Break in coverage Aug 25, 2014 - Dec 09, 2014. 57 Asia Pacific Equity Research 31 January 2015 Brandon Lee (65) 6882-7073 [email protected] Mapletree Industrial Trust (MAPI.SI, MINT SP) Price Chart 2 OW S$1.3 OW S$1.3 OW S$1.4 N S$1.45 N S$1.35 N S$1.45 NR N S$1.55 Date Rating Share Price Price Target (S$) (S$) 08-Jun-11 1.5 1 Price(S$) 0.5 0 Oct 10 Jul 11 Apr 12 Jan 13 Oct 13 OW 1.16 1.30 28-Aug-11 OW 1.16 1.25 27-Jan-12 OW 1.08 1.30 31-Jul-12 OW 1.31 1.40 02-Oct-12 OW 1.42 1.55 28-Apr-13 N 1.58 1.45 31-Aug-13 N 1.28 1.35 23-Apr-14 1.43 1.45 25-Aug-14 NR 1.43 -- 09-Dec-14 N 1.49 1.55 N Jul 14 Source: Bloomberg and J.P. Morgan; price data adjusted for stock splits and dividends. Break in coverage Aug 25, 2014 - Dec 09, 2014. Date Suntec REIT (SUNT.SI, SUN SP) Price Chart 3 OW S$2.128 UW S$1.496 UW S$0.64 UW S$0.85 UW S$1.2 UW S$1.35 OW S$1.65 N S$1.75 OW S$2 OW S$1.834 UW S$1.629 UW S$1.344 UW S$1.337 UW S$1.342 UW S$0.8 UW S$1.15 N S$1.4N S$1.55 N S$1.4 N S$1.45 N S$1.6 OW S$1.8 OW S$1.75 2 Price(S$) 1 0 Oct 06 Apr 08 Oct 09 Apr 11 Source: Bloomberg and J.P. Morgan; price data adjusted for stock splits and dividends. Break in coverage Aug 25, 2014 - Dec 09, 2014. 58 Oct 12 Apr 14 Rating Share Price Price Target (S$) (S$) 28-Nov-06 OW 1.63 1.83 19-Jan-07 OW 1.82 2.13 14-Aug-07 UW 1.90 1.63 23-Aug-07 UW 1.83 1.50 30-Oct-07 UW 1.82 1.50 21-Jan-08 UW 1.49 1.34 16-Jun-08 UW 1.53 1.34 25-Nov-08 UW 0.62 1.34 29-Jan-09 UW 0.68 0.64 29-Apr-09 UW 0.72 0.60 NR OW S$2.1 31-Jul-09 UW 1.06 0.80 17-Aug-09 UW 0.97 0.85 23-Sep-09 UW 1.12 1.00 20-Jan-10 UW 1.35 1.15 26-Jan-10 UW 1.30 1.20 27-Apr-10 UW 1.38 1.25 25-Jul-10 N 1.43 1.40 27-Oct-10 UW 1.54 1.35 11-Jan-11 N 1.55 1.60 21-Mar-11 N 1.47 1.55 25-Jun-11 1.48 1.65 28-Aug-11 N 1.32 1.50 14-Sep-11 N 1.27 1.40 11-Apr-12 N 1.25 1.45 31-Jul-12 N 1.42 1.60 02-Oct-12 N 1.49 1.75 20-Oct-12 OW 1.57 1.75 23-Jan-13 OW 1.74 1.80 28-Apr-13 OW 1.96 2.00 31-Aug-13 OW 1.52 1.75 25-Aug-14 NR 1.80 -- 09-Dec-14 OW 1.90 2.10 OW Brandon Lee (65) 6882-7073 [email protected] Asia Pacific Equity Research 31 January 2015 The chart(s) show J.P. Morgan's continuing coverage of the stocks; the current analysts may or may not have covered it over the entire period. J.P. Morgan ratings or designations: OW = Overweight, N= Neutral, UW = Underweight, NR = Not Rated Explanation of Equity Research Ratings, Designations and Analyst(s) Coverage Universe: J.P. Morgan uses the following rating system: Overweight [Over the next six to twelve months, we expect this stock will outperform the average total return of the stocks in the analyst’s (or the analyst’s team’s) coverage universe.] Neutral [Over the next six to twelve months, we expect this stock will perform in line with the average total return of the stocks in the analyst’s (or the analyst’s team’s) coverage universe.] Underweight [Over the next six to twelve months, we expect this stock will underperform the average total return of the stocks in the analyst’s (or the analyst’s team’s) coverage universe.] Not Rated (NR): J.P. Morgan has removed the rating and, if applicable, the price target, for this stock because of either a lack of a sufficient fundamental basis or for legal, regulatory or policy reasons. The previous rating and, if applicable, the price target, no longer should be relied upon. An NR designation is not a recommendation or a rating. In our Asia (ex-Australia) and U.K. small- and mid-cap equity research, each stock’s expected total return is compared to the expected total return of a benchmark country market index, not to those analysts’ coverage universe. If it does not appear in the Important Disclosures section of this report, the certifying analyst’s coverage universe can be found on J.P. Morgan’s research website, www.jpmorganmarkets.com. Coverage Universe: Lee, Brandon: A-REIT (AEMN.SI), Ascott Residence Trust (ASRT.SI), CDL Hospitality Trusts (CDLT.SI), CapitaCommercial Trust (CACT.SI), CapitaLand (CATL.SI), CapitaMall Trust (CMLT.SI), CapitaRetail China Trust (CRCT.SI), City Developments (CTDM.SI), Far East Hospitality Trust (FAEH.SI), Frasers Centrepoint Trust (FCRT.SI), Global Logistic Properties Ltd (GLPL.SI), Keppel Land (KLAN.SI), Keppel REIT (KASA.SI), Mapletree Commercial Trust (MACT.SI), Mapletree Industrial Trust (MAPI.SI), Overseas Union Enterprise Ltd (OVES.SI), Suntec REIT (SUNT.SI) J.P. Morgan Equity Research Ratings Distribution, as of January 1, 2015 J.P. Morgan Global Equity Research Coverage IB clients* JPMS Equity Research Coverage IB clients* Overweight (buy) 45% 56% 45% 75% Neutral (hold) 43% 49% 48% 67% Underweight (sell) 12% 33% 7% 52% *Percentage of investment banking clients in each rating category. For purposes only of FINRA/NYSE ratings distribution rules, our Overweight rating falls into a buy rating category; our Neutral rating falls into a hold rating category; and our Underweight rating falls into a sell rating category. Please note that stocks with an NR designation are not included in the table above. Equity Valuation and Risks: For valuation methodology and risks associated with covered companies or price targets for covered companies, please see the most recent company-specific research report at http://www.jpmorganmarkets.com, contact the primary analyst or your J.P. Morgan representative, or email [email protected]. Equity Analysts' Compensation: The equity research analysts responsible for the preparation of this report receive compensation based upon various factors, including the quality and accuracy of research, client feedback, competitive factors, and overall firm revenues. Registration of non-US Analysts: Unless otherwise noted, the non-US analysts listed on the front of this report are employees of non-US affiliates of JPMS, are not registered/qualified as research analysts under NASD/NYSE rules, may not be associated persons of JPMS, and may not be subject to FINRA Rule 2711 and NYSE Rule 472 restrictions on communications with covered companies, public appearances, and trading securities held by a research analyst account. Other Disclosures J.P. Morgan ("JPM") is the global brand name for J.P. Morgan Securities LLC ("JPMS") and its affiliates worldwide. J.P. Morgan Cazenove is a marketing name for the U.K. investment banking businesses and EMEA cash equities and equity research businesses of JPMorgan Chase & Co. and its subsidiaries. All research reports made available to clients are simultaneously available on our client website, J.P. Morgan Markets. Not all research content is redistributed, e-mailed or made available to third-party aggregators. For all research reports available on a particular stock, please contact your sales representative. Options related research: If the information contained herein regards options related research, such information is available only to persons who have received the proper option risk disclosure documents. For a copy of the Option Clearing Corporation's Characteristics and Risks of Standardized Options, please contact your J.P. Morgan Representative or visit the OCC's website at http://www.optionsclearing.com/publications/risks/riskstoc.pdf Legal Entities Disclosures U.S.: JPMS is a member of NYSE, FINRA, SIPC and the NFA. JPMorgan Chase Bank, N.A. is a member of FDIC. U.K.: JPMorgan Chase N.A., London Branch, is authorised by the Prudential Regulation Authority and is subject to regulation by the Financial Conduct Authority and to limited regulation by 59 Brandon Lee (65) 6882-7073 [email protected] Asia Pacific Equity Research 31 January 2015 the Prudential Regulation Authority. Details about the extent of our regulation by the Prudential Regulation Authority are available from J.P. Morgan on request. J.P. Morgan Securities plc (JPMS plc) is a member of the London Stock Exchange and is authorised by the Prudential Regulation Authority and regulated by the Financial Conduct Authority and the Prudential Regulation Authority. Registered in England & Wales No. 2711006. Registered Office 25 Bank Street, London, E14 5JP. South Africa: J.P. Morgan Equities South Africa Proprietary Limited is a member of the Johannesburg Securities Exchange and is regulated by the Financial Services Board. Hong Kong: J.P. Morgan Securities (Asia Pacific) Limited (CE number AAJ321) is regulated by the Hong Kong Monetary Authority and the Securities and Futures Commission in Hong Kong and/or J.P. Morgan Broking (Hong Kong) Limited (CE number AAB027) is regulated by the Securities and Futures Commission in Hong Kong. Korea: J.P. Morgan Securities (Far East) Ltd, Seoul Branch, is regulated by the Korea Financial Supervisory Service. Australia: J.P. Morgan Australia Limited (JPMAL) (ABN 52 002 888 011/AFS Licence No: 238188) is regulated by ASIC and J.P. Morgan Securities Australia Limited (JPMSAL) (ABN 61 003 245 234/AFS Licence No: 238066) is regulated by ASIC and is a Market, Clearing and Settlement Participant of ASX Limited and CHI-X. Taiwan: J.P.Morgan Securities (Taiwan) Limited is a participant of the Taiwan Stock Exchange (company-type) and regulated by the Taiwan Securities and Futures Bureau. India: J.P. Morgan India Private Limited (Corporate Identity Number - U67120MH1992FTC068724), having its registered office at J.P. Morgan Tower, Off. C.S.T. Road, Kalina, Santacruz - East, Mumbai – 400098, is a member of the National Stock Exchange of India Limited (SEBI Registration Number - INB 230675231/INF 230675231/INE 230675231) and Bombay Stock Exchange Limited (SEBI Registration Number - INB 010675237/INF 010675237) and is regulated by Securities and Exchange Board of India. Telephone: 91-22-6157 3000, Facsimile: 91-22-6157 3990 and Website: www.jpmipl.com. For non local research reports, this material is not distributed in India by J.P. Morgan India Private Limited. Thailand: This material is issued and distributed in Thailand by JPMorgan Securities (Thailand) Ltd., which is a member of the Stock Exchange of Thailand and is regulated by the Ministry of Finance and the Securities and Exchange Commission and its registered address is 3rd Floor, 20 North Sathorn Road, Silom, Bangrak, Bangkok 10500. Indonesia: PT J.P. Morgan Securities Indonesia is a member of the Indonesia Stock Exchange and is regulated by the OJK a.k.a. BAPEPAM LK. Philippines: J.P. Morgan Securities Philippines Inc. is a Trading Participant of the Philippine Stock Exchange and a member of the Securities Clearing Corporation of the Philippines and the Securities Investor Protection Fund. It is regulated by the Securities and Exchange Commission. Brazil: Banco J.P. Morgan S.A. is regulated by the Comissao de Valores Mobiliarios (CVM) and by the Central Bank of Brazil. Mexico: J.P. Morgan Casa de Bolsa, S.A. de C.V., J.P. Morgan Grupo Financiero is a member of the Mexican Stock Exchange and authorized to act as a broker dealer by the National Banking and Securities Exchange Commission. Singapore: This material is issued and distributed in Singapore by or through J.P. Morgan Securities Singapore Private Limited (JPMSS) [MCI (P) 199/03/2014 and Co. Reg. No.: 199405335R] which is a member of the Singapore Exchange Securities Trading Limited and is regulated by the Monetary Authority of Singapore (MAS) and/or JPMorgan Chase Bank, N.A., Singapore branch (JPMCB Singapore) which is regulated by the MAS. This material is provided in Singapore only to accredited investors, expert investors and institutional investors, as defined in Section 4A of the Securities and Futures Act, Cap. 289. Recipients of this document are to contact JPMSS or JPMCB Singapore in respect of any matters arising from, or in connection with, the document. Japan: JPMorgan Securities Japan Co., Ltd. is regulated by the Financial Services Agency in Japan. Malaysia: This material is issued and distributed in Malaysia by JPMorgan Securities (Malaysia) Sdn Bhd (18146-X) which is a Participating Organization of Bursa Malaysia Berhad and a holder of Capital Markets Services License issued by the Securities Commission in Malaysia. Pakistan: J. P. Morgan Pakistan Broking (Pvt.) Ltd is a member of the Karachi Stock Exchange and regulated by the Securities and Exchange Commission of Pakistan. Saudi Arabia: J.P. Morgan Saudi Arabia Ltd. is authorized by the Capital Market Authority of the Kingdom of Saudi Arabia (CMA) to carry out dealing as an agent, arranging, advising and custody, with respect to securities business under licence number 35-07079 and its registered address is at 8th Floor, Al-Faisaliyah Tower, King Fahad Road, P.O. Box 51907, Riyadh 11553, Kingdom of Saudi Arabia. Dubai: JPMorgan Chase Bank, N.A., Dubai Branch is regulated by the Dubai Financial Services Authority (DFSA) and its registered address is Dubai International Financial Centre - Building 3, Level 7, PO Box 506551, Dubai, UAE. Country and Region Specific Disclosures U.K. and European Economic Area (EEA): Unless specified to the contrary, issued and approved for distribution in the U.K. and the EEA by JPMS plc. Investment research issued by JPMS plc has been prepared in accordance with JPMS plc's policies for managing conflicts of interest arising as a result of publication and distribution of investment research. Many European regulators require a firm to establish, implement and maintain such a policy. This report has been issued in the U.K. only to persons of a kind described in Article 19 (5), 38, 47 and 49 of the Financial Services and Markets Act 2000 (Financial Promotion) Order 2005 (all such persons being referred to as "relevant persons"). This document must not be acted on or relied on by persons who are not relevant persons. Any investment or investment activity to which this document relates is only available to relevant persons and will be engaged in only with relevant persons. In other EEA countries, the report has been issued to persons regarded as professional investors (or equivalent) in their home jurisdiction. Australia: This material is issued and distributed by JPMSAL in Australia to "wholesale clients" only. This material does not take into account the specific investment objectives, financial situation or particular needs of the recipient. The recipient of this material must not distribute it to any third party or outside Australia without the prior written consent of JPMSAL. For the purposes of this paragraph the term "wholesale client" has the meaning given in section 761G of the Corporations Act 2001. Germany: This material is distributed in Germany by J.P. Morgan Securities plc, Frankfurt Branch and J.P.Morgan Chase Bank, N.A., Frankfurt Branch which are regulated by the Bundesanstalt für Finanzdienstleistungsaufsicht. Hong Kong: The 1% ownership disclosure as of the previous month end satisfies the requirements under Paragraph 16.5(a) of the Hong Kong Code of Conduct for Persons Licensed by or Registered with the Securities and Futures Commission. (For research published within the first ten days of the month, the disclosure may be based on the month end data from two months prior.) J.P. Morgan Broking (Hong Kong) Limited is the liquidity provider/market maker for derivative warrants, callable bull bear contracts and stock options listed on the Stock Exchange of Hong Kong Limited. An updated list can be found on HKEx website: http://www.hkex.com.hk. Japan: There is a risk that a loss may occur due to a change in the price of the shares in the case of share trading, and that a loss may occur due to the exchange rate in the case of foreign share trading. In the case of share trading, JPMorgan Securities Japan Co., Ltd., will be receiving a brokerage fee and consumption tax (shouhizei) calculated by multiplying the executed price by the commission rate which was individually agreed between JPMorgan Securities Japan Co., Ltd., and the customer in advance. Financial Instruments Firms: JPMorgan Securities Japan Co., Ltd., Kanto Local Finance Bureau (kinsho) No. 82 Participating Association / Japan Securities Dealers Association, The Financial Futures Association of Japan, Type II Financial Instruments Firms Association and Japan Investment Advisers Association. Korea: This report may have been edited or contributed to from time to time by affiliates of J.P. Morgan Securities (Far East) Ltd, Seoul Branch. Singapore: JPMSS and/or its affiliates may have a holding in any of the securities discussed in this report; for securities where the holding is 1% or greater, the specific holding is disclosed in the Important Disclosures section above. Taiwan: This material is issued and distributed in Taiwan by J.P. Morgan Securities (Taiwan Limited). India: For private circulation only, not for sale. Pakistan: For private circulation only, not for sale. New Zealand: This material is issued and distributed by JPMSAL in New Zealand only to persons whose principal business is the investment of money or who, in the course of and for the purposes of their business, habitually invest money. JPMSAL does not issue or distribute this material to members of "the public" as determined in accordance with section 3 of the Securities Act 1978. The recipient of this material must not distribute it to any third party or outside New Zealand without the prior written consent of JPMSAL. Canada: The information contained herein is not, and under no circumstances is to be construed as, a prospectus, an advertisement, a public offering, an offer to sell 60 Brandon Lee (65) 6882-7073 [email protected] Asia Pacific Equity Research 31 January 2015 securities described herein, or solicitation of an offer to buy securities described herein, in Canada or any province or territory thereof. Any offer or sale of the securities described herein in Canada will be made only under an exemption from the requirements to file a prospectus with the relevant Canadian securities regulators and only by a dealer properly registered under applicable securities laws or, alternatively, pursuant to an exemption from the dealer registration requirement in the relevant province or territory of Canada in which such offer or sale is made. The information contained herein is under no circumstances to be construed as investment advice in any province or territory of Canada and is not tailored to the needs of the recipient. To the extent that the information contained herein references securities of an issuer incorporated, formed or created under the laws of Canada or a province or territory of Canada, any trades in such securities must be conducted through a dealer registered in Canada. No securities commission or similar regulatory authority in Canada has reviewed or in any way passed judgment upon these materials, the information contained herein or the merits of the securities described herein, and any representation to the contrary is an offence. Dubai: This report has been issued to persons regarded as professional clients as defined under the DFSA rules. Brazil: Ombudsman J.P. Morgan: 0800-7700847 / [email protected]. General: Additional information is available upon request. Information has been obtained from sources believed to be reliable but JPMorgan Chase & Co. or its affiliates and/or subsidiaries (collectively J.P. Morgan) do not warrant its completeness or accuracy except with respect to any disclosures relative to JPMS and/or its affiliates and the analyst's involvement with the issuer that is the subject of the research. All pricing is as of the close of market for the securities discussed, unless otherwise stated. Opinions and estimates constitute our judgment as of the date of this material and are subject to change without notice. Past performance is not indicative of future results. This material is not intended as an offer or solicitation for the purchase or sale of any financial instrument. The opinions and recommendations herein do not take into account individual client circumstances, objectives, or needs and are not intended as recommendations of particular securities, financial instruments or strategies to particular clients. The recipient of this report must make its own independent decisions regarding any securities or financial instruments mentioned herein. JPMS distributes in the U.S. research published by non-U.S. affiliates and accepts responsibility for its contents. Periodic updates may be provided on companies/industries based on company specific developments or announcements, market conditions or any other publicly available information. Clients should contact analysts and execute transactions through a J.P. Morgan subsidiary or affiliate in their home jurisdiction unless governing law permits otherwise. "Other Disclosures" last revised November 29, 2014. Copyright 2015 JPMorgan Chase & Co. All rights reserved. This report or any portion hereof may not be reprinted, sold or redistributed without the written consent of J.P. Morgan. #$J&098$#*P 61
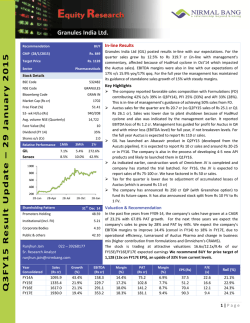
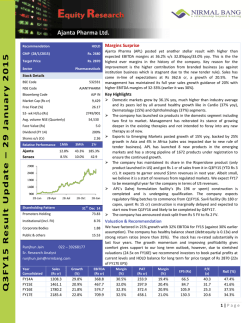

© Copyright 2026