
read more - Kagiso Asset Management
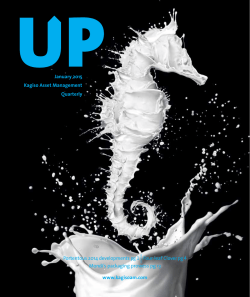
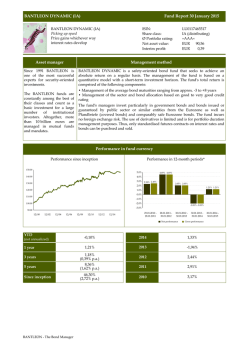
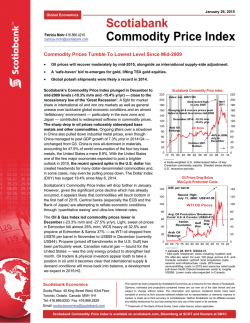
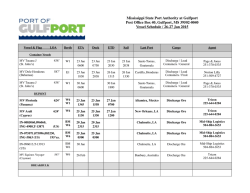
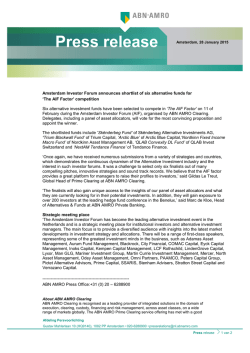
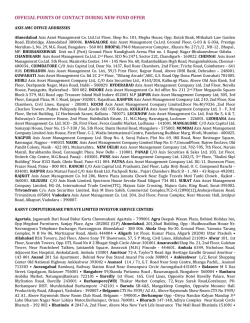
January 2015
Kagiso Asset Management
Quarterly
Portentous 2014 developments pg 1 Four-leaf Clover pg 4
Mondi’s packaging prowess pg 13
www.kagisoam.com
Portentous 2014 developments
Gavin Wood - Chief Investment Officer
After persistent trends and low volatility since the
financial crisis, 2014 presented market dislocations
and structural changes that we believe have important
implications for the course of financial markets,
whose participants seem somewhat complacent
since ‘momentum’ has been the winning strategy for
so long. We highlight some of these dislocations and
changes below.
1
Portentous 2014 developments
The US passed on the QE baton
Foreigners began selling SA bonds
via the purchase by central banks of financial instruments from
foreigners sold R71.7 billion of bonds in 2014. Coinciding with
Quantitative easing (QE), injecting liquidity into the economy
the private sector, has been executed on a grand scale since the
financial crisis (see chart below) - at a time of near zero interest
rates in the world’s largest economies.
After many years of foreign inflows into our bond market,
these outflows, the rand depreciated by 9.3% (to the US$) to its
worst level since 2001. Receding foreign liquidity will make our
government’s budget deficit more difficult to finance.
The US Federal Reserve has purchased US$3.7 trillion between
Emerging market equities also saw foreign outflows of
magnitude of this intervention is staggering, given that the US
into SA, at R13.3 billion, were positive. However, this may have
November 2008 and October 2014 (QE3’s conclusion). The
economy (GDP is US$17.6 trillion) and bond market (103% public
debt:GDP) are the world’s largest. The real economy benefits of
US QE have, in our view, been mixed and of diminishing effect
through time, but the impact on asset prices has been massive.
US$25 billion in 2014, while, in contrast, foreign equity inflows
had more to do with internal problems in our emerging
market peers (Russia, Brazil, Turkey, Thailand) than the absolute
prospects for our companies.
China’s economy decelerated further
Having grown GDP at rates of 8%-10% pa for over a decade
In 2013, the Bank of Japan began its enormous QE programme
(slowing to below 8% in 2013), China’s growth rate headed
and the European Central Bank tentatively began asset
towards the 7% level in 2014. Growth is likely heading lower as
purchases in 2014, with widespread expectations of significant
the economy needs to absorb excess capacity, deleverage and
sovereign bond purchases to come. This significant structural
change highlights the better state of the US economy and has
precipitated a sharp strengthening of the US dollar against the
yen and the euro. The net effect should be a tightening of
rebalance away from fixed investment. China’s property activity
slowed in 2014, housing prices declined and new residential
construction fell. Limited fiscal policy (infrastructure investment)
and monetary policy (lower bank reserve requirements and an
global liquidity conditions, given the relative magnitude of the
interest rate cut) stimulus measures were introduced.
QE programmes, which should be negative for asset prices.
Different directions for central bank balance sheets
Central bank assets as a % of GDP
60
50
Bank of Japan
40
European Central Bank
Bank of England
30
US Federal Reserve
20
10
2010
2011
2012
2013
2014
Source: BCA Research and Kagiso Asset Management research
Commodity prices fell sharply
up some 20% of imports. The large relative oil price decline
commodity consumer, came as 2014 saw an increase in supply
impact and, together with lower maize prices, will dampen price
The growth deceleration in China, the world’s largest non-oil
of many of the commodities it imports. The result was large
commodity price falls, with iron ore and oil prices almost
halving and thermal coal down 22%. Precious metals were little
changed in 2014 off already low levels as supply was curtailed.
The oil price decline is particularly important for the world
(graph below) should result in a slightly positive trade balance
inflation, enabling the SARB to raise rates more slowly.
In South Africa
Local developments of particular importance for financial
markets were:
the start of the SARB rate hiking cycle;
economy as it is the largest commodity traded by value. The
National Treasury announcing ‘austerity measures’ in its
cause of the price decline was increased production from
North America at a time of weak demand from Europe and China
and growing use of substitutes (natural gas and renewables),
with OPEC making no change to their production intentions.
October mini-budget in the form of an expenditure ceiling
and imminent tax rises;
major splits in organised labour with the NUMSA expulsion
from Cosatu and the emergence of non-aligned AMCU,
whose perceived success with its platinum mine strike is
These material commodity price declines will have significant
fuelling a major recruitment drive from established unions
implications for their respective consuming and producing
in various other sectors; and
countries and companies. Iron ore producers, eg Brazil and
Australia, will see export revenues decline. Large net oil exporter
economies such as Saudi Arabia, Russia, Nigeria, Angola,
Columbia, Mexico and Venezuela will struggle as they are very
concentrated around oil production. Oil price falls will particularly
benefit large net importers, such as Europe and Japan.
South Africa’s exports are dominated (roughly 60%) by iron ore,
thermal coal, platinum group metals and gold, while oil makes
the demise of African Bank Investments, which should serve
to reduce the extortionate returns earned by unsecured
credit providers in SA, to reorganise the furniture retail
industry and to remind bond and preference share investors
to consider credit risk.
Given these structural changes, 2015 has begun with raised
market volatility and our clients’ portfolios are therefore
positioned for a very different environment to the one that has
prevailed in recent years.
Falling commodity prices
130
12
120
Rand
US$ per tonne
110
100
10
90
80
9
70
60
8
Dollar commodity prices based to 100
11
Rand dollar (LHS)
Platinum
Gold
Oil (Brent)
Iron ore
Thermal coal
50
7
Dec 11
2008
2013
Jun 12
Global average
Dec 12
Jun 13
Dec 13
Jun 14
40
Dec 14
Source: Bloomberg and Kagiso Asset Management research
Kagiso Asset Management (Pty) Limited
Fifth Floor MontClare Place
Cnr Campground and Main Roads
Claremont 7708
PO Box 1016 Cape Town 8000
Tel +27 21 673 6300 Fax +27 86 675 8501
Email [email protected]
Website www.kagisoam.com
Kagiso Asset Management (Pty) Limited is a licensed financial services provider
(FSP No. 784). Reg No. 1998/015218/07.


© Copyright 2026