Scotiabank Commodity Price Index
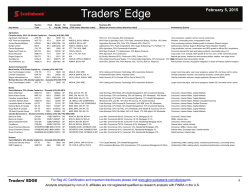
Global Economics Patricia Mohr 416.866.4210 [email protected] January 29, 2015 Scotiabank Commodity Price Index Commodity Prices Tumble To Lowest Level Since Mid-2009 Oil prices will recover moderately by mid-2015, alongside an international supply-side adjustment. A ‘safe-haven’ bid re-emerges for gold, lifting TSX gold equities. Global potash shipments were likely a record in 2014. Scotiabank’s Commodity Price Index plunged in December to mid-2009 levels (-10.3% m/m and -15.4% yr/yr) — close to the recessionary low of the ‘Great Recession’. A fight for market share in international oil and iron ore markets as well as general unease over lacklustre global economic conditions and an almost ‘deflationary’ environment — particularly in the euro zone and Japan — contributed to widespread softness in commodity prices. The sharp drop in oil prices noticeably sideswiped base metals and other commodities. Ongoing jitters over a slowdown in China also pulled down industrial metal prices, even though China managed to post GDP growth of 7.3% yr/yr in 2014:Q4 — unchanged from Q3. China is now all-dominant in materials, accounting for 47.9% of world consumption of the four key base metals, the United States a mere 8.9%. With the United States one of the few major economies expected to post a brighter outlook in 2015, the recent upward spike in the U.S. dollar has created headwinds for many dollar-denominated commodities and, in some cases, may even be pulling prices down; The Dollar Index (DXY) has surged 19.4% since May 6, 2014. Scotiabank’s Commodity Price Index will drop further in January. However, given the significant price decline which has already occurred, it appears likely that commodities will touch bottom in the first half of 2015. Central banks (especially the ECB and the Bank of Japan) are attempting to reflate economic conditions through ‘quantitative easing’ and ultra-low interest rates. The Oil & Gas Index led commodity prices lower in December (-23.3% m/m and -27.5% yr/yr). Light, sweet oil prices in Edmonton fell almost 25% m/m, WCS heavy oil 32.5% and propane at Edmonton & Sarnia 37% — as WTI oil dropped from US$76 per barrel in November to US$59 in December (currently US$44). Propane (priced off benchmarks in the U.S. Gulf) has been particularly weak. Canadian natural gas — bound for the United States — was the only energy product to strengthen last month. Oil traders & physical investors appear loath to take a position in oil until it becomes clear that international supply & demand conditions will move back into balance, a development we expect in 2015:H2. Scotiabank Economics Scotia Plaza 40 King Street West, 63rd Floor Toronto, Ontario Canada M5H 1H1 Tel: 416.866.6253 Fax: 416.866.2829 Email: [email protected] Scotiabank Commodity Price Index 220 200 140 120 100 80 Plunging oil & iron ore prices push Index to lowest level since mid-2009 Arab Oil Embargo 40 180 140 120 100 All Items 80 October 2001 Bottom 20 200 160 December 2014: -10.3% m/m -15.4% yr/yr 60 0 April 2011 New record high in July 2008 180 160 220 Index: Jan. 2007=100 -46% in 2008: 60 July to December 40 20 72 76 80 84 88 92 96 00 04 08 12 16 0 A trade-weighted U.S. dollar-based Index of key Canadian commodity exports. Shaded areas denote U.S. recession periods. Oil Prices Drop Below Mid-Cycle Production Costs 140 120 60 40 20 0 140 Record High: July 11, 2008: US$147.90 100 80 * US$ per barrel 120 100 WTI Oil Prices 80 Avg. Oil Production 'Breakeven Costs' U.S. & Canada: US$60-61* Iranian Revolution Iraq Gulf War War 60 + Arab Oil Embargo 60 65 70 75 80 85 90 95 00 05 10 15 20 40 20 0 + January 28, 2015: US$44.37. * Mid-cycle breakeven costs including royalties and 9% after-tax return for over 100 plays across U.S. and Canada; excludes 'upfront' land acquisition costs, seismic and infrastructure costs. 20% lower service/drilling costs in 2015 and some tax relief could pull down North Dakota breakeven costs to roughly US$56. Lower costs also expected in Canada. This report has been prepared by Scotiabank Economics as a resource for the clients of Scotiabank. Opinions, estimates and projections contained herein are our own as of the date hereof and are subject to change without notice. The information and opinions contained herein have been compiled or arrived at from sources believed reliable but no representation or warranty, express or implied, is made as to their accuracy or completeness. Neither Scotiabank nor its affiliates accepts any liability whatsoever for any loss arising from any use of this report or its contents. TM Trademark of The Bank of Nova Scotia. Used under license, where applicable. Scotiabank Commodity Price Index is available on scotiabank.com, Bloomberg at SCOT and Reuters at SM1C January 29, 2015 Global Economics Scotiabank Commodity Price Index A supply-side adjustment is already getting underway (specifically in the U.S. shales, as targetted by Saudi Arabia and the Gulf Co-Operation Council members of OPEC). The number of U.S. oil-focused drilling rigs has fallen from a peak of 1,609 on October 10, 2014 to 1,317 on January 23, 2015 (-7.0% yr/yr). While much has been made of the resilience of U.S. oil production, we believe that reduced funding and moves by producers to protect their balance sheets, pulling back from more marginal fields, will eventually lead to a slowdown in output. Scotiabank petroleum reservoir engineers estimate that a sustained 30% drop in drilling activity is needed to level out U.S. oil production from the North Dakota Bakken, the Permian and the Eagle Ford Basins, after the remarkable 1.28 mb/d gain over the past 12 months (January 2014 to January 2015). Active rigs have already fallen 13.7% below the 2014 average. Global capital spending on exploration & production could drop by 30% in 2015, including an already announced 27% drop in capex by oil & gas producers in Canada (not including service & drilling companies). However, Western Canadian oil production should still advance by 150,000 b/d. M&A activity will pick up once buyers and sellers agree that oil prices have stabilized. The Metal & Mineral Index eased back in December (-1.4% m/m, -10.9% yr/yr) and likely declined further in January. A pullback in base metal prices (excepting nickel & cobalt) more than offset stronger gold and precious metal prices. LME copper prices tumbled below the US$6,000 per tonne mark (US$2.72 per pound) on January 14, as Chinese hedge funds — encouraged by plunging oil prices — shorted the market. Widespread anticipation that copper prices would move lower in 2015, alongside new copper mine supply, may also have encouraged selling. Prices remain at a low ebb in late January at US$2.49 (still yielding a slight 10% profit margin over average world breakeven costs including depreciation). Copper has likely been ‘over-sold’, given the fifth-highest imports into China on record in December, new fiscal stimulus by Beijing to spur the economy (speeding up spending on 300 infrastructure projects) and a planned 24% increase in capital spending by the State Electricity Grid (likely geared towards copper cable). Mining companies have recently cut projected output for 2015 by 300,000 tonnes (Rio Tinto at Kennecott, BHP Billiton at Escondida and Glencore at Alumbrera), helping to trim an expected surplus this year to a modest 250,000 tonnes. The Forest Product Index inched lower in December (-0.4% m/m, -2.4% yr/yr), but posted the smallest decline of any sub-Index. A slight pick-up in Western Spruce-PineFir 2x4 lumber prices to US$338 per mfbm was just offset by a second small decline in newsprint prices to US$595 per tonne in the Eastern U.S. and slightly lower NBSK pulp prices to US$1,020 per tonne (-US$5). While OSB prices in the U.S. North Central region also edged down from US$219 to US$204 per thousand sq. ft., we expect a big pick-up in the second half of 2015. U.S. Dollar Spikes Higher… 1.60 120 The recovery in U.S. housing starts in 2014 US$ index per € 1.50 was disappointing, with starts totalling 1.004 euro 110 1.40 million units — only a slight gain from 930,000 100 1.30 in 2013. First-time home buying was constrained by still high unemployment among 1.20 90 younger age groups and tighter bank lending 1.10 80 standards than in the previous decade, both 1.00 U.S. Dollar 70 factors constraining household formation. Index (DXY)* 0.90 Nevertheless, signs point to some relaxation of ... Creating headwinds for commodity prices 0.80 60 98 00 02 04 06 08 10 12 14 16 lending standards in 2015, overall employment growth has picked up significantly (the U.S. * Weighted geometric mean of U.S. Dollar against euro (57.6%), Sterling (11.9%), unemployment rate is a mere 5.6%) and rental Canadian Dollar (9.1%), Swedish Krona (4.2%) Low Oil Prices Begin To Trigger Supply-Side Adjustment 1,800 1,800 Number of rigs Data to January 23, 2015 1,600 1,600 1,400 1,400 1,200 1,200 1,000 1,000 800 800 U.S. Oil Rotary Rig Count 600 600 400 400 200 200 0 88 91 94 97 00 03 06 09 12 0 15 Data Source: Baker Hughes Incorporated. Canadian rig count: oil-targetted -43.4% yr/yr, +137% since late 2014. U.S. Drilling Activity Starts To Be Curbed yr/yr % change October 10: 1,609 rigs, +17.7% yr/yr 20 20 15 15 U.S. Oil Rotary Rig Count 10 10 5 5 0 0 -5 -5 January 23, 2015: 1,317 rigs, -7.0% yr/yr -10 Jan-13 Jul-13 Jan-14 Jul-14 -10 Jan-15 Data Source: Baker Hughes Incorporated. 'Safe-Haven' Bid Re-Emerges For Gold, But Stronger U.S. Dollar Is A Risk… 2,000 US$ per ounce New Record: Sept. 9, 2011 spot US$1,921.15 1,800 1,600 1,800 1,600 1,400 1,400 + Fed Quantitative Easing 1,200 2,000 * 1,200 1,000 1,000 Jan 21, 1980 peak US$850 800 800 Gold Prices London PM Fix 600 600 400 400 200 0 200 ... With possible Fed monetary tightening in 2015:Q2 75 80 85 90 95 00 05 10 15 20 0 + London PM Fix on January 28, 2015: US$1,288. 4,000 TSX Gold Equities Rally In Early '15 Index: 1975 = 1,000 4,000 3,500 3,500 3,000 3,000 2,500 2,500 2,000 2,000 TSX - Gold Equities +29.0% 2015 YTD (-1.4% yr/yr) 1,500 1,000 500 0 1,500 1,000 500 TSX-Diversified Metals Are 'Oversold' -13.4% 2015YTD; -33.1% yr/yr. 07 08 09 10 11 12 13 14 15 16 Data to January 28, 2015. and Swiss Franc (3.6%). 2 0 January 29, 2015 Global Economics Scotiabank Commodity Price Index vacancy rates are below average at 7.4%. U.S. housing starts should total around 1.2-1.3 million units in 2015-16, lifting lumber & OSB prices. A soft Canadian dollar — at a mere US$0.798 on January 26 — the lowest since April 1, 2009, when the Scotiabank Commodity Price Index reached its cyclical bottom during the ‘Great Recession’ — will significantly boost export receipts from forest products. The Agricultural Index also eased in December (-3.7% m/m, 5.4%yr/yr). Slightly lower hog, wheat and canola prices more than countered stronger barley prices. An unusually large salmon run in B.C. also pulled down Pacific Coast salmon prices (-41% m/m). Barley prices at Lethbridge, Alberta were buoyed by last autumn’s small harvest in Western Canada. Rail car tightness and a strong U.S. dollar have restrained imports of U.S. corn (a competing feed grain). Scotiabank Commodity Price Index December 2014 Growth (per cent Trends change) Weights (Compound Annual Growth Rates) All Commodity Price Index 100.0 One Month -10.3 One Month -73.0 Three Months -51.2 One Year -15.4 Five Years -1.8 Industrials Oil & Gas Metal & Minerals Forest Products 84.7 39.9 30.1 14.7 -11.7 -23.3 -1.4 -0.4 -77.5 -95.8 -15.5 -4.3 -57.6 -81.3 -15.9 -9.9 -17.4 -27.5 -10.9 -2.4 -2.8 -6.1 -1.9 4.7 Agriculture 15.3 -3.7 -36.4 -3.3 -5.4 3.2 Sept 2013 Dec Index: January 2007 = 100 Dec 2014 Nov Oct All Commodity Price Index 112.0 124.9 130.9 134.0 132.3 Industrials Oil & Gas Metal & Minerals Forest Products 107.8 95.3 117.7 121.8 122.1 124.2 119.4 122.2 129.2 137.2 121.2 124.1 133.6 144.9 122.9 125.0 130.5 131.4 132.1 124.8 Agriculture 134.7 139.9 140.2 135.9 142.4 Re-designed Index: Net export weights in 2010, data re-estimated back through 2007, January 2007=100. As of April/May 2014, the Edmonton Par was replaced with MSW Light, Sweet Crude Oil prices at Edmonton, with price differentials off WTI near-by futures from TMX/Shorcan Energy Brokers. After climbing to a record US$108 last July, hog prices in Ontario have trended down to US$72 per hundredweight in December. Falling prices in the United States have taken a toll on prices in Canada. The latest U.S. Department of Agriculture quarterly hog report revealed a record average litter size, with producers over-reacting to the impact of last year’s PED virus. Cattle prices remained firm at US$154 in December, given much slower herd expansion across North America. Gold Prices Rally, As A ‘Safe-Haven’ Bid Re-Emerges In contrast to many commodities, gold prices have strengthened in recent months — a welcome development for the Toronto Stock Exchange & the TSX Venture — the home of more than 60% of the world’s publicly traded gold producers. Uncertainty over global growth and pressure on some oil-related currencies (the Russian ruble) has given gold a renewed bid as a ‘safe-haven’. The Swiss National Bank’s decision to abandon the Swiss franc’s 1.20 euro cap, ahead of expected ‘quantitative easing’ by the ECB on January 22 (later confirmed), roiled currency markets, driving up gold prices. The ECB’s Euro 60 bn per month ‘bond-buying programme’ or ‘QE’ (both sovereign & private-sector debt) from March through at least September 2016 was far bigger than expected and is intended to push down yields, stave off economic stagnation by boosting inflation and weaken the euro, giving a competitive boost to euro zone exporters. The net result, the London PM Fix climbed to a high of US$1,295.75 on January 22 and is US$1,288 late month (approaching the US$1,300 mark). The recent rise in gold has occurred alongside a stronger U.S. dollar, with investors possibly doubting whether the Fed will actually tighten monetary policy near-term. However, assuming the Fed lifts the Federal funds rate in 2015:Q2 (possibly in June), gold prices would be checked. Nevertheless, we have upwardly revised the price forecast for gold to an average US$1,250-1,275 for 2015-16. The outlook for the physical gold market appears to be fairly strong, with record or near-record bullion imports into India in 2014:H2. The Reserve Bank of India removed the 80:20 rule on imports on November 28, 2014, under which importers had to export 20% of imported bullion before any new shipments could be made (a measure intended to shore up India’s trade balance). Interestingly, world gold mine production could actually decline in 2017, given the deferral of new mine development in recent years. After retreating to quite low levels, silver prices have also firmed up to US$17-18 per ounce, a positive development for the world’s major producers in Mexico (Penoles, Frisco) and Peru (Buenaventura, Antamina, Volcan, Hochschild and Milpo). Mexico is the world’s ‘top’ silver producer, accounting for 20.7% of world production, and Peru the second largest, with a 14.4% share. 3 January 29, 2015 Global Economics Scotiabank Commodity Price Index In line with other base metals, LME zinc prices also eased back in December and mid-January. However, prices have rebounded to US$0.96 per pound late month and are holding up well. Prices are still expected to strengthen markedly through 2016, alongside significant global mine depletion (the closure of Century in 2015:Q3 and Lisheen by early 2016). Global auto sales & production will continue to be a bright spot in the world economy, lifting demand for galvanized steel (including in China, where domestic auto manufacturers wish to improve the quality of their vehicles). Potash Spot potash prices for the standard grade (FOB Vancouver) were unchanged in December at US$320 per tonne — up only modestly from a low of US$295 in January 2014. However, the operating performance of Canada’s three major producers has improved over the past year, with record global demand in 2014 (58-60 million tonnes). North American producer sales increased by more than 10% alongside strong consumption in domestic and overseas markets (especially in Brazil). Producer inventories are in better shape than at the beginning of 2014, declining 47% yr/yr in 2014:Q3 and were likely at quite low levels in Q4. The demand outlook in 2015 could turn mixed, as Brazil’s consumption growth slows and North American application eases due to low crop prices. However, shipments to China, SE Asia and India are expected to be fairly strong. Scotiabank All Commodity Price Index 1 220 200 180 Growth Trends (per cent, annual rate) Last Year -15.4 Last 5 Years -1.8 Index: Jan. 2007=100 220 200 180 160 160 140 140 120 120 100 All Items 100 80 80 60 60 40 All Items – Inflation adjusted 2 20 20 0 40 72 74 76 78 80 82 84 86 88 90 92 94 96 98 00 02 04 06 08 10 12 14 16 0 1. A trade-w eighted U.S. dollar-based index of principal Canadian exports. 2. Index deflated by U.S. Producer Price Index for Intermediate Goods. – Shaded areas represent U.S. recession periods. 4
© Copyright 2026
