
Presentation
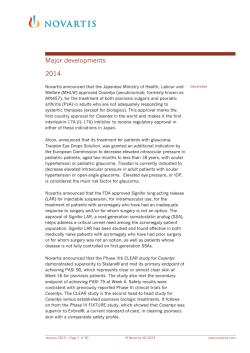
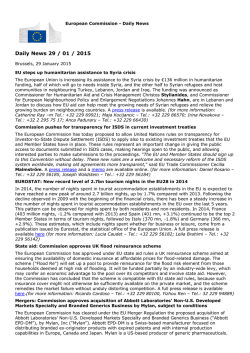
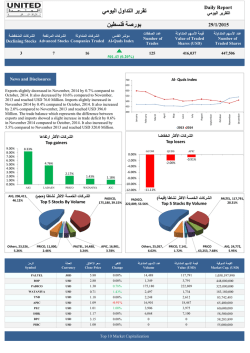
Q4 and Full Year 2014 Results Media presentation January 27, 2015 Disclaimer These materials contain forward-looking statements that can be identified by words such as “potential,” “expected,” “will,” “planned,” or similar terms, or by express or implied discussions regarding potential new products, potential new indications for existing products, or regarding potential future revenues from any such products; potential shareholder returns or credit ratings; or regarding the potential completion of the announced transactions with GSK and CSL, or regarding potential future sales or earnings of any of the businesses involved in the announced transactions with GSK, Lilly or CSL, and regarding any potential strategic benefits, synergies or opportunities as a result of the announced transactions; or regarding potential future sales or earnings of the Novartis Group or any of its divisions; or by discussions of strategy, plans, expectations or intentions. You should not place undue reliance on these statements. Such forward-looking statements are based on the current beliefs and expectations of management regarding future events, and are subject to significant known and unknown risks and uncertainties. Should one or more of these risks or uncertainties materialize, or should underlying assumptions prove incorrect, actual results may vary materially from those set forth in the forward-looking statements. There can be no guarantee that any new products will be approved for sale in any market, or that any new indications will be approved for any existing products in any market, or that any approvals which are obtained will be obtained at any particular time, or that any such products will achieve any particular revenue levels. Nor can there be any guarantee that the announced transactions with GSK and CSL will be completed in the expected form or within the expected time frame or at all. Neither can there be any guarantee that Novartis will be able to realize any of the potential strategic benefits, synergies or opportunities as a result of the transactions with GSK, Lilly or CSL. Neither can there be any guarantee that Novartis or any of the businesses involved in the transactions will achieve any particular financial results in the future. Nor can there be any guarantee that shareholders will achieve any particular level of shareholder returns. Neither can there be any guarantee that the Novartis Group, or any of its divisions, will be commercially successful in the future, or achieve any particular credit rating. In particular, management's expectations could be affected by, among other things, unexpected regulatory actions or delays or government regulation generally, including an unexpected failure to obtain necessary government approvals for the transactions, or unexpected delays in obtaining such approvals; the potential that the strategic benefits, synergies or opportunities expected from the announced transactions, including the divestment of our former Animal Health Division to Lilly, may not be realized or may take longer to realize than expected; the inherent uncertainties involved in predicting shareholder returns or credit ratings; the uncertainties inherent in research and development, including unexpected clinical trial results and additional analysis of existing clinical data; the Company’s ability to obtain or maintain proprietary intellectual property protection, including the ultimate extent of the impact on the Company of the loss of patent protection and exclusivity on key products which commenced in prior years and will continue this year; unexpected manufacturing or quality issues; global trends toward health care cost containment, including ongoing pricing pressures; uncertainties regarding actual or potential legal proceedings, including, among others, actual or potential product liability litigation, litigation and investigations regarding sales and marketing practices, government investigations and intellectual property disputes; general economic and industry conditions, including uncertainties regarding the effects of the persistently weak economic and financial environment in many countries; uncertainties regarding future global exchange rates, including as a result of recent changes in monetary policy by the Swiss National Bank and the European Central Bank; uncertainties regarding future demand for our products; uncertainties involved in the development of new healthcare products; uncertainties regarding potential significant breaches of data security or disruptions of the Company’s information technology systems; and other risks and factors referred to in Novartis AG's current Form 20-F on file with the US Securities and Exchange Commission. Novartis is providing the information in these materials as of this date and does not undertake any obligation to update any forward-looking statements as a result of new information, future events or otherwise. 2 | Novartis Q4 and FY 2014 Results | January 27, 2015 | Novartis Media Presentation Agenda Group overview Joseph Jimenez Chief Executive Officer Financial review Harry Kirsch Chief Financial Officer Pharmaceuticals David Epstein Division Head, Novartis Pharmaceuticals Closing Joseph Jimenez Chief Executive Officer Q&A session 3 | Novartis Q4 and FY 2014 Results | January 27, 2015 | Novartis Media Presentation Solid sales growth, margin expansion and major innovation in 2014 Sales up +3% in cc vs. PY, core margin +1.2ppts in cc vs. PY and FCF up +12% in USD1 Dividend of CHF 2.60 per share proposed (up 6% in CHF) Strong progress on innovation • LCZ696 file submitted in EU and US • Zykadia™ approved in US for non small cell lung cancer • Cosentyx™ approved in EU, US and Japan for psoriasis2 Portfolio transformation on track; Novartis Animal Health divestment closed on Jan 1st 1 2 4 2014 Group growth rates are based on 2013 data excluding the divested blood transfusion diagnostics unit. This measure, as well as constant currencies (cc), core results, and free cash flow are non-IFRS measures. An explanation of these non-IFRS measures and reconciliation tables can be found beginning on page 54 of the Condensed Financial Report CosentyxTM EU and US approval received in January 2015 | Novartis Q4 and FY 2014 Results | January 27, 2015 | Novartis Media Presentation Summary of 2014 financial results FY (in USD m) 2014 Net Sales 57 996 1 3 Core Operating Income 14 616 3 8 Operating Income 10 736 1 7 Net Income 10 280 12 19 Core EPS (USD) 5.23 4 10 EPS (USD) 4.21 14 20 10 762 12 Free Cash Flow 1 5 Change vs. PY1 % USD % cc 2014 Group growth rates are based on 2013 data excluding the divested blood transfusion diagnostics unit. This measure, as well as constant currencies (cc), core results, and free cash flow are non-IFRS measures. An explanation of these non-IFRS measures and reconciliation tables can be found beginning on page 54 of the Condensed Financial Report | Novartis Q4 and FY 2014 Results | January 27, 2015 | Novartis Media Presentation 2014 focus Strengthened innovation Operational excellence Delivered strong financial results Continued focus on quality Transforming the portfolio1 Transforming the company Capturing cross-divisional synergies Reshaping the culture of the company 1 6 All uncompleted transactions are subject to closing conditions | Novartis Q4 and FY 2014 Results | January 27, 2015 | Novartis Media Presentation We have seen a series of important innovations and regulatory approvals in the last year 1 2 7 Operational excellence Strengthened innovation Approval US LCZ696 Ph III in chronic heart failure, file submitted EU and US Cosentyx™ approved in EU, US and Japan for psoriasis1 QVA149 and NVA237 met primary Ph III endpoints, file submitted US CTL019 FDA Breakthrough Therapy designation FDA granted accelerated approval for Meningitis B2 Recommended for approval by FDA Advisory Committee, all indications3 Positive CHMP recommendation for polycythemia vera4 CosentyxTM EU and US approval received in January 2015 Bexsero® FDA accelerated approval received in January 2015 | Novartis Q4 and FY 2014 Results | January 27, 2015 | Novartis Media Presentation 3 4 Filgrastim recommended for approval by FDA Advisory Committee in January 2015 Jakavi® recommended for approval by CHMP in January 2015 Operational excellence Delivered financial results Growth in sales and core operating income across all divisions Net sales 2014 % Change vs. PY (in USD m) (in cc) Pharmaceuticals 31 791 Alcon 10 827 Sandoz Consumer Health Vaccines1 1 2 8 9 562 4 279 1 537 Net sales Core Operating Income +1% +4% +6% +8% +7% +7% +8% +72%2 +10% +5%2 Vaccines growth rates are based on 2013 data excluding the divested blood transfusion diagnostics unit. Vaccines results exclude certain intellectual property rights and related other revenues which will be retained by Novartis and are now reported under Corporate activities, with 2013 reported results being restated for this impact. See page 54 of the Condensed Interim Financial Report Includes cessation of depreciation since portfolio transformation announcement date of +13% pts for Consumer Health and +31% pts for Vaccines. Lower loss in Vaccines for 2014 | Novartis Q4 and FY 2014 Results | January 27, 2015 | Novartis Media Presentation Operational excellence Delivered financial results Two factors continue to drive our growth Growth Products +18% Emerging Growth Markets 1 +11% growth to 32% of Group sales 1 9 Emerging Growth Markets 2014 vs. PY (% cc). Group growth rates based on 2013 data excluding the divested blood transfusion diagnostics unit. See page 83 of the Condensed Interim Financial Report | Novartis Q4 and FY 2014 Results | January 27, 2015 | Novartis Media Presentation Transforming the company Portfolio transformation Novartis portfolio transformation is progressing on track Milestones1 9 Jan 2014 22 Apr 1 Jul Closed divestiture of blood transfusions diagnostics business Announced agreements to: Acquire GSK oncology Established Novartis Business Services products Create Consumer Health JV with GSK Divest Novartis Vaccines (excl. flu) Divest Novartis Animal Health to Eli Lilly 1 All uncompleted transactions are subject to closing conditions 10 | Novartis Q4 and FY 2014 Results | January 27, 2015 | Novartis Media Presentation 26 Oct 1 Jan 2015 Announced Closed agreement to divestiture of divest flu animal health business to CSL business Transforming the company We created Novartis Business Services to deliver high-quality services to the divisions at lower costs Cross-divisional opportunities Key 2014 activities New cross-divisional organization structure in place Costs under NBS responsibility were flat in 2014, at 2013 levels Additional synergies e.g., through Customers First 11 | Novartis Q4 and FY 2014 Results | January 27, 2015 | Novartis Media Presentation Version 20 Jan 15 - 16.00 Agenda Group overview Joseph Jimenez Chief Executive Officer Financial review Harry Kirsch Chief Financial Officer Pharmaceuticals David Epstein Division Head, Novartis Pharmaceuticals Closing Joseph Jimenez Chief Executive Officer Q&A session 12 | Novartis Q4 and FY 2014 Results | January 27, 2015 | Novartis Media Presentation Performance delivered as per upgraded guidance 2014 Full Year Guidance1 (all in cc) FY 2014 (growth vs. PY2 in % cc) Group sales are expected to grow at a low to mid-single digit rate +3% Group core operating income is expected to grow ahead of sales (cc) in 2014, at a mid to high-single digit rate (cc) +8% Pharmaceuticals sales growth in line with 2013 +1% Alcon sales growth mid to high-single digit +6% Sandoz sales growth mid to high-single digit +7% Net Sales Growth: 1 2 Issued in Q2 2014, reconfirmed in Q3 2014 2014 Group growth rates are based on 2013 data excluding the divested blood transfusion diagnostics unit. This measure, as well as constant currencies (cc), core results, and free cash flow are non-IFRS measures. An explanation of these non-IFRS measures and reconciliation tables can be found beginning of page 54 of the Condensed Financial Report 13 | Novartis Q4 and FY 2014 Results | January 27, 2015 | Novartis Media Presentation All divisions contributed to FY Group core margin improvement of 1.2% points FY 2014 vs. PY Net sales (in % cc) Core operating income (in % cc) Pharmaceuticals 1 4 29.9 1.1 Alcon 6 8 35.2 0.6 Sandoz 7 7 16.4 0.1 Consumer Health 8 72 10.6 4.33 10 5 nm nm3 3 8 25.2 1.23 Vaccines1,2 Group1 1 2 3 Core ROS (%) Core margin change in cc (% pts) 2014 Group and Vaccines growth rates are based on 2013 data excluding the divested blood transfusion diagnostics unit. This measure, as well as constant currencies (cc), core results, and free cash flow are non-IFRS measures. An explanation of these non-IFRS measures and reconciliation tables can be found beginning of page 54 of the Condensed Financial Report Vaccines results exclude certain intellectual property rights & related other revenues which will be retained by Novartis and now reported under Corporate activities, with 2013 reported results being restated for this impact Includes cessation of depreciation since portfolio transformation announcement date of +0.9% pts for Consumer Health, +6.1% pts for Vaccines, and +0.2% pts for total Group 14 | Novartis Q4 and FY 2014 Results | January 27, 2015 | Novartis Media Presentation FY Free Cash Flow of USD 10.8 bn, USD 1.2 bn higher than 2013 FY Free Cash Flow (in USD bn) +1.2 1 10.8 9.6 3.1 FY 2013 1 2 4.4 Q4 9M Key reasons for variance vs. PY: Higher operating income2 (net of negative FX) Hedging gains Higher investments in intangible assets FY 2014 2014 Group growth rates are based on 2013 data excluding the divested blood transfusion diagnostics unit. This measure, as well as constant currencies (cc), core results, and free cash flow are non-IFRS measures. An explanation of these non-IFRS measures and reconciliation tables can be found beginning of page 54 of the Condensed Financial Report Operating income after adjusting for non-cash items 15 | Novartis Q4 and FY 2014 Results | January 27, 2015 | Novartis Media Presentation Increasing negative currency impact in Q4 due to weakening of Euro, Yen, Ruble and key Emerging Market currencies Currency impact vs. PY (in % points) Net sales Core operating income 0 -2 -1 -2 -3 -6 -7 -8 -8 -3 -6 -8 -4 -12 Q4 2013 Q1 Q2 Q3 2014 Q4 FY Q4 20151 2013 FY impact: -2% Q1 Q2 Q3 2014 Q4 FY 20151 FY impact: -5% Jan 8, 2015 rate prevailing 1 Continuing Operations impact only, assuming the stated FX rates prevail for the remainder of 2015 16 | Novartis Q4 and FY 2014 Results | January 27, 2015 | Novartis Media Presentation Jan 16, 2015 rate prevailing Outlook for continuing operations in 2015 versus continuing operations in 2014 Barring unforeseen events Continuing operations1 net sales expected to grow mid-single digit (cc)2: • Pharmaceuticals: mid-single digit growth (cc) • Alcon: mid to high-single digit growth (cc) • Sandoz: mid-single digit growth (cc) Continuing operations1 core operating income expected to grow ahead of sales at a high-single digit rate (cc)2 Outlook based on a modelling assumption that the transaction with GSK will close on March 31, 2015, and that the transaction with CSL will close on December 31, 20153 1 2 3 Continuing operations includes Pharmaceuticals, Alcon, Sandoz, Corporate, the to be acquired Oncology assets from GSK and contribution from the OTC Joint Venture (contribution in income from associated companies). The results from the oncology assets from GSK and the OTC Joint Venture are only included as of the date of closing Pro-forma growth, assuming continuing operations in 2014 and 2015 Assumption for modelling purposes only. Novartis continues to expect the GSK transactions to be completed in the first-half of 2015 and the transaction with CSL to be completed in the second-half of 2015 17 | Novartis Q4 and FY 2014 Results | January 27, 2015 | Novartis Media Presentation Improvement in core margin expected despite FX headwind in 2015 Illustrative 2015 core ROS1 Continuing operations (cc) 2 3 2014 reported core ROS1 Continuing operations 27.7% 1 Portfolio transformation Outlook Sales: mid-single digit (cc) growth Core operating income: high-single digit (cc) growth 2014 reported core ROS1 Total Group 25.2% 1 2 Core return on sales Assuming Jan 16, 2015 rates prevail for the remainder of 2015 18 | Novartis Q4 and FY 2014 Results | January 27, 2015 | Novartis Media Presentation FX impact on sales2: -7% FX impact on core operating income2: -12% 2015 core ROS1 Continuing operations (USD2) Improvement between reported Total Group 2014 core margin and 2015 continuing operations core margin, despite FX impact 18th consecutive dividend growth proposed1 (payout ratio of 71%2 in 2014) 3.50 2.00 CHF USD 2.60 2.963 2.50 2.45 2.76 3.00 1.50 1.00 Proposed1 dividend growth 2014 vs. 2013: 6% in CHF, 7% in USD 0.50 0.00 1996 1997 1998 1999 2000 2001 2002 2003 2004 2005 2006 2007 2008 2009 2010 2011 2012 2013 2014 1 2 3 Proposal to shareholders at the 2015 Annual General Meeting, taking place on February 27, 2015 Payout ratio is calculated by converting into USD the proposed total gross dividend amount in CHF at the CHF-USD exchange rate of January 21, 2015 based on an estimated number of shares outstanding on dividend payment date and dividing it by the USD consolidated net income attributable to shareholders of Novartis AG in the 2014 Novartis Group consolidated financial statements effective December 31, 2014 Dividend per share in USD is calculated by converting into USD the proposed dividend per share in CHF at the CHF-USD exchange rate of January 21, 2015 (1 CHF=USD 1.14) 19 | Novartis Q4 and FY 2014 Results | January 27, 2015 | Novartis Media Presentation Agenda Group overview Joseph Jimenez Chief Executive Officer Financial review Harry Kirsch Chief Financial Officer Pharmaceuticals David Epstein Division Head, Novartis Pharmaceuticals Closing Joseph Jimenez Chief Executive Officer Q&A session 20 | Novartis Q4 and FY 2014 Results | January 27, 2015 | Novartis Media Presentation Pharmaceuticals delivered sales growth with margin expansion Change vs. PY (in USD m) FY 2014 FY 2013 Net Sales 31 791 32 214 -1 +1 Core Operating Income 9 514 9 523 0 +4 Operating Income 8 471 9 376 -10 -5 Core Operating Income margin 29.9% 29.6% Operating Income margin 26.6% 29.1% Free Cash Flow 7 918 8 332 21 | Novartis Q4 and FY 2014 Results | January 27, 2015 | Novartis Media Presentation % USD -5 % cc Growth products1 now represent 43% of total division sales Growth products net sales (in USD bn) +17% cc 13.7 12.0 FY 2013 FY 2014 % of total division sales 37% 1 43% Growth products comprise products launched in 2009 or later, or products with exclusivity until at least 2018 in key markets (EU, US, Japan) 22 | Novartis Q4 and FY 2014 Results | January 27, 2015 | Novartis Media Presentation Emerging Growth Markets1: accelerated growth to double-digit and now contributing 26% of Pharmaceuticals sales Pharmaceuticals Division net sales (in %) Emerging Growth Markets rates (in % cc) 26% 74% Emerging Growth Markets 1 Established Markets 2012 6% 2013 9% 2014 11% 2015 Growth likely to be lower Emerging Growth Markets comprise of all markets other than the Established Markets of the US, Canada, Western Europe, Japan, Australia and New Zealand 23 | Novartis Q4 and FY 2014 Results | January 27, 2015 | Novartis Media Presentation Unparalleled growth platform1 with exclusivity until 2018 and beyond FY 2014 Net sales USD m Indication Multiple sclerosis 2 477 30% 2 441 5% 1 575 22% Chronic myeloid leukemia 1 529 24% Diabetes mellitus, Type 2 1 224 Wet age-related macular degeneration, Diabetic macular edema, Retinal vein occlusion, mCNV Metastatic renal cell carcinoma, TSC SEGA, pNET, HR+/HER2-advanced breast cancer Severe allergic asthma and chronic spontaneous 1 2 Chronic obstructive pulmonary disease 484 Myelofibrosis 279 Key products for growth of Pharmaceuticals Division Impacted by Galvus in Germany, where distribution was stopped July 1, 2014. Excluding Germany, FY growth vs. PY is +15% 24 | Novartis Q4 and FY 2014 Results | January 27, 2015 | Novartis Media Presentation 6% 2 777 urticaria 3 FY 2014 Growth vs. PY % cc 3 4 30% 4 93% 72% Onbrez® Breezhaler® approved as Arcapta® Neohaler® in the US Net sales and growth of Onbrez®, Seebri® and Ultibro® 4 Cosentyx™ (secukinumab) showed superiority to Stelara® in head-to-head CLEAR study (Psoriasis) Psoriasis sales and growth1 CosentyxTM (formerly AIN457) showed superiority to (in USD m) 5 896 6 000 +22% Enbrel ® 4 960 CAGR (09-14) 5 000 Humira ® 4 149 4 000 Remicade ® 3 459 2 862 3 000 Stelara ® 2 209 Ciclosporin 2 000 Methotrexate 1 000 Acitretin 0 2009 2010 2011 2012 2013 MAT Oct'14 Etretinate Stelara® in the CLEAR study (PASI 90 at week 16)2 1st approved anti-IL17A (approved as 1st line systemic therapy in EU) • Japan - first approval in Dec • EU and US - approval in Jan Cosentyx is highly differentiated in the market place • Superior efficacy vs. Stelara® and Enbrel®3 • Sustainability of response • Favorable safety profile • Monthly maintenance regimen Note: Stelara® and Remicade® are registered trademarks of Janssen Biotech, Inc., Enbrel ® is a registered trademark of Amgen Inc., Humira® is a registered trademark of AbbVie Ltd. PASI90 = 90% reduction in Psoriasis Area Severity Index from baseline 1 Sales from US, Japan, Top-5 EU. Source: IMS PADDS Monthly, Oct ’14. Compound Annual Growth Rate (CAGR) ‘09-’14 2 Novartis, Data on file 3 Langley RG, Elewski BE, Lebwohl M, et al. NEJM 2014. Jul 9;371(4):326-38 25 | Novartis Q4 and FY 2014 Results | January 27, 2015 | Novartis Media Presentation Cosentyx™: Novartis is working to be the 1st company to launch an anti-IL17A with three indications in label FUTURE 2 (PsA) - Rapid and Significantly Improved ACR20 Responses 60 54.0% 51.0% % Responders (ACR 20) 50 40 30 • Efficacy in both anti-TNF-naive and anti-TNF-IR groups 29.3% 20 • PsA: >50% ACR 20 responders at week 24 15.3% 10 0 0 1 2 3 4 8 12 16 20 Secu 300 mg Secu 75 mg • AS: unprecedented sustained efficacy; at week 52, >75% of patients achieved ASAS 20, >60% achieved ASAS 40 (secondary endpoint) 24 Weeks Secu 150 mg Placebo MEASURE 1 (AS) - Sustained ASAS 20 Response Through Week 52 Cosentyx™ will compete in three high growth segments2 100 Primary Endpoint % Responders (ASAS 20) 80 76.7% 71.3% 60.8% 60 40 0 0 4 8 12 16 20 24 28 32 36 40 44 Secu 10 mg/kg i.v. 150 mg s.c. Secu 10 mg/kg i.v. 75 mg s.c. 48 52 Weeks Placebo Note: Secu= Secukinumab; i.v. = intravenous; s.c. = sub-cutaneous 26 • Psoriasis USD 6bn (+22%)2 • Psoriatic Arthritis (PsA) USD 3bn (+22%)2 • Ankylosing Spondylitis (AS) USD 2bn (+23%)2 28.7% 20 4 landmark PsA/AS PhIII studies presented at ACR 20141 | Novartis Q4 and FY 2014 Results | January 27, 2015 | Novartis Media Presentation PsA = Psoriatic Arthritis. AS = Ankylosing spondylitis. TNF = Tumor Necrosis factor. ACR20 = reduction by 20% in American College of Rheumatology response criteria, ASAS 20/40 = 20%/40% improvement in the Assessment of Spondyloarthritis International Society criterion 1 American College of Rheumatology (November 2014) 2 Sales MAT Oct. 2014 from US and Top-5 EU. Psoriasis includes Japan as well. Source: IMS PADDS Monthly, Oct ‘14. CAGR (‘09-’14) LCZ696: Additional clinical data; accelerated regulatory reviews PARADIGM-HF cause of death data1 25 % of patients 20 -16% p<0.001 -20% -20% -21% p<0.001 p=0.008 p=0.034 Enalapril 15 10 19.8 17.0 0 16.5 7.4 6.0 All causes CV causes Sudden Death 4.4 3.5 Pump Failure Novartis Data on File. Presented at AHA by J. McMurray Nov. 17, 2014 Packer et al. Circulation 2014; epub ahead of print: DOI: 10.1161 / CIRCULATION AHA.114.013748 27 New data shows LCZ696 has potential to reduce the risk of clinical progression of heart failure1,2 Patients in LCZ696 group were less likely to2 : • Require hospitalization for a cardiovascular 13.3 2 EMA and Swissmedic granted Accelerated Review LCZ696 5 1 Submission in EU and US completed | Novartis Q4 and FY 2014 Results | January 27, 2015 | Novartis Media Presentation reason (12%) or for any reason (12%) • Require an emergency room visit for heart failure (34%) • Require intensive care (13%) Currently expected Pharmaceuticals newsflow highlights H1 2015 H2 2015 28 Cosentyx™ EU approval in psoriasis Cosentyx™ FDA action in psoriasis Jakavi® CHMP opinion in polycythemia vera Exjade® FDA action in new formulation film coated tablets CosentyxTM Regulatory filings in US and EU for ankylosing spondylitis and psoriatic arthritis Zykadia™ CHMP opinion in ALK+ NSCLC BKM120 US, EU & Japan submission in mBC ER+: combo with Fulvestrant, mTOR naive LDE225 FDA action in advanced basal cell carcinoma LDE225 CHMP opinion in advanced basal cell carcinoma LCZ696 FDA action in chronic heart failure with reduced ejection fraction LCZ696 CHMP opinion in chronic heart failure with reduced ejection fraction QVA149/NVA237 FDA action in chronic obstructive pulmonary disease (COPD) | Novartis Q4 and FY 2014 Results | January 27, 2015 | Novartis Media Presentation Agenda Group overview Joseph Jimenez Chief Executive Officer Financial review Harry Kirsch Chief Financial Officer Pharmaceuticals David Epstein Division Head, Novartis Pharmaceuticals Closing Joseph Jimenez Chief Executive Officer Q&A session 29 | Novartis Q4 and FY 2014 Results | January 27, 2015 | Novartis Media Presentation We are delivering against our priorities Strong 2014 financial results Strong innovation news adding to momentum Progress on portfolio transformation and NBS 30 | Novartis Q4 and FY 2014 Results | January 27, 2015 | Novartis Media Presentation Our priorities in 2015 are expected to continue to position us for future success 2015 priorities 31 1 2 3 4 5 Strong financial results and discipline Strengthen innovation Complete the portfolio transformation Capture cross-divisional synergies Build a high-performing organization | Novartis Q4 and FY 2014 Results | January 27, 2015 | Novartis Media Presentation Agenda Group overview Joseph Jimenez Chief Executive Officer Financial review Harry Kirsch Chief Financial Officer Pharmaceuticals David Epstein Division Head, Novartis Pharmaceuticals Closing Joseph Jimenez Chief Executive Officer Q&A session 32 | Novartis Q4 and FY 2014 Results | January 27, 2015 | Novartis Media Presentation Q&A

© Copyright 2026