
Analysis of ozone and aerosols during the ADRIMED
This discussion paper is/has been under review for the journal Atmospheric Chemistry
and Physics (ACP). Please refer to the corresponding final paper in ACP if available.
Discussion Paper
Atmos. Chem. Phys. Discuss., 15, 3063–3125, 2015
www.atmos-chem-phys-discuss.net/15/3063/2015/
doi:10.5194/acpd-15-3063-2015
© Author(s) 2015. CC Attribution 3.0 License.
|
3
1
1
1
Introduction
Conclusions
References
Tables
Figures
J
I
J
I
Back
Close
|
3063
Title Page
Abstract
Discussion Paper
Laboratoire de Météorologie Dynamique, UMR CNRS 8539, Ecole Polytechnique, Ecole
Normale Supérieure, Université P. M. Curie, Ecole Nationale des Ponts et Chaussées,
Palaiseau, France
2
Laboratoire Inter-Universitaire des Systèmes Atmosphériques, UMR CNRS 7583, Université
Paris Est Créteil et Université Paris Diderot, Institut Pierre Simon Laplace, Créteil, France
3
Institut National de l’Environnement Industriel et des Risques, Verneuil en Halatte, 60550,
Parc Technologique ALATA, France
4
Laboratoire d’Aérologie, UMR CNRS 5560, Université P. Sabatier, Toulouse, France
5
Laboratoire des Sciences du Climat et de l’Environnement, UMR CNRS 8212, CEA,
Université Versailles St Quentin, Gif sur Yvette, France and The Cyprus Institute, Environment
Energy and Water Research Center, Nicosia, Cyprus
L. Menut et al.
|
2
Analysis of ozone
and aerosols during
the ADRIMED
experiment
Discussion Paper
1
15, 3063–3125, 2015
|
1
L. Menut , S. Mailler , G. Siour , B. Bessagnet , S. Turquety , G. Rea ,
R. Briant1 , M. Mallet4 , J. Sciare5 , and P. Formenti2
Discussion Paper
Ozone and aerosols tropospheric
concentrations variability analyzed using
the ADRIMED measurements and the
WRF-CHIMERE models
ACPD
Full Screen / Esc
Printer-friendly Version
Interactive Discussion
Correspondence to: L. Menut ([email protected])
Published by Copernicus Publications on behalf of the European Geosciences Union.
Discussion Paper
Received: 15 January 2015 – Accepted: 16 January 2015 – Published: 2 February 2015
|
Discussion Paper
15, 3063–3125, 2015
Analysis of ozone
and aerosols during
the ADRIMED
experiment
L. Menut et al.
Title Page
|
Abstract
Introduction
Discussion Paper
Conclusions
References
Tables
Figures
J
I
J
I
|
Back
Close
Discussion Paper
|
3064
ACPD
Full Screen / Esc
Printer-friendly Version
Interactive Discussion
5
L. Menut et al.
Title Page
Abstract
Introduction
Conclusions
References
Tables
Figures
J
I
J
I
Back
Close
Discussion Paper
|
3065
Analysis of ozone
and aerosols during
the ADRIMED
experiment
|
25
The Euro-Mediterranean region is surrounded by many urbanized and agricultural
lands in the north, and arid regions in the south. This leads to numerous different pollution sources with a majority of anthropogenic and biogenic sources in the north and
mineral dust in the south. In addition, and mainly during summer, vegetation fires are
often observed. As previously studied by Moulin et al. (1998); Middleton and Goudie
(2001); Kubilay et al. (2003) and Israelevich et al. (2012), among others, the summer
period is characterized by a south to north flow from Africa, transporting mineral dust in
15, 3063–3125, 2015
Discussion Paper
20
Introduction
ACPD
|
1
Discussion Paper
15
|
10
The ozone and aerosols concentrations variability is studied over the EuroMediterranean area during the months of June and July 2013 and in the framework
of the ADRIMED project. A first analysis is performed using meteorological variables,
ozone and aerosols concentrations using routine stations network, satellite and specific
ADRIMED project airborne measurements. This analysis is complemented by modelling using the WRF and CHIMERE regional models. It is shown that this period was
not highly polluted, with a moderate ozone production and several precipitation periods,
scavenging the aerosols. In addition, no significant vegetation fires events were observed. The CHIMERE model simulating all kind of sources (anthropogenic, biogenic,
mineral dust, vegetation fires) for numerous aerosols species, the aerosol speciation
was quantified: during the whole period, the aerosols were mainly constituted by mineral dust, sea salt and sulphates close to the surface, and mainly mineral dust in the
troposphere. Compared to AERONET size distribution, it is shown that the model underestimates the coarse mode near mineral dust sources and overestimates the fine
mode in the Mediterranean area, even if the total mass of aerosols and the optical
depth are correctly reproduced.
Discussion Paper
Abstract
Full Screen / Esc
Printer-friendly Version
Interactive Discussion
3066
|
15, 3063–3125, 2015
Analysis of ozone
and aerosols during
the ADRIMED
experiment
L. Menut et al.
Title Page
Abstract
Introduction
Discussion Paper
Conclusions
References
Tables
Figures
J
I
J
I
|
Back
Close
Discussion Paper
25
ACPD
|
20
Discussion Paper
15
|
10
Discussion Paper
5
the free troposphere, and a north to south flow transporting trace gases and particles
of anthropogenic origin in the boundary layer, as summarized in Fig. 1.
In order to study the atmospheric composition over this region, the experimental part
of the “Aerosol Direct Radiative Impact on the regional climate in the MEDiterranean
region” (ADRIMED) project (Mallet, 2014) was conducted during the summer of 2013.
ADRIMED is part of the international program ChArMEx (Dulac et al., 2013), aiming
at assessing the present and future state of atmospheric chemistry in the Mediterranean area and its impact on regional climate, air quality, and marine ecosystems.
This project completements several previous studies dedicated to the analysis of ozone
and aerosols over the Mediterranean area.
Gerasopoulos et al. (2005) showed that ozone is controlled by production over the
continent and may reach up to 60 ppb in the eastern Mediterranean marine boundary layer. Kalabokas et al. (2008) showed that the high concentrations observed are
mainly driven by the anticyclonic meteorological conditions occuring during the summer. During the MINOS campaign (Lelieveld et al., 2002), conducted in altitude and
over the same region, Roelofs et al. (2003) reported ozone concentrations of about
50 ppb, with peaks reaching 120 ppb. Lidar observations of ozone undertaken during
the ESCOMPTE campaign (Cros et al., 2004) in Summer in the western part of the
Mediterranean showed that highly concentrated plumes may be formed over a given
country and be transported on several hundred of kilometers, before reaching ground
levels (Colette et al., 2006).
Aerosols are also highly variable in space, time and composition. The latter depends
on the relative contribution of various chemical species such as organic matter, sulphates, nitrates, ammonium, mineral dust and sea salt (Millan et al., 2005; Monks
et al., 2009). Many experimental research programs were recently conducted to characterize the aerosols life cycle using surface measurements (Querol et al., 2009), airborne measurements (Dulac and Chazette, 2003), optical thicknesses deduced from
sunphotometers (Kubilay et al., 2003), lidar measurements (including EARLINET) (Papayannis et al., 2008; Pappalardo et al., 2014) or satellite data (Barnaba and Gobbi,
Full Screen / Esc
Printer-friendly Version
Interactive Discussion
3067
|
15, 3063–3125, 2015
Analysis of ozone
and aerosols during
the ADRIMED
experiment
L. Menut et al.
Title Page
Abstract
Introduction
Discussion Paper
Conclusions
References
Tables
Figures
J
I
J
I
|
Back
Close
Discussion Paper
25
ACPD
|
20
Discussion Paper
15
|
10
Discussion Paper
5
2004). Remote-sensing surface measurements are also used to better quantify the
dust optical properties and direct radiative forcing as in (Bergamo et al., 2008; Basart
et al., 2009; Mallet et al., 2013; di Sarra et al., 2008). The integrated project EUCAARI
(Kulmala et al., 2011), was conducted to better characterize the aerosols life cycle and
composition in Europe, integrating many types of aerosols studies, from the nano to
the global scales, with a large scientific community.
These measurements have been accompanied by significant developments in regional and global chemistry transport model (CTM). For example, ozone was simulated
using the CHIMERE regional CTM during the ESCOMPTE campaign (Menut et al.,
2005) and the summertime ozone maximum was analyzed using the TOMCAT global
CTM Richards et al. (2013). Aerosols observations in the Mediterranean area often
show large contributions from mineral dust, so that numerous studies were devoted to
this species (Pérez et al., 2011; Nabat et al., 2012; Menut et al., 2013b; de la Paz et al.,
2013). Their impact on climate via their radiative effect was recently analyzed with the
models COSMO (Vogel et al., 2009), RegCM (Santese et al., 2010), SKYRON (Spyrou
et al., 2013) and ALADIN-Climate (Nabat et al., 2014). Other important and still not
well represented natural sources are now also included in CTMs. For example, sea
salt were modelled in (Jiménez-Guerrero et al., 2011) and vegetation fires in (Turquety
et al., 2014).
All these studies show that the ozone and aerosols are difficult to model in this region.
Due to many different sources and their large variability, models have to include an
accurate representation of all possible sources at the same time and of numerous
chemical species, as well as the possibility to simulate the hourly concentrations.
The main purpose of this study is to better understand ozone and aerosols content
in the lower troposphere over the Mediterranean area, using a combined analysis of
atmospheric measurements and regional CTM simulations. The analyzed time period,
from 1 June to 15 July 2013, is focused on the ADRIMED intensive campaign. The main
questions addressed in this article are: Was this period highly polluted in ozone and
aerosols? What is the chemical composition of these aerosols? Is there a significant
Full Screen / Esc
Printer-friendly Version
Interactive Discussion
Title Page
Introduction
Conclusions
References
Tables
Figures
J
I
J
I
Back
Close
|
3068
L. Menut et al.
Abstract
Discussion Paper
In this study, observations from both routine measurements and the ADRIMED intensive campaign are used.
In order to analyze meteorological parameters, the surface measurements provided
by the E-OBS database are used. For ozone surface concentrations, observations from
the EEA network are used. For aerosols, measurements from the AERONET photome-
Analysis of ozone
and aerosols during
the ADRIMED
experiment
|
25
Observations
15, 3063–3125, 2015
Discussion Paper
2
ACPD
|
20
Discussion Paper
15
|
10
Discussion Paper
5
difference in this composition close to the surface and in altitude? What is the variability
of the size distribution of these aerosols? The studied region encompasses North Africa
and Europe, in order to take into account all possible ozone precursors and aerosols
sources, and allow contributions from long-range transport.
To address these questions, this study follows three steps. First, measurements are
analyzed to estimate when and where were the most important concentrations of ozone
and aerosols observed in the Mediterranean area. Secondly, the ADRIMED period is
simulated using the WRF-CHIMERE regional system. Comparisons between simulations and the available measurements allows an evaluation of the ability of the models
to correctly reproduce the concentrations. Thirdly, having in mind the strengths and
weaknesses of the modelling system, the ozone and aerosols composition is further
analyzed. For ozone, the variability is quantified both at the surface and in altitude.
For aerosols, the model provides additional informations such as composition and size
distribution.
Section 2 presents the experimental framework of the ADRIMED campaign and the
whole set of data (surface, soundings, aircraft measurements, satellite) used in this
study. Section 3 presents the modelling system and the settings. Section 4 analyzes
the meteorological situation using E-OBS data and the WRF model. Sections 5, 6 and
7 present ozone concentrations, aerosols optical depth and aerosols concentrations
results, respectively. Sections 8 and 9 present aerosols speciation and size distribution.
Conclusions and perspectives are presented in Sect. 10.
Full Screen / Esc
Printer-friendly Version
Interactive Discussion
In order to the modelled meteorology, comparisons with the daily average 2 m temperature and precipitation amount taken from the European Climate Gridded dataset
(E-OBS) (Haylock et al., 2008) are undertaken. This dataset contains data collected
from several thousands of meteorological stations throughout Europe and the Mediterranean area. These data are processed through a series of quality tests to remove
errors and unrealistic values.
Title Page
Introduction
Conclusions
References
Tables
Figures
J
I
J
I
Back
Close
|
3069
L. Menut et al.
Abstract
Discussion Paper
25
Analysis of ozone
and aerosols during
the ADRIMED
experiment
|
20
For regulatory pollutants, many measurements are routinely performed and well organized in homogeneous databases. The EEA (European Environmental Agency, (Guerreiro et al., 2013)) is responsible for the AirBase database used in this study. It contains
surface concentrations measurements and information submitted by the participating
countries throughout Europe (http://www.eea.europa.eu/). For this study, we focused
on ozone and PM10 . In order to calculate scores and to study time series, a subset of
data is used, including 8 “coastal background” and 9 “continental background” stations.
Their location is displayed in Fig. 2 and details about their coordinates are provided in
Table 1. They were chosen to be representative of various locations around the Western Mediterranean Sea: Spain, France and Italy, including the Baleares, Corsica and
Lampedusa islands. These stations are all “background” stations, to ensure a correct
representativity between the measured and the modelled values.
15, 3063–3125, 2015
Discussion Paper
15
EEA chemical measurements
ACPD
|
2.2
Discussion Paper
10
E-OBS meteorological measurements
|
2.1
Discussion Paper
5
ters are used, both for aerosol optical depth and size distribution. In order to have
an overview of AOD over the whole region and the whole summer, satellite observations from the MODIS instrument are also used. The aircraft observations from the
ADRIMED project are used to more finely analyze the vertical distribution of ozone.
The location of the measurement sites used in this study is summarized in Table 1.
Full Screen / Esc
Printer-friendly Version
Interactive Discussion
5
ADRIMED measurements
The modelling system is composed of several models: the WRF regional meteorological model, the CHIMERE CTM and additional individual models dedicated to emissions
fluxes estimations. All these models are integrated in a modelling plat-form usable both
Title Page
Introduction
Conclusions
References
Tables
Figures
J
I
J
I
Back
Close
|
3070
L. Menut et al.
Abstract
Discussion Paper
Modelling system
Analysis of ozone
and aerosols during
the ADRIMED
experiment
|
3
15, 3063–3125, 2015
Discussion Paper
The experimental part of the ADRIMED experiments includes surface measurements
(at the super-sites of Cape Corsica and Lampedusa), remote sensing and airborne
measurements, as presented in Mallet (2014). In this study, we focus on the surface
measurements for temperature and precipitations. The airborne measurements are analyzed for ozone concentrations. These measurements were performed onboard the
ATR-42 aircraft (operated by the SAFIRE CNRS, CNES and Météo-France joint laboratory). Nine flights were conducted during the studied period. The flight numbers, date
and decimal hour, corresponding Julian day of flight are reported in Table 2. Trajectories are very different from one flight to another and are represented in Fig. 3 on a map
and in Fig. 4 to see the vertical extension of the flights.
ACPD
|
20
2.4
Discussion Paper
15
The AERONET (AErosol RObotic NETwork) photometers measurements (Holben
et al., 2001), are used to characterize the observed Aerosol Optical Depth (AOD) and
the volume Aerosol Size Distribution (ASD). The AOD data are recorded by numerous
stations deployed around the world and hourly values are available. Several quality
levels are proposed on the AERONET database (http://aeronet.gsfc.nasa.gov/). In this
study, the level 2.0 is used for AOD and the level 1.5 for ASD, (Dubovik and King, 2000).
The stations used in this study are listed in Table 1 and their location is displayed in
Fig. 2.
|
10
AERONET measurements
Discussion Paper
2.3
Full Screen / Esc
Printer-friendly Version
Interactive Discussion
3.1
5
15, 3063–3125, 2015
Analysis of ozone
and aerosols during
the ADRIMED
experiment
L. Menut et al.
Title Page
Abstract
Introduction
Discussion Paper
Conclusions
References
Tables
Figures
J
I
J
I
|
Back
Close
Discussion Paper
|
3071
ACPD
|
20
Discussion Paper
15
The meteorological variables are modelled with the non-hydrostatic WRF regional
model in its version 3.5.1 (Skamarock et al., 2007). The global meteorological analyses from NCEP/GFS are hourly read by WRF using nudging techniques for the main
atmospheric variables (pressure, temperature, humidity, wind). In order to preserve
both large-scale circulations and small scale gradients and variability, the “spectral
nudging” was chosen. This nudging was evaluated in regional models, as presented
in Von Storch et al. (2000). In this study, the spectral nudging was selected to be applied for all wavelength greater than ≈ 2000 km (wavenumbers less than 3 in latitude
and longitude, for wind, temperature and humidity and only above 850 hPa). This configuration allows the regional model to create its own structures within the boundary
layer but makes sure it follow the large scale meteorological fields.
In this study, the model is used with a constant horizontal resolution of 60 km × 60 km
and 28 vertical levels from the surface to 50 hPa, as displayed in Fig. 5. The Single
Moment-5 class microphysics scheme is used, allowing for mixed phase processes
and super cooled water Hong et al. (2004). The radiation scheme is RRTMG scheme
with the MCICA method of random cloud overlap Mlawer et al. (1997). The surface
layer scheme is based on Monin–Obukhov with Carslon–Boland viscous sub-layer. The
surface physics is calculated using the Noah Land Surface Model scheme with four soil
temperature and moisture layers Chen and Dudhia (2001). The planetary boundary
layer physics is processed using the Yonsei University scheme Hong et al. (2006) and
the cumulus parameterization uses the ensemble scheme of Grell and Devenyi (2002).
|
10
WRF meteorological model
Discussion Paper
in analysis and forecast mode. The simulation was performed from 1 June to 15 July
2013.
Full Screen / Esc
Printer-friendly Version
Interactive Discussion
5
Analysis of ozone
and aerosols during
the ADRIMED
experiment
L. Menut et al.
Title Page
Abstract
Introduction
Conclusions
References
Tables
Figures
J
I
J
I
|
Back
Close
Discussion Paper
|
3072
15, 3063–3125, 2015
Discussion Paper
25
ACPD
|
20
Discussion Paper
15
CHIMERE is a CTM allowing the simulation of concentrations fields of gaseous and
aerosols species at a regional scale. It is an off-line models, driven by pre-calculated
meteorological fields. In this study, the version fully described in Menut et al. (2013a)
is used. The simulations are performed over the same horizontal domain as the one
defined for WRF. The 28 vertical levels of the WRF simulations are projected onto 20
levels from the surface up to 300 hPa.
The chemical evolution of gaseous species is calculated using the MELCHIOR2
scheme and that of aerosols using the scheme developed by Bessagnet et al. (2004).
This module takes into account sulphate, nitrate, ammonium, primary organic matter
(POM) and elemental carbon (EC), secondary organic aerosols (SOA), sea salt, dust
and water. The aerosol size is represented using ten bins, from 40 to 40 µm, in diameter. The aerosol life cycle is completely represented with nucleation of sulphuric
acid, coagulation, adsorption/desorption, wet and dry deposition and scavenging. This
scavenging is represented by both coagulation with cloud droplets and precipitation.
The formation of SOA is also taken into account.
The photolysis rates are explicitly calculated using the FastJX radiation module (version 7.0b), (Wild et al., 2000; Bian et al., 2002). The modelled AOD is calculated by
FastJX for the 600 nm wavelength over the whole atmospheric column. A complete
analysis of the improvement obtained in the model with this on-line calculation is fully
described in a companion paper, Mailler (2014).
At the boundaries of the domain, climatologies from global model simulations are
used. In this study, outputs from LMDz-INCA (Szopa et al., 2009) are used for all
gaseous and aerosols species, except for mineral dust. For this species, simulations
from the GOCART model are used (Ginoux et al., 2001).
The anthropogenic emissions are estimated using the same methodology as the
one described in Menut et al. (2012) but with the HTAP (Hemispheric Transport of Air
Pollution) annual totals as input data. These masses were prepared by the EDGAR
|
10
CHIMERE chemistry-transport model
Discussion Paper
3.2
Full Screen / Esc
Printer-friendly Version
Interactive Discussion
Analysis of ozone
and aerosols during
the ADRIMED
experiment
L. Menut et al.
Title Page
Abstract
Introduction
Conclusions
References
Tables
Figures
J
I
J
I
|
Back
Close
This WRF model configuration was already compared to measurements for the same
kind of domain, resolution and use with the CHIMERE model in Mailler et al. (2013);
Menut et al. (2013b) and Menut et al. (2013c) for example. It was shown that the
model is able to accurately reproduce the main meteorological variables over the EuroMediterranean area and to provide realistic enough fields for chemistry-transport modelling. However, since the model results also depend on the studied period, the 2 m
Discussion Paper
3073
|
25
Analysis of meteorology
15, 3063–3125, 2015
Discussion Paper
4
ACPD
|
20
Discussion Paper
15
|
10
Discussion Paper
5
Team, using inventories based on MICS-Asia, EPA-US/Canada and TNO databases
(http://edgar.jrc.ec.europa.eu/htap_v2). Biogenic emissions are calculated using the
MEGAN emissions scheme (Guenther et al., 2006) which provides fluxes of isoprene
and monoterpenes. In addition to this version, several processes were improved and
added in the framework of this study. First, the mineral dust emissions are now calculated using new soil and surface databases, Menut et al. (2013b) and with a spatial
extension of potentially emitting areas in Europe as described in Briant et al. (2014).
Emission fluxes produced by biomass burning are estimated using the new high
resolution fire model presented in Turquety et al. (2014). Taking into account these
fluxes is a major improvement in the CHIMERE model. Figure 6 presents the location
of burned area during the summer of 2013, as detected by the MODIS satellite-based
instrument (MCD64 product at 500 m resolution, processed as described in Turquety
et al. (2014) and gridded onto the CHIMERE grid). The week number of first fire detection within each model grid cell ranges from 1 (the first week of June 2013) to 12 (the
last week of September 2013). It shows that a majority of first fire event occured during
the weeks 8 to 12, i.e. during September. These fires are mainly located in Portugal
and Russia, and to a lesser extent, Greece. For each model grid cell, the number of fire
events is presented (i.e. the number of area burned detections). For a large majority
of diagnosed fires, this number is one, showing there were not a lot of fires during the
summer of 2013.
Full Screen / Esc
Printer-friendly Version
Interactive Discussion
4.1
Daily maps
−1
5
Title Page
Introduction
Conclusions
References
Tables
Figures
J
I
J
I
Back
Close
Discussion Paper
|
3074
L. Menut et al.
|
25
Analysis of ozone
and aerosols during
the ADRIMED
experiment
Abstract
Daily time series
From the E-OBS data daily maps, time series are extracted for some sites in Europe,
as listed in Table 1. From 1 June to 15 July, for the grid cell corresponding to the
site location, daily averages of the WRF model hourly results are computed for the
2 m temperature, and values are cumulated for precipitation. These comparisons are
displayed in Fig. 8 and statistical scores are presented in Table 3.
15, 3063–3125, 2015
Discussion Paper
4.2
ACPD
|
20
Discussion Paper
15
|
10
A comparison of 2 m temperature, T2 m , (K) and precipitation amount, Pr, (mm day ) is
presented in Fig. 7. Three days are selected as representative of the studied period: 16,
20 and 24 June 2013. For each day and for the WRF results, the hourly 2 m temperature
−1
is averaged over the day and the hourly precipitation amount (mm h ) is cumulated to
−1
have mm day . For the E-OBS observations, values are available over land only. For
the WRF model, 2 m temperature and precipitation amount are available over the whole
model domain, even if this domain is limited to a maximum latitude of 55◦ N.
For the 2 m temperature, we note that the observed and modelled values are similar.
For example, and over Germany, a maximum of T2 m is observed during the 20 June,
also well modelled by WRF. For Pr, the main structures and the relative amount are also
well modelled. For the 16 June, the E-OBS data diagnosed precipitations in the western
part of UK, France and Spain. WRF is able to modelled this pattern and shows a large
precipitation system over the Atlantic sea. This system is advected to the eastern part
of Europe and the WRF model is able to reproduce this advection speed as well as
the accumulated precipitation values. These comparisons show the model is able to
reproduce the main synoptic scale absolute values and variability observed during this
period.
Discussion Paper
temperature and the precipitation amount are here compared to the available data of
E-OBS.
Full Screen / Esc
Printer-friendly Version
Interactive Discussion
(1)
Title Page
Introduction
Conclusions
References
Tables
Figures
J
I
J
I
Back
Close
|
3075
L. Menut et al.
Abstract
Discussion Paper
a
a+c
Analysis of ozone
and aerosols during
the ADRIMED
experiment
|
HR =
15, 3063–3125, 2015
Discussion Paper
25
ACPD
|
20
Discussion Paper
15
|
10
Discussion Paper
5
For T2 m , the scores show that the correlation is high, ranging from 0.87 and 0.99.
However, a non negligible bias is calculated, ranging between −4.1 and 0.87 K, showing the model mainly underestimates the E-OBS gridded values. This bias can not be
attributed to a problem of measurements vs. model representativity, the E-OBS values
◦
◦
being regridded with a 0.25 × 0.25 resolution and the model having a 60 km × 60 km
horizontal resolution. This bias is more probably due to the boundary layer or microphysics schemes used with WRF in this study. The model is able to reproduce the
main variability observed during the whole period: low temperatures observed in the
first days of June, corresponding to precipitation events, then a warmest period, with
temperatures increasing from ≈ 290 to ≈ 295 K in the 14 to 17 June. A second large
precipitation event is observed from the 18 to 25 June (except in Bastia) leading to
a slight cooling. After the 25 June, precipitations are observed and modelled, but they
are more moderate and the temperature increases from ≈ 290 to ≈ 295 K until the end
of the studied period, 14 July 2013.
These time series also show that the daily precipitation amount Pr has the same
order of magnitude in the observations and the model simulations: when a precipitation
event is observed over one site and during one day, the meteorological model is able
to capture this event. If the absolute values do not match exactly, the main effect for
atmospheric composition is present: wet scavenging would occur at the right place and
right time to remove particles in the atmosphere. In order to quantify the ability of the
model to reproduce these precipitations events in terms of aerosols scavenging, the
correlation coefficient is not the adaptated metric. We introduce the hit rate score: for
a threshold arbitrarily chosen as PrT = 0.1 mm day−1 (i.e. there is precipitation for this
day and this site), the event is considered as true if Pr > PrT . If this condition is reached
for the observations and the model, a counter increments the “a” value. If the condition
is reached for the observations and not the model, a counter increments the “c” value.
The Hit Rate, HR, is defined as:
Full Screen / Esc
Printer-friendly Version
Interactive Discussion
Simulated surface ozone concentrations are displayed in Fig. 9. The three maps are
selected to present values for the same days as for the meteorological variables in
Title Page
Introduction
Conclusions
References
Tables
Figures
J
I
J
I
Back
Close
|
3076
L. Menut et al.
Abstract
Discussion Paper
25
Ozone surface concentrations maps
Analysis of ozone
and aerosols during
the ADRIMED
experiment
|
5.1
15, 3063–3125, 2015
Discussion Paper
20
ACPD
|
15
The first comparisons between measured and modelled atmospheric composition are
undertaken for the analysis of ozone concentrations near the surface and in altitude.
Ozone reflects the amount of photo-oxidant pollution, especially during summertime
periods. Two kinds of data are used in this section: (i) the routine surface measurements of the AirBase background stations and (ii) the airborne measurements done
for ADRIMED with the ATR aircraft. The AirBase measurements are regular in time
(hourly), and are used to quantify if the model is able to simulate both the background
values and the peaks during high pollution events. However, being only at the surface, these measurements are not dedicated to provide an information on the model
behaviour in the whole troposphere. Thus, they do not allow an interpretation on the
ozone long range transport. The ATR measurements are then complementary, providing vertical ozone profiles at a given time. However, unlike surface observations, they
are very specific and do not reflect the overall situation of atmospheric pollution over
the whole Mediterranean area.
Discussion Paper
10
Analysis of ozone concentrations
|
5
Discussion Paper
5
The target value for the Hit Rate is 1, meaning that the model was able to catch
all the observed events. Results are presented in Table 4. The number of events is
also displayed since precipitations did not occur every day. The number of days under
a precipitation event is between 1 to 19 for a total of 41 studied days. The HR ranges
from 0.64 to 1, showing that the model correctly reproduces this variable. One also
notes that the mean bias is often negative, showing that the modelled precipitations
are lower than what was observed.
Full Screen / Esc
Printer-friendly Version
Interactive Discussion
Analysis of ozone
and aerosols during
the ADRIMED
experiment
L. Menut et al.
Title Page
Abstract
Introduction
Conclusions
References
Tables
Figures
J
I
J
I
|
Back
Close
Discussion Paper
25
15, 3063–3125, 2015
Discussion Paper
20
|
To better understand the daily variability observed on the maps, scores are calculated
for daily maximum and daily mean averaged values. Results are presented in Table 5
(daily maximum) and Table 6 (daily mean). The corresponding time series are presented in Fig. 10 for the daily maximum values. Results are split as a function of the
AirBase surface station type (coastal or continental).
The scores reported in Table 5 show the ability of the model to capture extreme
events. Depending on the location, the model simulates lower or higher maximum daily
values, compared to the measurements. But for all stations, the differences between
−3
the two is never more than 20 µg m . The correlations are also very dispersed, with
values ranging from 0.15 (Malaga) to 0.71 (Agen). One can expect to have better correlations over the continent than over the sea due to the formation processes of ozone.
This is not always the case, showing the difficulty of the model to estimate daily peaks
over this complex region.
The scores in Table 6 are complementary and present results for hourly values. In
this case, the complete diurnal cycle of ozone formation is taken into account. The
3077
ACPD
|
15
Ozone surface concentrations time series
Discussion Paper
5.2
|
10
Discussion Paper
5
Fig. 7. For the 16 June 2013 and over the Mediterranean sea, ozone values vary a lot,
−3
between 30 and 70 µg m , with several plumes having a spatial extent of a few tens of
kilometers only. The most important surface concentrations are modelled in the south
eastern part of the domain, over Saudi Arabia. Surface concentrations are much higher
on 20 June 2013 over Europe. This corresponds to the highest T2 m values, enhancing
the photochemical processes over anthropogenic sources such as Belgium and the
Netherlands. Over Great Britain and France, values are low and this corresponds to
cloudiness associated with the observed and modelled precipitations. On 24 June,
−3
ozone concentrations are low (less than 40 µg m ) over the whole Europe. This corresponds to the advection of this precipitation event from west to east. Finally, these
maps show that ozone concentrations were moderated during this ADRIMED period,
except over Saudi Arabia.
Full Screen / Esc
Printer-friendly Version
Interactive Discussion
Title Page
Introduction
Conclusions
References
Tables
Figures
J
I
J
I
Back
Close
|
The ozone concentrations measured during the ATR flights are averaged from 1 Hz to
a 5mn time step. The number of averaged data is reported in Table 2. The simulated
concentrations corresponding to the location of the measurement are interpolated in
3078
L. Menut et al.
Abstract
Discussion Paper
Ozone and meteorological vertical profiles during the ATR flights
Analysis of ozone
and aerosols during
the ADRIMED
experiment
|
5.3
15, 3063–3125, 2015
Discussion Paper
25
ACPD
|
20
Discussion Paper
15
|
10
Discussion Paper
5
scores are often better than for the daily peaks, with values up to 0.81 (Cordoba).
The low correlation results are obtained for Ajaccio and Malaga (0.40), Bastia (0.29)
and Gap (0.36), as already diagnosed with the daily peaks. This denotes a general
unability of the model to represent ozone formation and transport over these areas.
For these three sites, the problem is probably related to the low model resolution, these
three sites being in mountainous or insular areas, the subgrid scale variability of ozone
remains difficult to model.
Time series of measured and modelled ozone daily maximum are displayed in
Fig. 10. For the coastal stations, Ajaccio, Bastia and Zorita, the measured values
show flatter time series than the modelled ones, explaining low correlations obtained
in Ajaccio and Bastia. When the model overestimates the concentrations in Ajaccio,
it underestimates the concentrations in Bastia, even if the locations are close and located in the Corsica Island. From a model point of view, this consists in two close (but
not neighboring) grid cells. These high differences may be explained by zooming on
Corsica as displayed in Fig. 11: ozone surface concentrations (in ppb) are shown for
the 17 June 2013, 12:00 UTC, as an example. For this day, and more generally for
the whole ADRIMED period, surface ozone concentrations are very variable and composed of very dense and isolated plumes. This explains the large variability of scores
when comparing point by point model and surface measurements, even if the horizontal
resolution is coarse.
The scores are better for continental stations as Champforgeuil and Agen. The model
is able to capture the day to day variability, with highest values recorded for the 16–
17 June and 6–10 July. This corresponds to well established polluted periods, but the
−3
maximum values of 140 µg m are far from high pollution events.
Full Screen / Esc
Printer-friendly Version
Interactive Discussion
The Aerosols Optical Depth (AOD) reflects the extinction of radiation by aerosols along
the whole atmospheric column. This quantity being well and often measured, the com-
Title Page
Introduction
Conclusions
References
Tables
Figures
J
I
J
I
Back
Close
|
3079
L. Menut et al.
Abstract
Discussion Paper
Analysis of Aerosols Optical Depth
Analysis of ozone
and aerosols during
the ADRIMED
experiment
|
6
15, 3063–3125, 2015
Discussion Paper
25
ACPD
|
20
Discussion Paper
15
|
10
Discussion Paper
5
time (between the two modelled hourly outputs), vertically (between the two model
vertical levels) and horizontally (using a bilinear interpolation). The comparison between the modelled and measured ozone concentrations is presented in Fig. 12. The
◦
−1
corresponding altitude, temperature (in C) and mean wind speed (in m s ) are also
presented, using the same abscissa axis.
Each flight lasts between two and three hours. In the altitude panels, we can see
that the aircraft made several iso-altitude measurements, mainly at 4000 and 6000 m.
For meteorological data, the temperature is always very well simulated by the WRF
model. The differences between model and measurements are very weak, except, for
example, for flights 30 and 31 where the temperature is slightly more underestimated
by the model in altitude than close to the surface. The wind is variable and there are
differences between simulated values and measurements, mostly in terms of variability,
but the absolute values are correctly estimated.
Ozone is always over-estimated by the model, especially in altitude. This is probably
a direct effect of boundary conditions that may be too strong for this period. The boundary chemical fields are derived from a global climate model and the summer of 2013
was moderated in terms of pollution: the climatology may thus induce a positive bias in
the model. These flights within the marine boundary layer are a very good opportunity
to evaluate ozone concentrations over the maritime surfaces. These concentrations
are usually very high in models due to a lack of deposition. For measurements near
the surface, the model is mostly closer to the measurements. Two peaks are simulated
during flights 29 and 33 but are not measured: these modelled high ozone values correspond to local ozone plumes as presented in Fig. 9. However, the ozone peak close
to the surface for the flight 30 is well captured.
Full Screen / Esc
Printer-friendly Version
Interactive Discussion
Discussion Paper
5
parison between model and measurements is widely used to estimate the models’ ability to reproduce aerosol plumes. However, comparisons of AOD have limitations. Being
vertically integrated, there is no information on the vertical structure of the aerosol
plume. In addition, AOD is estimated for a specific wavelength, not always representative of the complete size distributions of all aerosols. In this study, the CHIMERE
outputs AOD are calculated at 600 nm, due to the fastJ algorithm used in the model.
|
6.1
L. Menut et al.
Title Page
Abstract
Introduction
Conclusions
References
Tables
Figures
J
I
J
I
|
Back
Close
Discussion Paper
25
Analysis of ozone
and aerosols during
the ADRIMED
experiment
Discussion Paper
20
15, 3063–3125, 2015
|
15
|
The goal of this paper being to evaluate the ability of a model to estimate hourly pollutants concentrations in the boundary layer and the lower troposphere, the satellite
measurements are here only used to first check if the main AOD patterns are well retrieved. The measured AOD at 550 nm is extracted from the MODIS satellite data over
the period from 6 June to 15 July 2013. Observations are interpolated on the model
grid and comparisons are done for collocated data in space and time, as displayed
in Fig. 13. The MODIS map includes the AOD retrieved over ocean and over land,
proposed on the NASA Giovanni database. MODIS AOD products have been used
for many years to study the amount and origin of aerosols in the Mediterranean troposphere. Barnaba and Gobbi (2004) used these data to split relative contributions of
aerosols on AOD. They showed that for the same particle size, its origin (maritime, continental or desert dust) may induce an AOD variability of one order of magnitude. More
recently, Levy et al. (2010) evaluated the MODIS AOD product over land, by comparison to AERONET sunphotometer data. They showed that there is a high correlation
(R = 0.9) between the two AOD products, with a mean bias of ±0.05.
The AOD data are time averaged over the period from 6 June to 15 July 2013 in
order to have the maximum of available informations on the map. Figure 13 shows
that, in average for all the considered period, CHIMERE reproduces realistically the
main features of the AOD over the considered region, with average values above unity
for the Sahelian band and the Arabian peninsula. However, CHIMERE misses high
AOD values on the eastern side of the Caspian Sea as well as over the northern part
3080
Discussion Paper
10
Comparisons between MODIS and CHIMERE
ACPD
Full Screen / Esc
Printer-friendly Version
Interactive Discussion
Discussion Paper
5
of the Atlantic. For the first area, the underestimation of the AOD by CHIMERE may be
related to missing dust emissions, while for the northern Atlantic, the high AOD values
in MODIS are related to an average computed from very few data points, possibly
during an event of transport of a polluted plume (e.g. biomass burning or mineral dust)
from outside of the simulation domain that is not present in the global climatologies
used at the boundaries.
|
6.2
Title Page
Abstract
Introduction
Conclusions
References
Tables
Figures
J
I
J
I
Back
Close
Discussion Paper
|
3081
L. Menut et al.
|
25
Analysis of ozone
and aerosols during
the ADRIMED
experiment
Discussion Paper
20
15, 3063–3125, 2015
|
15
Comparisons between modelled and measured AOD are also done using the
AERONET data (level 2) (Holben et al., 2001). Time series are presented in Fig. 14.
While the station of Banizoumbou is located close to the mineral dust sources, the stations of Capo Verde and Dakar are directly under the plume. This explains that over the
whole period, AOD values are high, ranging from 0.4 to 2. The day to day variability is
also important and these time series show that the highest AOD values are observed
during the period from 5 to 15 June. A second period with high values is between the
27 and 30 June, with values up to AOD = 1. The model is able to retrieve the observed
day to day variability, even if, on average, modelled values are greater than observed
ones for stations far away from the main Saharan dust sources.
Time series are also presented for the stations of Lampedusa, Forth Crete and Izana.
This set of stations is representative of small islands (for Lampedusa and Izana) and
remote locations (Forth Crete). The measured AOD values are always lower than 0.5.
This clearly shows that, during the whole period, no intense aerosol plume was observed over the Mediterranean sea. The comparison results are not as good as for the
African stations and the model tends to overestimate the AOD over the Mediterranean
area. This overestimation may be due to several factors that can not be diagnosed only
with the AOD, this quantity being an integrated budget of many possible contributions.
This may be an overestimation of surface mineral dust emissions, a shift in the aerosols
size distribution, or an underestimation of modelled dry deposition velocities. However,
Discussion Paper
10
Comparisons between AERONET and CHIMERE
ACPD
Full Screen / Esc
Printer-friendly Version
Interactive Discussion
L. Menut et al.
Title Page
Introduction
References
Tables
Figures
J
I
J
I
Close
Back
3082
Statistical comparisons between model and observations
Discussion Paper
Table 8 presents scores for this comparison. The values are daily averaged and are
expressed in µg m−3 . The number of values compared is very variable and mostly between 700 and 1000, corresponding to hourly data over the whole period. Italian stations are different and measurements are only daily, leading to a lower number of raw
observations. At the end, 33 to 41 daily averaged values are available. The observed
values ranged from 7.9 (baceno) to 32.5 (Malaga) µg m−3 . For the model, the values
ranged from 12.6 (Baceno) to 30.1 (Malaga) µg m−3 . If the variability from site to site
|
Abstract
|
25
Analysis of ozone
and aerosols during
the ADRIMED
experiment
Conclusions
7.1
20
15, 3063–3125, 2015
Discussion Paper
For the understanding of the aerosols life cycle, the analysis of PM10 surface concentrations is complementary to the analysis of AOD. Comparisons are here presented
between surface AirBase measurements and, for the corresponding location in the
model domain, PM10 concentrations at the model’s first vertical level.
ACPD
|
15
Analysis of PM10 surface concentrations
Discussion Paper
7
|
10
Discussion Paper
5
considering all these potential problems, the AOD is satisfactorily modelled compared
to the AERONET measurements.
Table 7 corresponds to statistical scores calculated over these AERONET stations.
The number of observations is very variable from one station to another: if the Izana
station has 516 measurements, Forth Crete has only 108. These differences are certainly due to the cloud screening algorithm applied on the raw sunphotometer data to
ensure that provided AOD are only due to aerosols. The correlation is variable from one
site to another with values ranging from 0.20 (Ilorin) to 0.77 (Izana) and 0.79 (Lampedusa). The RMSE is very large, of the order of magnitude of the AOD value, showing
important discrepancies between model and measurements. The bias shows that the
model underestimates AOD close to the sources and tends, contrarily, to overestimates
AOD for remote sites such as Izana and Lampedusa.
Full Screen / Esc
Printer-friendly Version
Interactive Discussion
Discussion Paper
15, 3063–3125, 2015
Analysis of ozone
and aerosols during
the ADRIMED
experiment
L. Menut et al.
Title Page
Abstract
Introduction
Discussion Paper
Conclusions
References
Tables
Figures
J
I
J
I
|
The measured and modelled daily averaged surface PM10 concentrations are presented in Fig. 15 as time series. On average, the background concentrations are well
simulated for all sites. However, some discrepancies appear when some peaks are
modelled but not measured, as for example at Zorita, Malaga and Agen. The lower
bias on the AOD suggests that the whole column is correct, but that the surface concentrations are too large. This can be, partially, a problem of too important vertical
dffusion, often diagnosed in deterministic Eulerian models (Vuolo et al., 2009). Another possibility is to have too important local emissions. A way to better understand
this overestimation is to analyze the aerosols composition, as presented in the next
section.
8
Back
Close
The modelled aerosols speciation
One goal of this paper is to calculate and discuss the chemical speciation of the
aerosols. In the previous sections, the aerosols behaviour was analyzed in terms of
AOD and surface PM10 . In this section, aerosol composition is analyzed and results
are presented in terms of time series of surface concentrations and vertical profiles of
concentrations.
Discussion Paper
3083
|
20
Surface concentrations time series
ACPD
|
15
7.2
|
10
Discussion Paper
5
is correctly reproduced, the results showed that the model may underestimate or overestimate the concentrations, depending on the site. There is no obvious link between
the location of the site and the sign of the difference: the bias may be positive or negative for sites in the same region. Depending on the station, the correlation ranges from
very low (−0.02 for Cartagena and −0.04 for Agen, for example) to moderate (0.66 in
Chitignano, 0.68 in Hyeres, 0.68 in Vercelli). For 11 stations (on a total of 17), the bias
remains lower than ±4 µg m−3 .
Full Screen / Esc
Printer-friendly Version
Interactive Discussion
5
Title Page
Introduction
Conclusions
References
Tables
Figures
J
I
J
I
Back
Close
|
3084
L. Menut et al.
Abstract
Discussion Paper
The time series presented in the previous section showed the large temporal variability
of the surface concentrations as well as the large variability of the aerosol chemical
composition. In order to quantify these relative contributions site by site, the relative
amount of each chemical species is estimated as a percentage of the total concentra-
Analysis of ozone
and aerosols during
the ADRIMED
experiment
|
25
Relative contribution of chemical species
15, 3063–3125, 2015
Discussion Paper
8.2
ACPD
|
20
Discussion Paper
15
For each site, the modelled aerosols composition is presented as surface time series in
Fig. 16. The concentrations are shown for the whole aerosols size distribution, i.e. for
a mean mass median diameter Dp from 0.04 to 40 µm. This is thus logical to have surface concentrations higher than the ones presented for the PM10 time series. All presented species correspond to CHIMERE model species with the secondary species
families (such as SOA), the mineral dust (DUST) and the primarily emitted species
(such as POM, EC and the rest of anthropogenic dust called PPM here). The complete
explanations about these species are provided in Menut et al. (2013a). For all time
series, the most important contribution comes from mineral dust, with, at least, 50 % of
the total mass. This mineral dust part is also responsible of the large peaks observed
on the PM10 concentrations. The second most important contribution corresponds to
sea salts, specifically for locations corresponding to islands or for coastal sites such as
Lampedusa and Cape Corsica. For “continental background” stations such as Champforgeuil and Agen, the concentrations are lower than for other stations and the relative
part of sea salt becomes logically negligible. For days when there is no peak of dust
and sea salt, sulphate concentrations dominate the aerosol composition. However, surface concentrations of mineral dust remain important for these stations suggesting that
modelled local emissions are too large. The last most important contribution is for sulphates with large concentrations modelled in Lampedusa and Malaga, among others.
Finally, the relative contributions of POM and EC are very low in the total, showing in
particular that this period was not influenced by large vegetation fires events.
|
10
Time series
Discussion Paper
8.1
Full Screen / Esc
Printer-friendly Version
Interactive Discussion
L. Menut et al.
Title Page
Abstract
Introduction
Conclusions
References
Tables
Figures
J
I
J
I
Back
Close
Discussion Paper
|
In order to link the information of surface concentrations, aerosols composition and
vertical structure, Figure 17 presents vertical profiles for the same stations as in Fig. 16
and for the 21 June 2013 at 12:00 UTC. Abscissa scales on the Figure are different in
order to clearly see all profiles. The largest concentrations are modelled in Lampedusa,
−3
with a maximum of 280 µg m at 4000 m AGL. This maximum is due to the long range
3085
Analysis of ozone
and aerosols during
the ADRIMED
experiment
|
25
Vertical profiles
15, 3063–3125, 2015
Discussion Paper
8.3
ACPD
|
20
Discussion Paper
15
|
10
Discussion Paper
5
tion. The calculation is done by cumulating the hourly concentrations over the whole
studied period and species per species. The results are presented in Table 9. For each
site, the value of the most abundant species is bolded.
For 13 stations (out of a total of 17 stations), the most important species is mineral dust, with values ranging from 25.01 % (Champforgeuil) to 64.48 % (Cordoba). In
general, the sites where mineral dust dominates correspond to the western part of the
Mediterranean: Zorita, Cartagena, Malaga, Aranjuez, Cordoba (all these sites being in
Spain).
The second most important contribution is sulphates: this is the most important component for the aerosols at sites Cape Corsica (28.39 %), Ajaccio (22.79 %), Bastia
(28.05 %) and Schivenoglia (24.73 %). The first three sites are in Corsica and the last
one in the North of Italy. For the sites in Corsica, these large amounts of sulphates are
due to shipping emissions or the vicinity of the Fos-Berre industrial area in the South
of France, when Schivenoglia is close to industries.
The third most important contribution is sea salt. For sites such as Lampedusa,
Cartagena, Malaga, this contribution is close to the sulphate contribution values. All
these sites correspond to island or coastal sites, and are thus more exposed to sea
salt emissions. For all continental sites, the sea salt contribution is low, between 2 %
(Baceno) and 12.76 % (Agen). Finally, only one site have a major contribution very different of the others: in Hyeres, the most important chemical species POM (Particulate
Organic Matter) and this has to be linked to the vicinity of the Fos-Berre area, with
organic carbon emissions.
Full Screen / Esc
Printer-friendly Version
Interactive Discussion
Observations from the AERONET inversion algorithm results (Dubovik and King, 2000)
are used. For each AERONET station, the inversion algorithm provides volume particle size distribution for 15 bins, logarithmically distributed for radius between 0.05 to
15 µm. In CHIMERE, the aerosols size distribution is defined during the emissions
Conclusions
References
Tables
Figures
J
I
J
I
Back
Close
|
3086
Title Page
Introduction
Discussion Paper
25
Observed and modelled aerosols size distributions
L. Menut et al.
|
9.1
Analysis of ozone
and aerosols during
the ADRIMED
experiment
Discussion Paper
20
15, 3063–3125, 2015
Abstract
Aerosols size distributions
The understanding of aerosols concentrations after emissions, transport and chemistry is very sensitive to their size distribution. The size distribution is both difficult to
measure and to model. Firstly, the size distribution varies with the emission process.
After emission, this distribution will change over time as a function of settling and dry
deposition. This section is dedicated to better understand the variability of the aerosols
size distribution.
ACPD
|
15
Discussion Paper
9
|
10
Discussion Paper
5
transport of mineral dust from Africa. A peak of mineral dust in altitude is also modelled
in Cape Corsica and Champforgeuil. In Cape Corsica, the maximum value is 30 µg m−3
−3
at 2500 m AGL, with a contribution of 16 µg m from mineral dust. In Champforgeuil,
−3
a mineral dust peak is modelled at 2000 m AGL with 12 µg m . In this case, the peak is
at 1000 m and mainly due to non negligible concentrations of sea salt, sulphates, nitrate
and ammonium: mineral dust represents 6 µg m−3 for a maximum value of 19 µg m−3 at
1000 m AGL.
For Zorita, Malaga and Agen, the maximum concentrations are located close to the
surface. They are lower than when mineral dust plumes are modelled, with maximum
−3
from 12 to 40 µg m . The aerosols speciation varies for each site, as described in
Table 9. Finally, for all these profiles, the mineral dust contribution corresponds to the
main part of the aerosol composition in altitude, with important contributions of sulphates, from the surface up to 4000 m.
Full Screen / Esc
Printer-friendly Version
Interactive Discussion
L. Menut et al.
Title Page
Abstract
Introduction
Conclusions
References
Tables
Figures
J
I
J
I
Back
Close
Discussion Paper
|
Retrieved aerosols size distribution are presented in Fig. 18 for some stations listed
in Table 1: Banizoumbou, Cinzana, Capo Verde, Izana and Lampedusa. The aerosols
size are expressed in radius, as the original AERONET ASD data. On the Figures, the
scale for the volume size distribution changes for each date and site, in order to clearly
see the values.
3087
Analysis of ozone
and aerosols during
the ADRIMED
experiment
|
20
Results
15, 3063–3125, 2015
Discussion Paper
9.2
ACPD
|
15
where: mc is the mass concentration (the mass of particles in a volume of air, in
µg m−3 ) for the naero modelled aerosols. ρc is the particle density (also in µg m−3 ,
the mass of the particle in its own volume). In this model version, all aerosols
−3
3
−3
have the same density: ρ = 1.5 kg m × 10 kg m , except the mineral dust with
−3
3
−3
ρ = 2.65 kg m × 10 kg m . ∆zk the model layer thickness (for a total of nlevels levels) and Dp,min and Dp,max the minimum and maximum mean mass median diameter
of the i th bin. These diameters are converted to radius for the direct comparison with
the AERONET data. The naero model species are those presented in the previous
sections: SOA, ammonium, nitrate, sulphate, sea salt, PPM, POM, EC and dust.
Discussion Paper
10
|
k=1
Discussion Paper
5
fluxes calculations and is different for each species (following the recommendation of
the emissions inventories, as described in Menut et al. (2013a)). For all aerosols (except mineral dust), the distribution is fixed at the emission and then may only vary
with heterogeneous chemistry and deposition. For mineral dust, the size distribution
may vary at emission, depending on the wind speed and following the dust production model of Alfaro and Gomes (2001). In order to directly compare observations and
model results, the modelled column aerosol volume size distribution is calculated for
each model bin as in Péré et al. (2010):
!
c=naero
X mc
× ∆zk
k=nlevels
ρc
X
dV
c=1
=
(2)
d log(Dp )
log(Dp,max ) − log(Dp,min )
Full Screen / Esc
Printer-friendly Version
Interactive Discussion
L. Menut et al.
Title Page
Abstract
Introduction
Conclusions
References
Tables
Figures
J
I
J
I
Back
Close
Discussion Paper
|
3088
Analysis of ozone
and aerosols during
the ADRIMED
experiment
|
25
This study analyzed the ozone and aerosols tropospheric concentrations and their variability over the Euro-Mediterranean region, from the 1 June to the 15 July 2013. This
region and period was the framework of the ADRIMED project, a measurements campaign of the CHARMEX program. This analysis was performed by using measurements
from the ADRIMED project (airborne measurements), routine network measurements
(AIRBASE, AERONET, E-OBS) and modelling with WRF and CHIMERE. First, the
model results were compared to measurements to quantify the ability of the model to
restitute the spatio-temporal variability of ozone and aerosols both at the surface and in
altitude. Second, the model was used to go further by analyzing the chemical composi-
15, 3063–3125, 2015
Discussion Paper
20
Conclusions
ACPD
|
10
Discussion Paper
15
|
10
Discussion Paper
5
Maximum concentrations are observed and modelled in Banizoumbou and Cinzana,
these stations being close to the sources. This also explains that the size distribution
is mainly constituted by a mode with r = 1 to 2 µm, corresponding to a dominant mode
in mineral dust emissions, (Alfaro and Gomes, 2001). For these two sites, a systematic
difference is observed between the model and the measurements: the main peak of
the modelled coarse mode is for radius of ≈ 1 µm, when the AERONET ASD exhibits
a peak for a radius of ≈ 2 µm. This bias will probably induce a longer transport in the
model than in reality, since the deposition velocity increases with the aerosols radius for
these particles sizes, (Forêt et al., 2006). These results clearly show that improvements
have to be done in the size distribution of mineral dust emissions.
After some transport of mineral dust, an important fine mode (with r ≈ 0.03 µm) is
modelled at Capo Verde. This fine fraction is not present in the AERONET size distribution. Far from the mineral dust sources, in Izana and Lampedusa, the comparisons
of observed and modelled size distribution are poor. In Izana, the model overestimates
the AERONET concentrations for all modes. In Lampedusa, observations clearly show
two modes (with radius ≈ 0.1 and 2 µm), when the model reproduces a flat distribution
for the 17 June and a coarse mode peak only for the 21 June.
Full Screen / Esc
Printer-friendly Version
Interactive Discussion
3089
|
15, 3063–3125, 2015
Analysis of ozone
and aerosols during
the ADRIMED
experiment
L. Menut et al.
Title Page
Abstract
Introduction
Discussion Paper
Conclusions
References
Tables
Figures
J
I
J
I
|
Back
Close
Discussion Paper
25
ACPD
|
20
Discussion Paper
15
|
10
Discussion Paper
5
tion of the aerosols. In addition, the aerosols size distribution variability between Africa
and the Mediterranean area was analyzed by comparing AERONET and CHIMERE
values.
Meteorological variables such as 2 m temperature and daily precipitation amount
were first analyzed using E-OBS data and WRF model results. When measurements
are available, it was shown that model and measurements are close in term of daily
variability, even if the model has a bias of ≈ −1.5 K over land (where E-OBS data are
available). In altitude, and in comparison with aircraft ADRIMED measurements, this
variable was found to be correctly modelled. The analysis of the temperature and precipitation showed the summer was with moderate surface temperatures over Europe
and two major precipitation events were observed during the period.
The second step was to compare surface ozone and PM10 concentrations between
model and measurements (from AIRBASE network and ADRIMED specific measurements done at Lampedusa and Cape Corsica). The error statistics showed that the
model is able to reproduce surface ozone concentrations, both the average values and
the variability, even if we note an overestimation of mean surface ozone concentrations. The comparison between modelled and measured ozone concentrations along
the flight trajectories is correct and confirm the high ozone concentration close to the
sea surface that are commonly simulated in chemistry transport models. Using the
model, it was shown that the ozone plumes were numerous and relatively thin, but not
very concentrated, flowing from west to east in Europe. When precipitation events occured, the ozone and PM surface concentations decreased, showing the high impact
of photolysis attenuation due to cloudiness for ozone and wet scavenging for aerosols.
It was shown that the period from the 1 June to the 15 July 2013 was not highly
polluted. The meteorological conditions were far from drought and precipitation events
were non negligible. In addition, this was not a summer under severe vegetation fires
events. The most important aerosols events were observed around 16 and 25 June,
4 July 2013. Using the model aerosols speciation, it was shown that the main part of
the PM10 surface concentration is composed of mineral dust. Another large fraction is
Full Screen / Esc
Printer-friendly Version
Interactive Discussion
Title Page
Introduction
Conclusions
References
Tables
Figures
J
I
J
I
Back
Close
|
3090
L. Menut et al.
Abstract
Discussion Paper
Alfaro, S. C. and Gomes, L.: Modeling mineral aerosol production by wind erosion: emission
intensities and aerosol size distribution in source areas, J. Geophys. Res., 106, 18075–
18084, 2001. 3087, 3088
Barnaba, F. and Gobbi, G. P.: Aerosol seasonal variability over the Mediterranean region and
relative impact of maritime, continental and Saharan dust particles over the basin from
Analysis of ozone
and aerosols during
the ADRIMED
experiment
|
25
15, 3063–3125, 2015
Discussion Paper
References
ACPD
|
20
Discussion Paper
15
Acknowledgements. This study was partly funded by the French Ministry in charge of Ecology.
We thank the SAFIRE joint laboratory and the CHARMEX program for providing us all campaign
measurements used in this study. We thank the EEA for maintaining and providing the AirBase
database of pollutants surface concentrations over Europe. We thank the principal investigators
and their staff for establishing and maintaining the AERONET sites used in this study: Didier
Tanré for Banizoumbou, Capo Verde and Dakar; Bernadette Chatenet and Jean-Louis Rajot
for Zinder and Cinzana; Daniela Meloni and Alcide Di Sarra for Lampedusa. We acknowledge
the Service d’Observation PHOTONS/AERONET and the AERONET-ACTRIS TNA supporting
the AERONET activity in Europe. Analyses and visualizations used in this study for the MODIS
satellite AOD maps were produced with the Giovanni online data system, developed and maintained by the NASA GES DISC. We acknowledge the E-OBS dataset from the EU-FP6 project
ENSEMBLES (http://ensembles-eu.metoffice.com) and the data providers in the ECAD project
(http://www.ecad.eu).
|
10
Discussion Paper
5
due to sea salt and sulphates concentrations. On the vertical, the mineral dust clearly
dominates the total load of aerosols, when sea salt and sulphates are mainly present in
the boundary layer. A focus was done on aerosols size distribution by using AERONET
products time series over numerous sites, in Africa, close to the sources of mineral
dust, and in Europe, where a mix of several sources is present: local erosion, anthropogenic and biogenic emissions, vegetation fires. The ability of the model to reproduce
the aerosol size distribution was quantified and it was shown that, close to the source,
the coarse mode is understimated when, far from the main desert sources, the fine
mode is mainly overestimated by the model.
Full Screen / Esc
Printer-friendly Version
Interactive Discussion
3091
|
Analysis of ozone
and aerosols during
the ADRIMED
experiment
L. Menut et al.
Title Page
Abstract
Introduction
Conclusions
References
Tables
Figures
J
I
J
I
|
Back
Close
Discussion Paper
30
15, 3063–3125, 2015
Discussion Paper
25
ACPD
|
20
Discussion Paper
15
|
10
Discussion Paper
5
MODIS data in the year 2001, Atmos. Chem. Phys., 4, 2367–2391, doi:10.5194/acp-4-23672004, 2004. 3066, 3080
Basart, S., Pérez, C., Cuevas, E., Baldasano, J. M., and Gobbi, G. P.: Aerosol characterization
in Northern Africa, Northeastern Atlantic, Mediterranean Basin and Middle East from directsun AERONET observations, Atmos. Chem. Phys., 9, 8265–8282, doi:10.5194/acp-9-82652009, 2009. 3067
Bergamo, A., Tafuro, A. M., Kinne, S., De Tomasi, F., and Perrone, M. R.: Monthly-averaged
anthropogenic aerosol direct radiative forcing over the Mediterranean based on AERONET
aerosol properties, Atmos. Chem. Phys., 8, 6995–7014, doi:10.5194/acp-8-6995-2008,
2008. 3067
Bessagnet, B., Hodzic, A., Vautard, R., Beekmann, M., Cheinet, S., Honoré, C., Liousse, C.,
and Rouil, L.: Aerosol modeling with CHIMERE: preliminary evaluation at the continental
scale, Atmos. Environ., 38, 2803–2817, 2004. 3072
Bian, H. and Prather, M.: Fast-J2: accurate simulation of stratospheric photolysis in global
chemical models, J. Atmos. Chem., 41, 281–296, 2002. 3072
Briant, R., Menut, L., Siour, G., and Prigent, C.: Homogeneized modeling of mineral dust emissions over Europe and Africa using the CHIMERE model, Geosci. Model Dev. Discuss., 7,
3441–3480, doi:10.5194/gmdd-7-3441-2014, 2014. 3073
Chen, F. and Dudhia, J.: Coupling an advanced land surface-hydrology model with the Penn
State-NCAR MM5 modeling system. Part I: Model implementation and sensitivity, Mon.
Weather Rev., 129, 569–585, 2001. 3071
Colette, A., Ancellet, G., Menut, L., and Arnold, S. R.: A Lagrangian analysis of the impact
of transport and transformation on the ozone stratification observed in the free troposphere
during the ESCOMPTE campaign, Atmos. Chem. Phys., 6, 3487–3503, doi:10.5194/acp-63487-2006, 2006. 3066
Cros, B., Durand, P., Cachier, H., Drobinski, P., Fréjafon, E., Kottmeir, C., Perros, P., Peuch, V.H., Ponche, J.-L., Robin, D., Said, F., Toupance, G., and Wortham, H.: The ESCOMPTE
program: an overview, Atmos. Res., 69, 241–279, 2004. 3066
de la Paz, D., Vedrenne, M., Borge, R., Lumbreras, J., de Andrés, J. M., Pérez, J., Rodriguez, E., Karanasiou, A., Moreno, T., Boldo, E., and Linares, C.: Modelling Saharan
dust transport into the Mediterranean basin with CMAQ, Atmos. Environ., 70, 337–350,
doi:10.1016/j.atmosenv.2013.01.013, 2013. 3067
Full Screen / Esc
Printer-friendly Version
Interactive Discussion
3092
|
Analysis of ozone
and aerosols during
the ADRIMED
experiment
L. Menut et al.
Title Page
Abstract
Introduction
Conclusions
References
Tables
Figures
J
I
J
I
|
Back
Close
Discussion Paper
30
15, 3063–3125, 2015
Discussion Paper
25
ACPD
|
20
Discussion Paper
15
|
10
Discussion Paper
5
di Sarra, A., Pace, G., Meloni, D., De Silvestri, L., Piacentino, S., and Monteleone, F.: Surface
shortwave radiative forcing of different aerosol types in the central Mediterranean, Geophys.
Res. Lett., 35, doi:10.1029/2007GL032395, 2008. 3067
Dubovik, O. and King, M. D.: A flexible inversion algorithm for retrieval of aerosol optical properties from Sun and sky radiance measurements, J. Geophys. Res.-Atmos., 105, 20673–
20696, doi:10.1029/2000JD900282, 2000. 3070, 3086
Dulac, F. and Chazette, P.: Airborne study of a multi-layer aerosol structure in the eastern
Mediterranean observed with the airborne polarized lidar ALEX during a STAAARTE campaign (7 June 1997), Atmos. Chem. Phys., 3, 1817–1831, doi:10.5194/acp-3-1817-2003,
2003. 3066
Dulac, F., Arboledas, L. A., Alastuey, A., Ancellet, G., Arndt, J., Attié, J.-L., Augustin, P.,
Becagli, S., Bergametti, G., Bocquet, M., Bordier, F., Bourdon, A., Bourrianne, T., BravoAranda, J., Carrer, D., Ceamanos, X., Chazette, P., Chiapello, I., Comeron, A., D’Amico, G.,
D’Anna, B., Delbarre, H., Denjean, C., Desboeufs, K., Descloitres, J., Diouri, M., Biagio, C. D.,
Iorio, T. D., Sarra, G. D., Doppler, L., Durand, P., Amraoui, L. E., Ellul, R., Ferré, H.,
Fleury, L., Formenti, P., Freney, E., Gaimoz, C., Gerasopoulos, E., Goloub, P., GomezAmo, J., Granados-Munoz, M., Grand, N., Grobner, J., Rascado, J.-L. G., Guieu, C., Hadjimitsis, D., Hamonou, E., Hansson, H., Iarlori, M., Ioannou, S., Jambert, C., Jaumouillé, E.,
Jeannot, M., Junkermann, W., Keleshis, C., Kokkalis, P., Lambert, D., Laurent, B., Léon, J.-F.,
Liousse, C., Bartolome, M. L., Losno, R., Mallet, M., Mamouri, R.-E., Meloni, D., Menut, L.,
Montoux, N., Baquero, R. M., Nabat, P., Navas-Guzman, F., Nicolae, D., Nicolas, J., Notton, G., Ohayon, W., Paoli, C., Papayannis, A., Pelon, J., Pey, J., Pont, V., Pujadas, M.,
Querol, X., Ravetta, F., Renard, J.-B., Rizi, V., Roberts, G., Roujean, J.-L., Sartelet, K.,
Savelli, J.-L., Sciare, J., Sellegri, K., Sferlazzo, D., Sicard, M., Smyth, A., Solmon, F.,
Tanré, D., Torres, B., Totems, J., Sanchez, A. T., Verdier, N., Vignelles, D., Vincent, J., Wagner, F., Wang, Y., Wenger, J., and Yassaa, N.: Overview of the Project ChArMEx activities on
Saharan Dust in the Mediterranean region, in: 7th Int. Workshop on Sand/Duststorms and
Associated Dustfall, 2–4 Dec. 2013, Frascati, Italy, 2013. 3066
Forêt, G., Bergametti, G., Dulac, F., and Menut, L.: An optimized particle size bin scheme for
modeling mineral dust aerosol, J. Geophys. Res., 111, D17310, doi:10.1029/2005JD006797,
2006. 3088
Full Screen / Esc
Printer-friendly Version
Interactive Discussion
3093
|
Analysis of ozone
and aerosols during
the ADRIMED
experiment
L. Menut et al.
Title Page
Abstract
Introduction
Conclusions
References
Tables
Figures
J
I
J
I
|
Back
Close
Discussion Paper
30
15, 3063–3125, 2015
Discussion Paper
25
ACPD
|
20
Discussion Paper
15
|
10
Discussion Paper
5
Gerasopoulos, E., Kouvarakis, G., Vrekoussis, M., Kanakidou, M., and Mihalopoulos, N.: Ozone
variability in the marine boundary layer of the eastern Mediterranean based on 7-year observations, J. Geophys. Res., 110, D15309, 2005. 3066
Ginoux, P., Chin, M., Tegen, I., Prospero, J. M., Holben, B., Dubovik, O., and Lin, S. J.: Sources
and distributions of dust aerosols simulated with the GOCART model, J. Geophys. Res., 106,
20255–20273, 2001. 3072
Grell, G. A. and Devenyi, D.: A generalized approach to parameterizing convection combining ensemble and data assimilation techniques, Geophys. Res. Lett., 29, 1693,
doi:10.1029/2002GL015311, 2002. 3071
Guenther, A., Karl, T., Harley, P., Wiedinmyer, C., Palmer, P. I., and Geron, C.: Estimates
of global terrestrial isoprene emissions using MEGAN (Model of Emissions of Gases and
Aerosols from Nature), Atmos. Chem. Phys., 6, 3181–3210, doi:10.5194/acp-6-3181-2006,
2006. 3073
Guerreiro, C., de Leuw, F., and Foltescu, V.: Air quality in Europe, European Environment
Agency, report, 9, 112, 2013. 3069
Haylock, M. R., Hofstra, N., Tank, A. M. G. K., Klok, E. J., Jones, P. D., and New, M.: A European
daily high-resolution gridded data set of surface temperature and precipitation for 1950–
2006, J. Geophys. Res.-Atmos., 113, doi:10.1029/2008JD010201, 2008. 3069
Holben, B., Tanre, D., Smirnov, A., Eck, T. F., Slutsker, I., Abuhassan, N., Newcomb, W. W.,
Schafer, J., Chatenet, B., Lavenu, F., Kaufman, Y. J., Vande Castle, J., Setzer, A.,
Markham, B., Clark, D., Frouin, R., Halthore, R., Karnieli, A., O’Neill, N. T., Pietras, C.,
Pinker, R. T., Voss, K., and Zibordi, G.: An emerging ground-based aerosol climatology:
aerosol optical depth from AERONET, J. Geophys. Res., 106, 12067–12097, 2001. 3070,
3081
Hong, S. Y., Dudhia, J., and Chen, S.: A revised approach to ice microphysical processes for
the bulk parameterization of clouds and precipitation, Mon. Weather Rev., 132, 103–120,
2004. 3071
Hong, S. Y., Noh, Y., and Dudhia, J.: A new vertical diffusion package with an explicit treatment
of entrainment processes, Mon. Weather Rev., 134, 2318–2341, doi:10.1175/MWR3199.1,
2006. 3071
Israelevich, P., Ganor, E., Alpert, P., Kishcha, P., and Stupp, A.: Predominant transport paths of
Saharan dust over the Mediterranean Sea to Europe, J. Geophys. Res., 117, D02205, 2012.
3065
Full Screen / Esc
Printer-friendly Version
Interactive Discussion
3094
|
Analysis of ozone
and aerosols during
the ADRIMED
experiment
L. Menut et al.
Title Page
Abstract
Introduction
Conclusions
References
Tables
Figures
J
I
J
I
|
Back
Close
Discussion Paper
30
15, 3063–3125, 2015
Discussion Paper
25
ACPD
|
20
Discussion Paper
15
|
10
Discussion Paper
5
Jiménez-Guerrero, P., Jorba, O., Pay, M. T., Montávez, J. P., Jerez, S., Gómez-Navarro, J. J.,
and Baldasano, J. M.: Comparison of two different sea-salt aerosol schemes as implemented
in air quality models applied to the Mediterranean Basin, Atmos. Chem. Phys., 11, 4833–
4850, doi:10.5194/acp-11-4833-2011, 2011. 3067
Kalabokas, P., Mihalopoulos, N., Ellul, R., Kleanthous, S., and Repapis, C.: An investigation of
the meteorological and photochemical factors influencing the background rural and marine
surface ozone levels in the Central and Eastern Mediterranean, Atmos. Environ., 42, 7894–
7906, doi:10.1016/j.atmosenv.2008.07.009, 2008. 3066
Kubilay, N., Cokacar, T., and Oguz, T.: Optical properties of mineral dust outbreaks over the
northeastern Mediterranean, J. Geophys. Res., 108, 4666, 2003. 3065, 3066
Kulmala, M., Asmi, A., Lappalainen, H. K., Baltensperger, U., Brenguier, J.-L., Facchini, M. C.,
Hansson, H.-C., Hov, Ø., O’Dowd, C. D., Pöschl, U., Wiedensohler, A., Boers, R., Boucher, O.,
de Leeuw, G., Denier van der Gon, H. A. C., Feichter, J., Krejci, R., Laj, P., Lihavainen, H.,
Lohmann, U., McFiggans, G., Mentel, T., Pilinis, C., Riipinen, I., Schulz, M., Stohl, A., Swietlicki, E., Vignati, E., Alves, C., Amann, M., Ammann, M., Arabas, S., Artaxo, P., Baars, H.,
Beddows, D. C. S., Bergström, R., Beukes, J. P., Bilde, M., Burkhart, J. F., Canonaco, F.,
Clegg, S. L., Coe, H., Crumeyrolle, S., D’Anna, B., Decesari, S., Gilardoni, S., Fischer, M.,
Fjaeraa, A. M., Fountoukis, C., George, C., Gomes, L., Halloran, P., Hamburger, T., Harrison, R. M., Herrmann, H., Hoffmann, T., Hoose, C., Hu, M., Hyvärinen, A., Hõrrak, U.,
Iinuma, Y., Iversen, T., Josipovic, M., Kanakidou, M., Kiendler-Scharr, A., Kirkevåg, A.,
Kiss, G., Klimont, Z., Kolmonen, P., Komppula, M., Kristjánsson, J.-E., Laakso, L., Laaksonen, A., Labonnote, L., Lanz, V. A., Lehtinen, K. E. J., Rizzo, L. V., Makkonen, R., Manninen, H. E., McMeeking, G., Merikanto, J., Minikin, A., Mirme, S., Morgan, W. T., Nemitz, E., O’Donnell, D., Panwar, T. S., Pawlowska, H., Petzold, A., Pienaar, J. J., Pio, C.,
Plass-Duelmer, C., Prévôt, A. S. H., Pryor, S., Reddington, C. L., Roberts, G., Rosenfeld, D.,
Schwarz, J., Seland, Ø., Sellegri, K., Shen, X. J., Shiraiwa, M., Siebert, H., Sierau, B., Simpson, D., Sun, J. Y., Topping, D., Tunved, P., Vaattovaara, P., Vakkari, V., Veefkind, J. P., Visschedijk, A., Vuollekoski, H., Vuolo, R., Wehner, B., Wildt, J., Woodward, S., Worsnop, D. R.,
van Zadelhoff, G.-J., Zardini, A. A., Zhang, K., van Zyl, P. G., Kerminen, V.-M., S Carslaw, K.,
and Pandis, S. N.: General overview: European Integrated project on Aerosol Cloud Climate and Air Quality interactions (EUCAARI) – integrating aerosol research from nano
to global scales, Atmos. Chem. Phys., 11, 13061–13143, doi:10.5194/acp-11-13061-2011,
2011. 3067
Full Screen / Esc
Printer-friendly Version
Interactive Discussion
3095
|
Analysis of ozone
and aerosols during
the ADRIMED
experiment
L. Menut et al.
Title Page
Abstract
Introduction
Conclusions
References
Tables
Figures
J
I
J
I
|
Back
Close
Discussion Paper
30
15, 3063–3125, 2015
Discussion Paper
25
ACPD
|
20
Discussion Paper
15
|
10
Discussion Paper
5
Lelieveld, J., Berresheim, H., Borrmann, S., Crutzen, P. J., Dentener, F. J., Fischer, H.,
Feichter, J., Flatau, P. J., Heland, J., Holzinger, R., Korrmann, R., Lawrence, M. G.,
Levin, Z., Markowicz, K. M., Mihalopoulos, N., Minikin, A., Ramanathan, V., Reus, M. d.,
Roelofs, G. J., Scheeren, H. A., Sciare, J., Schlager, H., Schultz, M., Siegmund, P., Steil, B.,
Stephanou, E. G., Stier, P., Traub, M., Warneke, C., Williams, J., and Ziereis, H.: Global air
pollution crossroads over the Mediterranean, Science, 298, 794–799, 2002. 3066
Levy, R. C., Remer, L. A., Kleidman, R. G., Mattoo, S., Ichoku, C., Kahn, R., and Eck, T. F.:
Global evaluation of the Collection 5 MODIS dark-target aerosol products over land, Atmos.
Chem. Phys., 10, 10399–10420, doi:10.5194/acp-10-10399-2010, 2010. 3080
Mailler, S.: On the radiative impact of aerosols on photolysis rates: comparison of simulations
and observations in the Lampedusa island during the CharMEx/ADRIMED campaign, Atmos.
Chem. Phys. Discuss., in review, 2015. 3072
Mailler, S., Khvorostyanov, D., and Menut, L.: Impact of the vertical emission profiles on background gas-phase pollution simulated from the EMEP emissions over Europe, Atmos. Chem.
Phys., 13, 5987–5998, doi:10.5194/acp-13-5987-2013, 2013. 3073
Mallet M. et al, The Aerosol Direct Radiative Impact in the MEDiterranean (ADRIMED) project,
Atelier de Modelisation de l’Atmosphere, 21 January 2014, Toulouse, France, http://www.
meteo.fr/cic/meetings/2014/AMA/programme.pdf, 2014. Please confirm correction and add
all authors. 3066, 3070
Mallet, M., Dubovik, O., Nabat, P., Dulac, F., Kahn, R., Sciare, J., Paronis, D., and Léon, J. F.:
Absorption properties of Mediterranean aerosols obtained from multi-year ground-based remote sensing observations, Atmos. Chem. Phys., 13, 9195–9210, doi:10.5194/acp-13-91952013, 2013. 3067
Menut, L., Coll, I., and Cautenet, S.: Impact of meteorological data resolution on the forecasted
ozone concentrations during the ESCOMPTE IOP 2a and 2b, Atmos. Res., 74, 139–159,
2005. 3067
Menut, L., Goussebaile, A., Bessagnet, B., Khvorostiyanov, D., and Ung, A.: Impact of realistic
hourly emissions profiles on modelled air pollutants concentrations, Atmos. Environ., 233–
244, 2012. 3072
Menut, L., Bessagnet, B., Khvorostyanov, D., Beekmann, M., Blond, N., Colette, A., Coll, I.,
Curci, G., Foret, G., Hodzic, A., Mailler, S., Meleux, F., Monge, J.-L., Pison, I., Siour, G., Turquety, S., Valari, M., Vautard, R., and Vivanco, M. G.: CHIMERE 2013: a model for regional
Full Screen / Esc
Printer-friendly Version
Interactive Discussion
3096
|
Analysis of ozone
and aerosols during
the ADRIMED
experiment
L. Menut et al.
Title Page
Abstract
Introduction
Conclusions
References
Tables
Figures
J
I
J
I
|
Back
Close
Discussion Paper
30
15, 3063–3125, 2015
Discussion Paper
25
ACPD
|
20
Discussion Paper
15
|
10
Discussion Paper
5
atmospheric composition modelling, Geosci. Model Dev., 6, 981–1028, doi:10.5194/gmd-6981-2013, 2013a. 3072, 3084, 3087
Menut, L., Perez Garcia-Pando, C., Haustein, K., Bessagnet, B., Prigent, C., and Alfaro, S.:
Relative impact of roughness and soil texture on mineral dust emission fluxes modeling, J.
Geophys. Res., 118, 6505–6520, doi:10.1002/jgrd.50313, 2013b. 3067, 3073
Menut, L., Tripathi, O., Colette, A., Vautard, R., Flaounas, E., and Bessagnet, B.: Evaluation
of regional climate simulations for air quality modelling purposes, Clim. Dynam., 40, 2515–
2533, doi:10.1007/s00382-012-1345-9, 2013c. 3073
Middleton, N. J. and Goudie, A. S.: Saharan dust: sources and trajectories, T. I. Brit. Geogr.,
26, 165–181, doi:10.1111/1475-5661.00013, 2001. 3065
Millan, M., Estrela, M. J., Sanz, M. J., Mantilla, E., Martan, M., Pastor, F., Salvador, R.,
Vallejo, R., Alonso, L., Gangoiti, G., Ilardia, J., Navazo, M., Albizuri, A., Artano, B., Ciccioli, P., Kallos, G., Carvalho, R. A., Andreas, D., Hoff, A., Werhahn, J., and Seufert, G.,
and Versino, B.: Climatic feedbacks and desertification: the Mediterranean Model, J. Climate,
18, 684–701, 2005. 3066
Mlawer, E., Taubman, S., Brown, P., Iacono, M., and Clough, S.: Radiative transfer for inhomogeneous atmospheres: RRTM a validated correlated-k model for the longwave, J. Geophys.
Res., 102, 16663–16682, 1997. 3071
Monks, P., Granier, C., Fuzzi, S., Stohl, A., Williams, M., Akimoto, H., Amann, M., Baklanov, A., Baltensperger, U., Bey, I., Blake, N., Blake, R., Carslaw, K., Cooper, O., Dentener, F., Fowler, D., Fragkou, E., Frost, G., Generoso, S., Ginoux, P., Grewe, V., Guenther, A., Hansson, H., Henne, S., Hjorth, J., Hofzumahaus, A., Huntrieser, H., Isaksen, I.,
Jenkin, M., Kaiser, J., Kanakidou, M., Klimont, Z., Kulmala, M., Laj, P., Lawrence, M.,
Lee, J., Liousse, C., Maione, M., McFiggans, G., Metzger, A., Mieville, A., Moussiopoulos, N., Orlando, J., O’Dowd, C., Palmer, P., Parrish, D., Petzold, A., Platt, U., Pöschl, U.,
Prévt, A., Reeves, C., Reimann, S., Rudich, Y., Sellegri, K., Steinbrecher, R., Simpson, D.,
ten Brink, H., Theloke, J., van der Werf, G., Vautard, R., Vestreng, V., Vlachokostas, C., and
von Glasow, R.: Atmospheric composition change – global and regional air quality, Atmos.
Environ., 43, 5268–5350, doi:10.1016/j.atmosenv.2009.08.021, 2009. 3066
Moulin, C., Lambert, C. E., Dayan, U., Masson, V., Ramonet, M., Bousquet, P., Legrand, M.,
Balkanski, Y. J., Guelle, W., Marticorena, B., Bergametti, G., and Dulac, F.: Satellite climatology of African dust transport in the Mediterranean atmosphere, J. Geophys. Res.-Atmos.,
103, 13137–13144, doi:10.1029/98JD00171, 1998. 3065
Full Screen / Esc
Printer-friendly Version
Interactive Discussion
3097
|
Analysis of ozone
and aerosols during
the ADRIMED
experiment
L. Menut et al.
Title Page
Abstract
Introduction
Conclusions
References
Tables
Figures
J
I
J
I
|
Back
Close
Discussion Paper
30
15, 3063–3125, 2015
Discussion Paper
25
ACPD
|
20
Discussion Paper
15
|
10
Discussion Paper
5
Nabat, P., Solmon, F., Mallet, M., Kok, J. F., and Somot, S.: Dust emission size distribution
impact on aerosol budget and radiative forcing over the Mediterranean region: a regional climate model approach, Atmos. Chem. Phys., 12, 10545–10567, doi:10.5194/acp-12-105452012, 2012. 3067
Nabat, P., Somot, S., Mallet, M., Sevault, F., Chiacchio, M., and Wild, M.: Direct and semi-direct
aerosol radiative effect on the Mediterranean climate variability using a coupled regional
climate system model, Clim. Dynam., 1–29, doi:10.1007/s00382-014-2205-6, 2014. 3067
Papayannis, A., Amiridis, V., Mona, L., Tsaknakis, G., Balis, D., Bösenberg, J., Chaikovski, A.,
De Tomasi, F., Grigorov, I., Mattis, I., Mitev, V., Müller, D., Nickovic, S., Pérez, C.,
Pietruczuk, A., Pisani, G., Ravetta, F., Rizi, V., Sicard, M., Trickl, T., Wiegner, M., Gerding, M.,
Mamouri, R. E., D’Amico, G., and Pappalardo, G.: Systematic lidar observations of Saharan
dust over Europe in the frame of EARLINET (2000–2002), J. Geophys. Res.-Atmos., 113,
2156–2202, doi:10.1029/2007JD009028, 2008. 3066
Pappalardo, G., Amodeo, A., Apituley, A., Comeron, A., Freudenthaler, V., Linné, H., Ansmann, A., Bösenberg, J., D’Amico, G., Mattis, I., Mona, L., Wandinger, U., Amiridis, V.,
Alados-Arboledas, L., Nicolae, D., and Wiegner, M.: EARLINET: towards an advanced sustainable European aerosol lidar network, Atmos. Meas. Tech., 7, 2389–2409,
doi:10.5194/amt-7-2389-2014, 2014. 3066
Péré, J., Mallet, M., Pont, V., and Bessagnet, B.: Evaluation of an aerosol optical scheme in the
chemistry-transport model CHIMERE, Atmos. Environ., 44, 3688–3699, 2010. 3087
Pérez, C., Haustein, K., Janjic, Z., Jorba, O., Huneeus, N., Baldasano, J. M., Black, T.,
Basart, S., Nickovic, S., Miller, R. L., Perlwitz, J. P., Schulz, M., and Thomson, M.: Atmospheric dust modeling from meso to global scales with the online NMMB/BSC-Dust model
– Part 1: Model description, annual simulations and evaluation, Atmos. Chem. Phys., 11,
13001–13027, doi:10.5194/acp-11-13001-2011, 2011. 3067
Querol, X., Pey, J., Pandolfi, M., Alastuey, A., Cusack, M., Pereza, N., Moreno, T., Viana, M.,
Mihalopoulos, N., Kallo, G., and Kleanthous, S.: African dust contributions to mean ambient
PM10 mass-levels across the Mediterranean Basin, Atmos. Environ., 43, 4266–4277, 2009.
3066
Richards, N. A. D., Arnold, S. R., Chipperfield, M. P., Miles, G., Rap, A., Siddans, R.,
Monks, S. A., and Hollaway, M. J.: The Mediterranean summertime ozone maximum:
global emission sensitivities and radiative impacts, Atmos. Chem. Phys., 13, 2331–2345,
doi:10.5194/acp-13-2331-2013, 2013. 3067
Full Screen / Esc
Printer-friendly Version
Interactive Discussion
Analysis of ozone
and aerosols during
the ADRIMED
experiment
L. Menut et al.
Title Page
Abstract
Introduction
Conclusions
References
Tables
Figures
J
I
J
I
|
Back
Close
Discussion Paper
|
3098
15, 3063–3125, 2015
Discussion Paper
25
ACPD
|
20
Discussion Paper
15
|
10
Discussion Paper
5
Roelofs, G. J., Scheeren, H. A., Heland, J., Ziereis, H., and Lelieveld, J.: A model study of
ozone in the eastern Mediterranean free troposphere during MINOS (August 2001), Atmos.
Chem. Phys., 3, 1199–1210, doi:10.5194/acp-3-1199-2003, 2003. 3066
Santese, M., Perrone, M. R., Zakey, A. S., De Tomasi, F., and Giorgi, F.: Modeling of Saharan
dust outbreaks over the Mediterranean by RegCM3: case studies, Atmos. Chem. Phys., 10,
133–156, doi:10.5194/acp-10-133-2010, 2010. 3067
Skamarock, W., Klemp, J., Dudhia, J., Gill, D., Barker, D., Wang, W., and Powers, J.: A Description of the Advanced Research WRF Version 2, NCAR Technical Note, Boulder, Colorado,
USA, pp. NCAR/TN–468+STR, 2007. 3071
Spyrou, C., Kallos, G., Mitsakou, C., Athanasiadis, P., Kalogeri, C., and Iacono, M. J.: Modeling
the radiative effects of desert dust on weather and regional climate, Atmos. Chem. Phys., 13,
5489–5504, doi:10.5194/acp-13-5489-2013, 2013. 3067
Szopa, S., Foret, G., Menut, L., and Cozic, A.: Impact of large scale circulation on European summer surface ozone: consequences for modeling, Atmos. Environ., 43, 1189–1195,
doi:10.1016/j.atmosenv.2008.10.039, 2009. 3072
Turquety, S., Menut, L., Bessagnet, B., Anav, A., Viovy, N., Maignan, F., and Wooster, M.: APIFLAME v1.0: high-resolution fire emission model and application to the Euro-Mediterranean
region, Geosci. Model Dev., 7, 587–612, doi:10.5194/gmd-7-587-2014, 2014. 3067, 3073
Vogel, B., Vogel, H., Bäumer, D., Bangert, M., Lundgren, K., Rinke, R., and Stanelle, T.: The
comprehensive model system COSMO-ART – Radiative impact of aerosol on the state of
the atmosphere on the regional scale, Atmos. Chem. Phys., 9, 8661–8680, doi:10.5194/acp9-8661-2009, 2009. 3067
Von Storch, H., Langenberg, H., and Feser, F.: A spectral nudging technique for dynamical
downscaling purposes, Mon. Weather Rev., 128, 3664–3673, 2000. 3071
Vuolo, M., Chepfer, H., Menut, L., and Cezana, G.: Comparison of mineral dust layers vertical
structures modelled with CHIMERE-DUST and observed with the CALIOP lidar, J. Geophys.
Res., 114, D09214, doi:10.1029/2008JD011219, 2009. 3083
Wild, O., Zhu, X., and Prather, M. J.: Fast-J: accurate simulation of in- and below-cloud photolysis in tropospheric chemical models, J. Atmos. Chem., 37, 245–282, 2000. 3072
Full Screen / Esc
Printer-friendly Version
Interactive Discussion
Discussion Paper
Table 1. Characteristics of the AirBase and AERONET stations used in this study. Note that the
AirBase Italian stations of Chitignano, Baceno, Schivenoglia and Vercelli provide daily averaged
values, when all other stations provide hourly (but not regular) measurements. The altitude is
in meters and above sea level (a.s.l.).
|
Site
Country
Lampedusa
Cape Corsica
Italy
France
35.51
42.83
45.
533.
40.73
37.60
36.72
41.92
42.69
43.11
40.41
43.66
619.
10.
36.
28.
57.
33.
10.
650.
−3.59
−2.42
−4.77
0.62
4.83
6.07
8.25
11.07
8.40
40.04
42.46
37.90
44.19
46.82
44.55
46.31
44.99
45.31
501.
386.
119.
50.
46.
741.
1637.
16.
131.
2.66
−22.93
−16.95
−5.93
4.340
−16.49
25.27
−8.15
8.98
13.54
16.73
14.39
13.28
8.32
28.31
35.31
31.61
13.75
250.
60.
0.
285.
350.
2391.
20.
420.
456.
AirBase coastal “background” stations
Zorita
Cartagena
Malaga
Ajaccio
Bastia
Hyeres
Taranto
Chitignano
−0.16
−0.97
−4.46
8.73
9.44
6.13
17.28
11.90
Spain
Spain
Spain
France
France
France
Italy
Italy
AirBase continental “background” stations
Aranjuez
Logrono
Cordoba
Agen
Champforgeuil
Gap
Baceno
Schivenoglia
Vercelli
Spain
Spain
Spain
France
France
France
Italy
Italy
Italy
L. Menut et al.
Title Page
Abstract
Introduction
Conclusions
References
Tables
Figures
J
I
J
I
|
12.63
9.41
ADRIMED measurements sites
Analysis of ozone
and aerosols during
the ADRIMED
experiment
Discussion Paper
Altitude
(m a.s.l.)
15, 3063–3125, 2015
|
Latitude
(◦ )
Discussion Paper
Longitude
(◦ )
ACPD
Back
Close
AERONET stations
Nigeria
Capo Verde
Senegal
Mali
Nigeria
Spain
Greece
Morocco
Nigeria
|
3099
Discussion Paper
Banizoumbou
Capo Verde
Dakar
Cinzana
Ilorin
Izana
Forth Crete
Saada
Zinder Airport
Full Screen / Esc
Printer-friendly Version
Interactive Discussion
Discussion Paper
|
Flight n◦
Ndata
20130 614
20130 616
20130 616
20130 617
20130 617
20130 619
20130 620
20130 622
20130 622
165
167
167
168
168
170
171
173
173
9.05
7.55
11.49
6.76
11.18
11.04
9.83
7.57
12.75
46
36
40
39
32
49
54
47
40
Title Page
Abstract
Introduction
Conclusions
References
Tables
Figures
J
I
J
I
Back
Close
Discussion Paper
|
3100
L. Menut et al.
|
Decimal hour
Analysis of ozone
and aerosols during
the ADRIMED
experiment
Discussion Paper
Jday
15, 3063–3125, 2015
|
28
29
30
31
32
33
34
35
36
Date
Discussion Paper
Table 2. List of ATR flights for the tropospheric measurements of meteorological variables
and ozone concentrations. Ndata corresponds to the number of data after averaging the high
temporal frequency of aircraft measurements to a constant 5 mn time step.
ACPD
Full Screen / Esc
Printer-friendly Version
Interactive Discussion
1.54
2.54
1.46
2.19
1.83
2.42
2.06
1.64
3.50
2.21
4.21
2.26
3.17
−0.92
−1.81
0.87
−1.98
−1.70
−2.11
−1.96
−1.20
−3.39
−2.02
−4.10
−2.12
−3.05
Title Page
Abstract
Introduction
Conclusions
References
Tables
Figures
J
I
J
I
Back
Close
|
3101
0.89
0.87
0.90
0.94
0.99
0.96
0.98
0.95
0.96
0.96
0.95
0.96
0.95
Discussion Paper
292.26
291.41
292.42
291.63
295.63
287.88
296.20
291.90
289.25
287.59
283.80
294.17
292.46
L. Menut et al.
|
293.18
293.22
291.55
293.61
297.33
290.00
298.15
293.11
292.64
289.61
287.89
296.28
295.51
bias
Analysis of ozone
and aerosols during
the ADRIMED
experiment
Discussion Paper
Mod
RMSE
15, 3063–3125, 2015
|
Obs
R
Discussion Paper
Cape Corsica
Zorita
Bastia
Chitignano
Aranjuez
Logrono
Cordoba
Agen
Champforgeuil
Gap
Baceno
Schivenoglia
Vercelli
T2 m
daily mean (K )
|
Site
Discussion Paper
Table 3. Correlations (R), Root Mean Squared Error (RMSE) and bias of measured and modelled daily mean averaged values of 2 m temperature (K). The bias expressed the (model)
minus (observations) values.
ACPD
Full Screen / Esc
Printer-friendly Version
Interactive Discussion
Discussion Paper
Mod
2.10
9.68
4.73
4.12
1.20
6.73
1.40
7.16
7.12
6.53
4.73
6.87
5.59
0.97
6.38
5.18
3.79
0.93
5.73
0.11
2.91
4.11
9.41
11.95
2.44
3.30
bias
0.67
1.00
0.67
0.83
1.00
1.00
1.00
0.64
0.92
0.75
1.00
0.83
0.67
−1.13
−3.29
0.45
−0.33
−0.27
−1.00
−1.29
−4.25
−3.01
2.89
7.22
−4.42
−2.29
Title Page
Abstract
Introduction
Conclusions
References
Tables
Figures
J
I
J
I
Back
Close
Discussion Paper
|
3102
L. Menut et al.
|
Obs
HR
Analysis of ozone
and aerosols during
the ADRIMED
experiment
Discussion Paper
3
4
3
6
1
11
1
14
13
8
19
6
9
Pr (mm day−1 )
15, 3063–3125, 2015
|
Cape Corsica
Zorita
Bastia
Chitignano
Aranjuez
Logrono
Cordoba
Agen
Champforgeuil
Gap
Baceno
Schivenoglia
Vercelli
Nobs
Discussion Paper
Site
|
Table 4. Hit rate (HR) and bias of measured and modelled daily mean averaged values of
precipitation amount (mm day−1 ). The bias expressed the (model) minus (observations) values.
ACPD
Full Screen / Esc
Printer-friendly Version
Interactive Discussion
Nobs
Obs
R
RMSE
bias
Mod
AirBase coastal “background” stations
105.0
113.1
101.0
100.9
97.3
95.7
123.3
110.2
0.66
0.47
0.15
0.39
0.21
0.55
0.70
0.56
−5.6
10.7
−12.6
−6.3
−17.5
−22.9
6.5
10.8
22.0
21.6
21.0
19.3
21.3
16.8
21.5
26.0
−1.0
−4.9
−14.2
0.5
0.3
5.6
−12.4
4.8
AirBase continental “background” stations
Aranjuez
Lograno
Cordoba
Agen
Champforgeuil
Gap
Baceno
Vercelli
38
41
41
41
38
39
39
39
113.3
102.3
127.3
95.3
99.3
98.4
117.0
124.4
112.2
97.5
113.1
95.8
99.5
103.9
104.6
129.2
Introduction
Conclusions
References
Tables
Figures
J
I
J
I
Back
Close
|
3103
0.38
0.55
0.60
0.71
0.54
0.32
0.29
0.61
Title Page
Abstract
Discussion Paper
14.8
16.2
24.2
18.0
25.0
29.3
12.8
20.5
L. Menut et al.
|
110.6
102.4
113.6
107.2
114.8
118.6
116.8
99.4
Analysis of ozone
and aerosols during
the ADRIMED
experiment
Discussion Paper
37
41
40
38
41
41
41
40
15, 3063–3125, 2015
|
Zorita
Cartagena
Malaga
Ajaccio
Bastia
Hyeres
Taranto
Chitignano
Discussion Paper
O3
daily max
|
Site
Discussion Paper
Table 5. Correlations (R), Root Mean Squared Error (RMSE) and bias of measured and mod−3
elled daily maximum value of surface O3 concentrations (µg m ), for representative AirBase
stations.
ACPD
Full Screen / Esc
Printer-friendly Version
Interactive Discussion
Site
O3
hourly
RMSE
bias
Mod
AirBase coastal “background” stations
84.7
93.9
87.4
79.8
76.4
68.2
98.5
89.4
0.71
0.59
0.40
0.40
0.29
0.64
0.74
0.55
10.7
20.5
0.2
6.8
−14.4
−18.3
8.4
17.0
21.3
22.9
17.2
23.0
31.1
35.5
19.6
26.8
3.2
6.8
−1.6
10.3
14.3
25.3
5.1
8.0
AirBase continental “background” stations
Aranjuez
Lograno
Cordoba
Agen
Champforgeuil
Gap
Baceno
Vercelli
841
978
945
977
836
917
913
898
79.7
72.3
91.0
64.6
61.9
66.1
86.3
85.1
82.9
79.1
89.4
74.9
76.2
91.4
91.3
93.1
Introduction
Conclusions
References
Tables
Figures
J
I
J
I
Back
Close
|
3104
0.67
0.66
0.81
0.73
0.67
0.36
0.62
0.68
Title Page
Abstract
Discussion Paper
28.2
29.7
23.5
26.1
27.8
29.1
19.0
27.6
L. Menut et al.
|
74.0
73.4
87.2
73.0
90.8
86.5
90.1
72.4
Analysis of ozone
and aerosols during
the ADRIMED
experiment
Discussion Paper
815
956
907
892
978
983
575
892
15, 3063–3125, 2015
|
Zorita
Cartagena
Malaga
Ajaccio
Bastia
Hyeres
Taranto
Chitignano
Discussion Paper
Obs
R
|
Nobs
Discussion Paper
Table 6. Correlations (R), Root Mean Squared Error (RMSE) and bias of measured and modelled of hourly surface O3 concentrations (µg m−3 ), for representative AirBase stations.
ACPD
Full Screen / Esc
Printer-friendly Version
Interactive Discussion
Discussion Paper
|
Site
Mod
0.59
0.49
0.53
0.58
0.38
0.05
0.16
0.24
0.56
0.11
0.46
0.46
0.65
0.45
0.42
0.15
0.22
0.24
0.69
0.17
RMSE
bias
0.27
0.50
0.55
0.58
0.20
0.77
0.79
0.65
0.41
0.49
0.49
0.16
0.23
0.34
0.35
0.15
0.09
0.15
0.43
0.08
−0.12
−0.03
0.13
−0.13
0.04
0.10
0.06
0.00
0.13
0.06
Title Page
Abstract
Introduction
Conclusions
References
Tables
Figures
J
I
J
I
Back
Close
Discussion Paper
|
3105
L. Menut et al.
|
Obs
R
Analysis of ozone
and aerosols during
the ADRIMED
experiment
Discussion Paper
357
166
248
338
104
516
238
410
345
108
AOD
hourly
15, 3063–3125, 2015
|
Banizoumbou
Capo Verde
Dakar
Cinzana
Ilorin
Izana
Lampedusa
Saada
Zinder Airport
Forth Crete
Nobs
Discussion Paper
Table 7. Correlations (R), Root Mean Squared Error (RMSE) and bias of measured and modelled hourly Aerosol Optical Depth, for the AERONET stations.
ACPD
Full Screen / Esc
Printer-friendly Version
Interactive Discussion
Table 8. Correlation (R), bias and RMSE for the daily mean averaged PM10 (µg m ) surface
concentrations (except for the Lampedusa measurements corresponding to Total Suspended
Particles).
Site
PM10
daily mean
RMSE
bias
0.59
−0.02
−0.09
0.15
0.09
0.68
0.48
0.66
8.9
12.7
20.0
11.2
9.5
6.3
7.0
10.8
−0.5
1.5
−2.4
6.6
3.9
−3.3
1.6
10.0
12.8
10.1
18.1
9.7
9.7
4.9
8.7
12.1
7.2
−8.8
−8.5
2.2
2.1
1.6
0.5
4.8
−6.8
2.9
Mod
AirBase coastal “background” stations
15.5
23.1
30.1
27.6
25.0
25.9
21.4
20.3
AirBase continental “background” stations
38
41
41
41
41
35
33
39
36
23.1
23.2
21.2
14.5
15.8
13.0
7.9
27.5
16.3
14.3
14.7
23.4
16.6
17.5
13.5
12.6
20.6
19.2
Title Page
Introduction
Conclusions
References
Tables
Figures
J
I
J
I
Back
Close
|
3106
0.41
0.46
0.23
−0.04
0.17
0.56
0.38
0.32
0.68
L. Menut et al.
Abstract
Discussion Paper
Aranjuez
Logrono
Cordoba
Agen
Champforgeuil
Gap
Baceno
Schivenoglia
Vercelli
Analysis of ozone
and aerosols during
the ADRIMED
experiment
|
16.1
21.6
32.5
21.0
21.1
29.2
19.8
10.4
15, 3063–3125, 2015
Discussion Paper
37
41
40
33
40
41
39
40
ACPD
|
Zorita
Cartagena
Malaga
Ajaccio
Bastia
Hyeres
Taranto
Chitignano
Discussion Paper
Obs
R
|
Nobs
Discussion Paper
−3
Full Screen / Esc
Printer-friendly Version
Interactive Discussion
Ammonium
PPM
POM
EC
Dust
0.70
2.57
0.79
0.71
2.74
5.92
2.64
2.65
0.45
3.67
20.20
28.39
19.43
19.16
14.97
22.79
28.05
18.54
25.75
26.16
23.71
10.77
5.95
19.28
19.35
11.94
7.84
12.56
14.21
4.78
2.95
5.18
2.70
2.74
3.62
5.96
5.48
10.56
7.38
7.51
2.86
6.95
2.16
3.27
4.17
12.36
7.71
23.79
4.27
6.50
1.06
2.70
0.74
1.25
1.64
4.85
2.99
9.57
1.69
2.59
35.75
20.66
55.90
42.92
44.20
12.88
20.20
8.59
27.79
22.39
AirBase coastal “background” stations
Lampedusa
Cape Corsica
Zorita
Cartagena
Malaga
Ajaccio
Bastia
Hyeres
Taranto
Chitignano
6.17
12.26
5.12
3.76
3.20
13.91
14.36
7.05
9.25
15.87
6.60
10.51
7.20
6.92
6.12
9.40
10.74
6.69
9.21
10.54
AirBase continental “background” stations
3.80
10.03
2.73
9.36
11.46
12.68
12.82
14.03
13.58
6.69
10.82
5.39
9.67
11.13
10.27
10.81
11.04
9.64
0.83
4.22
0.40
3.47
8.17
4.17
9.39
7.89
3.17
17.52
28.25
14.34
24.56
24.93
25.63
23.35
24.73
24.40
4.07
3.19
2.50
5.06
6.58
6.35
4.89
7.93
9.08
3.43
2.34
2.18
3.39
3.79
4.07
3.51
6.32
6.85
0.93
0.80
0.68
1.35
1.69
1.75
1.43
2.66
2.93
57.23
33.60
64.48
30.39
25.01
31.24
31.81
21.63
27.65
Introduction
Conclusions
References
Tables
Figures
J
I
J
I
Back
Close
|
3107
5.50
6.76
7.29
12.76
7.25
3.85
2.00
3.77
2.68
Title Page
Abstract
Discussion Paper
Aranjuez
Logrono
Cordoba
Agen
Champforgeuil
Gap
Baceno
Schivenoglia
Vercelli
L. Menut et al.
|
Sea salt
Analysis of ozone
and aerosols during
the ADRIMED
experiment
Discussion Paper
Sulphate
15, 3063–3125, 2015
|
Nitrate
Discussion Paper
SOA
|
Site
Discussion Paper
Table 9. Relative percentages of the chemical composition of the modelled surface PM10 for
each site. Values are calculated using the hourly values for the period from the 1 June to the
15 July 2013. For each site, the largest value is bolded.
ACPD
Full Screen / Esc
Printer-friendly Version
Interactive Discussion
Discussion Paper
|
Discussion Paper
Analysis of ozone
and aerosols during
the ADRIMED
experiment
L. Menut et al.
Title Page
Abstract
Introduction
Discussion Paper
Conclusions
References
Tables
Figures
J
I
J
I
|
Back
Close
Discussion Paper
|
3108
15, 3063–3125, 2015
|
Figure 1. Synthesis of all aerosols types and transport pathways in the Mediterranean area.
BL and FT stand for “boundary layer” and “free troposphere”, respectively.
ACPD
Full Screen / Esc
Printer-friendly Version
Interactive Discussion
Discussion Paper
|
Discussion Paper
Analysis of ozone
and aerosols during
the ADRIMED
experiment
L. Menut et al.
Title Page
Abstract
Introduction
Discussion Paper
Conclusions
References
Tables
Figures
J
I
J
I
|
Back
Close
Discussion Paper
|
3109
15, 3063–3125, 2015
|
Figure 2. Locations of the AirBase (top) and AERONET (bottom) stations providing the O3 ,
PM10 , aerosols optical depth (AOD) and aerosols size distributions (ASD) measurements used
in this study.
ACPD
Full Screen / Esc
Printer-friendly Version
Interactive Discussion
Discussion Paper
|
Discussion Paper
Analysis of ozone
and aerosols during
the ADRIMED
experiment
L. Menut et al.
Title Page
Abstract
Introduction
Discussion Paper
Conclusions
References
Tables
Figures
J
I
J
I
|
Back
Close
Discussion Paper
|
3110
15, 3063–3125, 2015
|
Figure 3. ATR-42 horizontal trajectories for the flight of the 14 June (red), 16 and 17 June
(blue), 19 and 20 June (green) and 22 June (green-blue).
ACPD
Full Screen / Esc
Printer-friendly Version
Interactive Discussion
Discussion Paper
|
Discussion Paper
Analysis of ozone
and aerosols during
the ADRIMED
experiment
L. Menut et al.
Title Page
Abstract
Introduction
Discussion Paper
Conclusions
References
Tables
Figures
J
I
J
I
|
Back
Close
Discussion Paper
|
3111
15, 3063–3125, 2015
|
Figure 4. ATR-42 vertical trajectories for the flight of the 14 June (red), 16 and 17 June (blue),
19 and 20 June (green) and 22 June (green-blue).
ACPD
Full Screen / Esc
Printer-friendly Version
Interactive Discussion
Discussion Paper
|
Discussion Paper
Analysis of ozone
and aerosols during
the ADRIMED
experiment
L. Menut et al.
Title Page
Abstract
Introduction
Discussion Paper
Conclusions
References
Tables
Figures
J
I
J
I
|
Back
Close
Discussion Paper
|
3112
15, 3063–3125, 2015
|
Figure 5. The simulation domain for WRF and CHIMERE. A Lambert conformal projection is
used with a constant horizontal resolution of 60 km × 60 km. Colors represent the 2 m temperature (in Kelvin) for the 21 12 June:00 UTC, and the vectors represent the 10 m wind speed.
ACPD
Full Screen / Esc
Printer-friendly Version
Interactive Discussion
Discussion Paper
|
Discussion Paper
Analysis of ozone
and aerosols during
the ADRIMED
experiment
L. Menut et al.
Title Page
Abstract
Introduction
Discussion Paper
Conclusions
References
Tables
Figures
J
I
J
I
|
Back
Close
Discussion Paper
|
3113
15, 3063–3125, 2015
|
Figure 6. Synthesis of vegetation fires events observed during the summer of 2013, from the
1 June to the 31 August. [top] week of first detection, [bottom] number of events.
ACPD
Full Screen / Esc
Printer-friendly Version
Interactive Discussion
Discussion Paper
|
Discussion Paper
Analysis of ozone
and aerosols during
the ADRIMED
experiment
L. Menut et al.
Title Page
Abstract
Introduction
Discussion Paper
Conclusions
References
Tables
Figures
J
I
J
I
|
Back
Close
Discussion Paper
|
3114
15, 3063–3125, 2015
|
Figure 7. Comparison of daily mean averaged 2 m temperature (K) and daily accumulated
−1
precipitation amount (mm day ) with E-OBS (available over land only) and the WRF meteorological model.
ACPD
Full Screen / Esc
Printer-friendly Version
Interactive Discussion
Discussion Paper
Agen
|
Bastia
L. Menut et al.
Title Page
Abstract
Introduction
Conclusions
References
Tables
Figures
J
I
J
I
|
Back
Close
Discussion Paper
|
3115
Analysis of ozone
and aerosols during
the ADRIMED
experiment
Discussion Paper
Figure 8. Time series of daily mean averaged 2 m temperature (K) and daily precipitation
amount (mm day−1 ) for several sites where chemical measurements are also available. Time
series are extracted from maps of E-OBS daily data.
15, 3063–3125, 2015
|
Zorita
Discussion Paper
Vercelli
ACPD
Full Screen / Esc
Printer-friendly Version
Interactive Discussion
Discussion Paper
|
Discussion Paper
Analysis of ozone
and aerosols during
the ADRIMED
experiment
L. Menut et al.
Title Page
Abstract
Introduction
Discussion Paper
Conclusions
References
Tables
Figures
J
I
J
I
|
Back
Close
Discussion Paper
|
3116
15, 3063–3125, 2015
|
Figure 9. Modelled surface ozone concentrations (µg m−3 ) for the 16, 20 and 24 June 2013 at
12:00 UTC.
ACPD
Full Screen / Esc
Printer-friendly Version
Interactive Discussion
Discussion Paper
|
Malaga
Bastia
Champforgeuil
Zorita
Discussion Paper
Ajaccio
15, 3063–3125, 2015
Analysis of ozone
and aerosols during
the ADRIMED
experiment
L. Menut et al.
Title Page
Agen
|
Abstract
Introduction
Discussion Paper
Conclusions
References
Tables
Figures
J
I
J
I
|
Figure 10. Time series of daily maximum of O3 surface concentrations for some selected AirBase sites, continental and coastal stations.
Back
Close
Discussion Paper
|
3117
ACPD
Full Screen / Esc
Printer-friendly Version
Interactive Discussion
Discussion Paper
|
Discussion Paper
Analysis of ozone
and aerosols during
the ADRIMED
experiment
L. Menut et al.
Title Page
Abstract
Introduction
Discussion Paper
Conclusions
References
Tables
Figures
J
I
J
I
|
Back
Close
Discussion Paper
|
3118
15, 3063–3125, 2015
|
Figure 11. Surface ozone concentrations (ppb) map for the 17 June 2013, 12:00 UTC.
ACPD
Full Screen / Esc
Printer-friendly Version
Interactive Discussion
20130616 7.55 flight 29
20130616 11.49 flight 30
Discussion Paper
20130614 9.05 flight 28
|
Introduction
Conclusions
References
Tables
Figures
J
I
J
I
Back
Close
|
3119
Title Page
Abstract
Discussion Paper
Figure 12. Comparisons between observed and modelled O3 concentrations, temperature and
wind speed along the flight trajectories. The top plot indicates the altitude a.s.l. of the flight.
L. Menut et al.
|
20130622 12.75 flight 36
Analysis of ozone
and aerosols during
the ADRIMED
experiment
Discussion Paper
20130622 7.57 flight 35
20130619 11.04 flight 33
15, 3063–3125, 2015
|
20130620 9.83 flight 34
20130617 11.18 flight 32
Discussion Paper
20130617 6.76 flight 31
ACPD
Full Screen / Esc
Printer-friendly Version
Interactive Discussion
Discussion Paper
|
Discussion Paper
Analysis of ozone
and aerosols during
the ADRIMED
experiment
L. Menut et al.
Title Page
Abstract
Introduction
Discussion Paper
Conclusions
References
Tables
Figures
J
I
J
I
|
Back
Close
Discussion Paper
|
3120
15, 3063–3125, 2015
|
Figure 13. Comparison of Aerosol Optical Depth measured by MODIS (top) and modelled with
CHIMERE (bottom). This AOD corresponds to the mean averaged value over the period from
6 June to 15 July 2013.
ACPD
Full Screen / Esc
Printer-friendly Version
Interactive Discussion
Discussion Paper
|
Figure 14. Time series of hourly Aerosol Optical Depth (AOD) for selected AERONET stations.
Title Page
Abstract
Introduction
Conclusions
References
Tables
Figures
J
I
J
I
Back
Close
Discussion Paper
|
3121
L. Menut et al.
|
Izana
Analysis of ozone
and aerosols during
the ADRIMED
experiment
Discussion Paper
Forth Crete
Dakar
15, 3063–3125, 2015
|
Lampedusa
Capo Verde
Discussion Paper
Banizoumbou
ACPD
Full Screen / Esc
Printer-friendly Version
Interactive Discussion
Discussion Paper
|
Champforgeuil
Zorita
Agen
Malaga
Discussion Paper
Ajaccio
15, 3063–3125, 2015
Analysis of ozone
and aerosols during
the ADRIMED
experiment
L. Menut et al.
Title Page
Hyeres
|
Abstract
Introduction
Discussion Paper
Conclusions
References
Tables
Figures
J
I
J
I
|
Figure 15. Time series of daily averaged PM10 surface concentrations for some selected AirBase sites, continental and coastal stations.
Back
Close
Discussion Paper
|
3122
ACPD
Full Screen / Esc
Printer-friendly Version
Interactive Discussion
Discussion Paper
Lampedusa
Cape Corsica
Zorita
|
Champforgeuil
Agen
Analysis of ozone
and aerosols during
the ADRIMED
experiment
L. Menut et al.
Title Page
Abstract
Introduction
Discussion Paper
Conclusions
References
Tables
Figures
J
I
J
I
|
Back
Close
Discussion Paper
|
3123
15, 3063–3125, 2015
|
Figure 16. Time series of hourly surface concentrations of all modelled aerosols for the
ADRIMED sites (Lampedusa and Cape Corsica) and some selected AirBase sites, continental
and coastal stations.
Discussion Paper
Malaga
ACPD
Full Screen / Esc
Printer-friendly Version
Interactive Discussion
Cape Corsica
Zorita
Discussion Paper
Lampedusa
|
Champforgeuil
Agen
Analysis of ozone
and aerosols during
the ADRIMED
experiment
L. Menut et al.
Title Page
Abstract
Introduction
Discussion Paper
Conclusions
References
Tables
Figures
J
I
J
I
|
Back
Close
Discussion Paper
|
3124
15, 3063–3125, 2015
|
Figure 17. Vertical profiles of all modelled aerosols for the 21 June 2013. Results are presented
for the ADRIMED sites (Lampedusa and Cape Corsica) and some selected AirBase sites, continental and coastal stations. Note that the abscissa is different in each plot to better see the
values.
Discussion Paper
Malaga
ACPD
Full Screen / Esc
Printer-friendly Version
Interactive Discussion
Discussion Paper
Cinzana 17:00
Cinzana 17:00
Capo Verde 15:00
Capo Verde 15:00
Izana 17:00
Izana 16:00
Lampedusa 15:00
Lampedusa 15:00
Analysis of ozone
and aerosols during
the ADRIMED
experiment
L. Menut et al.
Title Page
Abstract
Introduction
Discussion Paper
Conclusions
References
Tables
Figures
J
I
J
I
|
Back
Close
Discussion Paper
|
3125
15, 3063–3125, 2015
|
Figure 18. Comparisons between the measured (AERONET) and modelled (CHIMERE)
aerosols size distribution for the locations of Banizoumbou, Cinzana, Capo Verde, Izana and
Lampedusa. Distributions are presented for the 17 and 21 June 2013, and for hours where the
AERONET hourly inverted distributions are available.
Discussion Paper
21 June 2013
Banizoumbou 15:00
|
17 June 2013
Banizoumbou 07:00
ACPD
Full Screen / Esc
Printer-friendly Version
Interactive Discussion
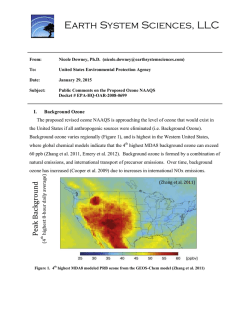


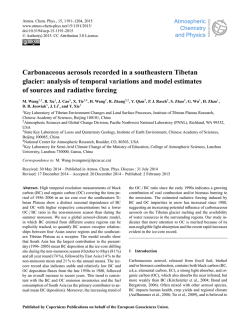
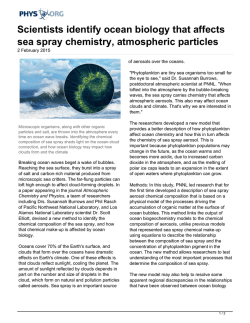


© Copyright 2026