
Public Comments on the Proposed Ozone NAAQS
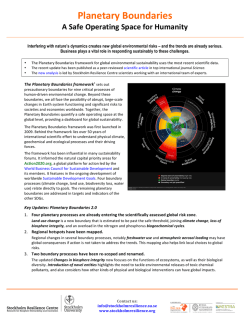
Earth System Sciences, LLC From: Nicole Downey, Ph.D. ([email protected]) To: United States Environmental Protection Agency Date: January 29, 2015 Subject: Public Comments on the Proposed Ozone NAAQS Docket # EPA-HQ-OAR-2008-0699 I. Background Ozone The proposed revised ozone NAAQS is approaching the level of ozone that would exist in the United States if all anthropogenic sources were eliminated (i.e. Background Ozone). Background ozone varies regionally (Figure 1), and is highest in the Western United States, where global chemical models indicate that the 4th highest MDA8 background ozone can exceed 60 ppb (Zhang et al. 2011, Emery et al. 2012). Background ozone is formed by a combination of natural emissions, and international transport of precursor emissions. Over time, background (4 highest 8-hour daily average) (Zhang et al, 2011) th Peak Background ozone has increased (Cooper et al. 2009) due to increases in international NOx emissions. Figure 1. 4th highest MDA8 modeled PRB ozone from the GEOS-Chem model (Zhang et al. 2011) Border states such as Texas and California have the highest impact from international emissions (Figure 2, Wang et al. 2009), and these emissions are not controllable by US regulatory policy. It will be disproportionally difficult for border states and areas with high background ozone to achieve lower ozone standards due to the relatively smaller increment between background ozone and the ozone standard. (Wang et al, 2011) Figure 2. Modeled summer average enhancement of ozone from Canadian and Mexican precursor emissions (Wang et al. 2009). II. Addressing Background Ozone During Implementation. Throughout the ozone NAAQS review cycle, and in the proposed rule, EPA has argued that background can be dealt with during implementation, and should not be considered in the NAAQS setting process. EPA suggests that three current provisions in the Clean Air Act can be invoked to alleviate the burden associated with background ozone. These include the Exceptional Events Rule, the Rural Transport Rule and the International Transport rule. The EPA process to identify, flag and ultimately approve an exceptional event is time consuming and burdensome to the states. With a lower NAAQS ozone standard, there will be more exceedances due to non-local sources, and the number of exceptional events or international transport events will increase significantly, thereby increasing that burden on both the states and EPA. Current state-of-the science modeling technology is not refined enough to provide accurate source apportionment of ozone for natural and international sources. For example, there is Earth System Sciences, LLC 2 significant uncertainty in the relationship between wildfire emissions and ozone impacts (Jaffe and Widger, 2012), and different parameterizations of wildfire emissions produce drastically different ozone impacts (Emery et al., 2012, Zhang et al., 2014). Stratospheric intrusions, or smaller tropospheric folds directly transport stratospheric ozone into the troposphere, and many chemical transport models under predict the magnitude of stratospheric flux into the troposphere. Lightning production of NOx is poorly understood, and poorly constrained in chemical transport models, but can produce a large increase in modeled surface ozone (Zhang et al., 2011, Zhang et al. 2014). NOx yields and the vertical distribution of NOx in the atmosphere remain key uncertainties. The quality of international emission inventories is generally lower than domestic inventories, and it is not uncommon to see a factor of 2 uncertainty in emissions estimates (i.e. Zhang et al. 2008). Taken together, the uncertainties in modeling background ozone sources will impart significant uncertainty on determining whether events are due to background ozone. In the Western US, background ozone is persistently high, and exceedances of a lower standard may not be solely due to large single-source events (such as stratospheric intrusions), but will be due to a combination of background sources that will not be easily identifiable or distinct. The Exceptional Events policy states that an exceptional event must be ‘associated with a measured concentration in excess of normal historical fluctuations, including background’, which will prohibit states from excluding routine events that are above the standard, but not ‘in excess of normal historical fluctuations, including background’. III. Source Apportionment vs. Zero-Out Runs The RIA discusses source apportionment modeling runs that describe the relationship between background ozone and ambient ozone. EPA has argued that Source Apportionment based modeling is more appropriate than zero-out modeling of background ozone because zeroout modeling results in ‘artifacts’ where modeled background ozone is higher than observations (p 2a-16, l470-473). There are, however, cases where anthropogenic emissions of NOx result in depressed ambient ozone levels due to NOx scavenging (Figure 3). In these cases, if anthropogenic emissions were removed, ambient ozone (due to background) would be higher than recent conditions. This is a real feature of ozone’s highly non-linear chemistry, and is not an artifact of zero-out modeling. Earth System Sciences, LLC 3 Figure 3. Modeled PRB ozone from CAMx (Emery et al. 2011) as a function of total observed ozone. Notice that a significant number of points lie above the 1:1 total ozone to PRB line, which results from the elimination of NOx scavenging by anthropogenic emissions in a PRB scenario. Background ozone changes dynamically as it interacts with anthropogenic precursor emissions. Source apportionment modeling is useful to estimate the fraction of current ozone due to particular sources, such as background (Figure 4 (a)). Zero-out modeling is useful to estimate ozone levels in the absence of anthropogenic emissions (Figure 4 (b)). These are two fundamentally different quantities. The question becomes, how does one best estimate the ‘risk in excess of background ozone’? Source apportionment runs, such as those presented in the PA and RIA, give information about the concentration of recent ozone that is directly due to background. If however, anthropogenic emissions are reduced to meet a lower ozone standard, the concentration of ozone due to background will increase because fewer ‘background ozone molecules’ will be destroyed by anthropogenic NOx emissions. Additionally, the probability that a natural NOx and natural VOC precursor emission will react to form ozone will increase because they will be less likely to react with an anthropogenic NOx or VOC molecule (which results in ‘anthropogenic ozone’ in the CAMx Source Apportionment tool). Earth System Sciences, LLC 4 Example (Not Real Data) 160 background 140 120 (a) anthropogenic (b) 100 80 60 40 20 0 0 10 20 30 40 50 60 70 % US Anthropogenic Emissions 80 90 100 Figure 4. Hypothetical distribution of background as a function of anthropogenic emissions. A source apportionment run will generate an estimate of background at 100% anthropogenic emissions (a), while a zero-out run will generate an estimate of background at 0% anthropogenic emissions (b). As anthropogenic precursor emissions are reduced, the concentration of background ozone will increase, and the risk due to background ozone will also increase. To estimate the risk in excess of background, it is most appropriate to use a zero-out modeling run, because this represents the minimum risk that is achievable by US regulatory policy. The analysis summarizing the fractional contribution of background to observed ozone is not an appropriate analysis to estimate the fraction of risk due to background. EPA should conduct mortality, morbidity and welfare modeling using a time-series of background ozone from a zero-out run, taking known limitations of those models in estimating peak background ozone concentrations into account. References: Emery, C., J. Jung, N. Downey, J. Johnson, M. Jimenez, G. Yarwood, R. Morris, 2012. Regional and global modeling estimates of policy relevant background ozone over the United States. Atmospheric Environment, doi:10.1016/j.atmosenv.2011.11.012. Jaffe, D. A., & Wigder, N. L. (2012). Ozone production from wildfires: A critical review. Atmospheric Environment, 51, 1-10. Wang, H., Jacob, D. J., Le Sager, P., Streets, D. G., Park, R. J., Gilliland, A. B., & Van Donkelaar, A. (2009). Surface ozone background in the United States: Canadian and Mexican pollution influences. Atmospheric Environment, 43(6), 1310-1319. Zhang, L., Jacob, D. J., Boersma, K. F., Jaffe, D. A., Olson, J. R., Bowman, K. W., ... & Weinheimer, A. J. (2008). Transpacific transport of ozone pollution and the effect of recent Asian emission increases on air quality in North America: an integrated analysis using satellite, aircraft, ozonesonde, and surface observations. Atmospheric Chemistry and Physics Discussions, 8(2), 8143-8191. Zhang L., Jacob D.J., Downey N.V., Wood D.A., Blewitt D., Carouge C.C., van Donkelaar A., Jones D.B.A., Murray L.T., Wang Y., 2011. Improved estimate of the policy-relevant background ozone in the United States using the GEOS-Chem global model with 1/22/3 horizontal resolution over North America. Atmospheric Environment, doi:10.1016/j.atmosenv.2011.07.054. Earth System Sciences, LLC 5


© Copyright 2026