
3rd Quarter 2014 - European Central Bank
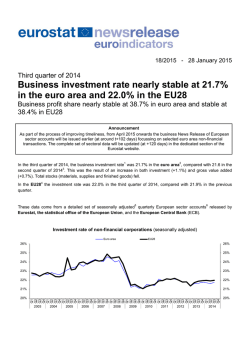
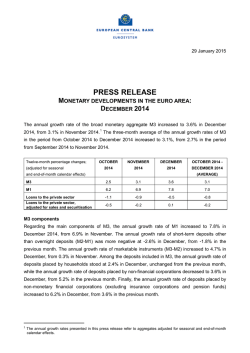
PRESS RELEASE
28 January 2015
EURO AREA ECONOMIC AND FINANCIAL DEVELOPMENTS BY
INSTITUTIONAL SECTOR: 3rd Quarter 2014
The new European System of Accounts (ESA 2010) transmission programme and the new ECB
Guideline on quarterly financial accounts allow presenting the economic and financial developments
by institutional sector with an improved timeliness. Advanced results for households and non-financial
corporations were published on 20 January 2015. The current press release includes detailed and
updated results for the total euro area economy and all institutional sectors.
• Euro area gross saving, which is the sum of the savings of households, corporations and government,
increased after decreasing previously (third quarter 2014: 2.5%, second quarter: -0.6%).
• The increase in euro area savings was only partially matched by the continued slow increase in euro
area gross fixed capital formation (0.7% after 0.9%), which grew only moderately in case of households
and non-financial corporations and declined for financial corporations and government.
• Net lending by euro area households and non-financial corporations increased as a percentage of euro
area net disposable income (third quarter 2014: 3.7% and 1.0%, compared to third quarter 2013: 3.5%
and 0.7%), while net lending by the financial corporations sector and net borrowing by the government
sector decreased. As a result, euro area net lending to the rest of the world increased to 3.1% of net
disposable income.
PRESS RELEASE / 28 January 2015
EURO AREA ECONOMIC AND FINANCIAL
DEVELOPMENTS BY INSTITUTIONAL SECTOR: 3rd Quarter 2014
Total euro area economy
Euro area gross saving, which is the sum of the savings of households, corporations and government,
increased after decreasing previously (third quarter 2014: 2.5%, second quarter: -0.6%). The increase in
euro area savings was only partially matched by the continued slow increase in euro area gross fixed
capital formation (0.7% after 0.9%). As a result, euro area net lending to the rest of the world increased to
3.1% of net disposable income. Net lending by euro area households and non-financial corporations
increased as a percentage of euro area net disposable income (third quarter 2014: 3.7% and 1.0%,
compared to third quarter 2013: 3.5% and 0.7%), while net lending by the financial corporations sector
and net borrowing by the government sector decreased.
Households
Household gross disposable income increased at a higher annual rate (third quarter 2014: 2.2% after
1.2% in the second quarter). Compensation of employees grew at a higher rate (2.3% after 2.1%) while
the growth of gross operating surplus and mixed income from the self-employed slowed (0.4% after
1.1%).
Household consumption expenditure increased at a higher annual rate (2.0% after 1.7%). The household
gross saving rate was 13.0% in the third quarter of 2014, compared to 12.9% in the third quarter of 2013.
Household gross non-financial investment increased after being unchanged previously (0.3% after 0.0%).
Household financing decreased at a broadly unchanged annual rate (-0.2% after -0.1%). Loan financing
remained broadly unchanged (-0.1%, after 0.0%).
Household financial investment grew at an unchanged rate (1.5%). Among the components, additions to
currency and deposits grew at a broadly unchanged rate (2.5% after 2.4%), while investments in shares
and other equity and additions to life insurance and pension schemes accelerated (to 2.8% after 2.0%,
and to 3.3% after 3.1% respectively).
Household net worth increased at a lower rate (2.7% after 2.9%), with the continued increase being
explained by increases in financial and non-financial investments as well as net valuation gains, which
exceeded the incurrence of debt. The value of housing wealth increased after having declined in the
previous quarter (0.3 after -0.1%). The household debt ratio decreased to 94.9% in the third quarter of
2014, from 96.7% in the third quarter of 2013.
Household saving, change in net worth and debt
(percentages of adjusted gross disposable income, based on four-quarter cumulated flows)
Saving rate (gross)
Change in net worth
Non-financial investment (net)
Financial investment
Financing (-)
Revaluation of assets and other changes
Debt (loans, outstanding amount)
2012Q4 2013Q1 2013Q2 2013Q3 2013Q4 2014Q1 2014Q2 2014Q3
12.9
12.9
12.8
12.9
13.1
13.1
13.0
13.0
4.1
-4.3
-1.2
3.0
2.6
12.2
19.0
17.7
1.7
1.6
1.5
1.4
1.3
1.3
1.3
1.3
5.3
4.6
4.7
4.4
3.9
4.2
4.5
4.7
0.5
0.0
-0.1
-0.3
-0.9
-0.5
-0.1
-0.2
-2.5
-10.5
-7.5
-3.1
-3.5
6.2
13.1
11.6
97.4
97.0
97.1
96.7
96.1
95.5
95.5
94.9
European Central Bank Directorate General Communications & Language Services
Global Media Relations Division, Sonnemannstrasse 20, 60314 Frankfurt am Main, Germany
Tel.: +49 69 1344 7455, e-mail: [email protected], website: www.ecb.europa.eu
Reproduction is permitted provided that the source is acknowledged.
PRESS RELEASE / 28 January 2015
EURO AREA ECONOMIC AND FINANCIAL
DEVELOPMENTS BY INSTITUTIONAL SECTOR: 3rd Quarter 2014
Non-financial corporations
Net entrepreneurial income of non-financial corporations and net value added increased at higher annual
rates (5.5% after 0.6%, and 1.4% after 0.9%, respectively). Non-financial investment decreased at a
faster rate (-0.9% after -0.5%). This was due to declining inventories (-2.8 percentage points) while gross
fixed capital formation grew at a higher rate (1.9% after 1.0%).
Financing of non-financial corporations grew at a broadly unchanged annual rate (0.9% after 1.0%). Loan
financing was reduced at a broadly unchanged rate (-0.9% after -0.8%), as the decline in loans granted
1
by non-MFIs accelerated while the decline of loans granted by MFIs slowed. The issuance of debt
securities grew, albeit at a lower rate (4.2% after 6.1%). Trade credit financing increased at a higher rate
(0.5% after 0.3%). The debt ratio, which includes trade credit, decreased to 129.6% in the third quarter of
2014, from 132.1% in the third quarter of 2013. Equity financing grew at a lower rate (1.1% after 1.4%).
Non-financial corporations
(percentages of net value added, based on four-quarter cumulated flows)
Net entrepreneurial income (current profits)
Net saving (retained earnings)
Non-financial investment (net)
Debt (outstanding amount to GDP)
2012Q4 2013Q1 2013Q2 2013Q3 2013Q4 2014Q1 2014Q2 2014Q3
31.2
31.2
31.1
31.2
30.6
31.0
31.0
31.3
1.5
1.9
1.9
1.9
2.3
2.4
2.2
2.3
3.4
2.6
2.2
2.3
2.2
2.3
2.1
2.0
133.5
133.5
132.9
132.1
130.2
129.4
130.3
129.6
Financial investment grew at a lower rate (1.7% after 2.0%). Among the components, loans granted grew
at a lower rate (0.6% after 1.3%), and investment in shares and other equity grew at a higher rate (0.7%
after 0.4%).
For media queries, please contact Stefan Ruhkamp, tel.: +49 69 1344 5057.
This press release incorporates revisions compared to the press release on “Euro area households and
non-financial corporations” of 20 January mainly due to the inclusion of a complete set of data for the
government sector. Euro area charts and additional tables are available under "Euro area accounts" in
the statistics section of the ECB's website at: Euro area charts and additional tables. Quarterly financial
and non-financial accounts by institutional sector are available at the ECB’s Statistical Data Warehouse
(SDW). The next quarterly press release, with advanced results for households and non-financial
corporations, is scheduled for 14 April 2015 (see also the Statistical Release Calendar on the ECB
website: calendar).
Notes:
• The annual growth rate of non-financial transactions and of outstanding assets and liabilities (stocks) is calculated as the
percentage change between the value of the transaction or outstanding amount for a given quarter and that value
recorded four quarters earlier. The annual growth rates used to analyse financial transactions refer to the total value of
transactions during the year in relation to the outstanding stock a year before.
1
Loan financing comprises loans granted by all sectors (including loans granted by non-MFI financial institutions) and by creditors
that are not residents in the euro area.
European Central Bank Directorate General Communications & Language Services
Global Media Relations Division, Sonnemannstrasse 20, 60314 Frankfurt am Main, Germany
Tel.: +49 69 1344 7455, e-mail: [email protected], website: www.ecb.europa.eu
Reproduction is permitted provided that the source is acknowledged.
PRESS RELEASE / 28 January 2015
EURO AREA ECONOMIC AND FINANCIAL
DEVELOPMENTS BY INSTITUTIONAL SECTOR: 3rd Quarter 2014
• Net entrepreneurial income is broadly equivalent to current profits in business accounting (after the receipt and payment
of interest and including the profits of foreign subsidiaries, but before the payment of income taxes and dividends).
• The non-financial corporation debt ratio is defined here as the outstanding amount of loans, debt securities, trade credits
and pension scheme liabilities as a percentage of GDP. The sum of household debt and non-financial corporation debt
(also referred to as “private debt”), as a percentage of GDP is one of the headline indicators of the macroeconomic
imbalances procedure (MIP). For non-financial corporations the definition of debt used by the MIP differs from the
definition applied here as the MIP indicator is based on annual, consolidated (excluding debt financing within the NFC
sector) data, moreover, pension fund reserve liabilities and trade credits are excluded. For the MIP data see: Annual
scoreboard for the surveillance of macroeconomic imbalances.
•
Further methodological information is available at: Euro area accounts.
European Central Bank Directorate General Communications & Language Services
Global Media Relations Division, Sonnemannstrasse 20, 60314 Frankfurt am Main, Germany
Tel.: +49 69 1344 7455, e-mail: [email protected], website: www.ecb.europa.eu
Reproduction is permitted provided that the source is acknowledged.


© Copyright 2026