
Business investment rate nearly stable at 21.7% in the euro
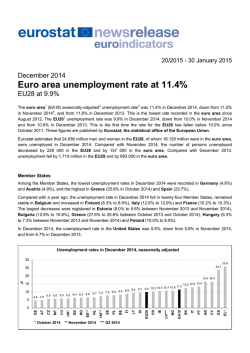
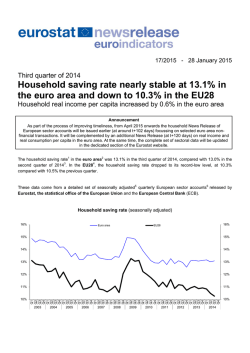
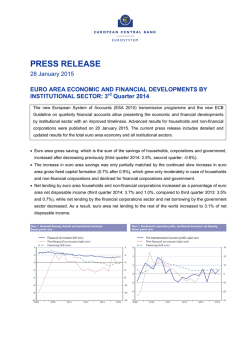
18/2015 - 28 January 2015
Third quarter of 2014
Business investment rate nearly stable at 21.7%
in the euro area and 22.0% in the EU28
Business profit share nearly stable at 38.7% in euro area and stable at
38.4% in EU28
Announcement
As part of the process of improving timeliness, from April 2015 onwards the business News Release of European
sector accounts will be issued earlier (at around t+102 days) focussing on selected euro area non-financial
transactions. The complete set of sectoral data will be updated (at +120 days) in the dedicated section of the
Eurostat website.
In the third quarter of 2014, the business investment rate1 was 21.7% in the euro area2, compared with 21.6 in the
second quarter of 20143. This was the result of an increase in both investment (+1.1%) and gross value added
(+0.7%). Total stocks (materials, supplies and finished goods) fell.
In the EU284 the investment rate was 22.0% in the third quarter of 2014, compared with 21.9% in the previous
quarter.
These data come from a detailed set of seasonally adjusted5 quarterly European sector accounts6 released by
Eurostat, the statistical office of the European Union, and the European Central Bank (ECB).
Investment rate of non-financial corporations (seasonally adjusted)
Euro area
EU28
26%
25%
25%
24%
24%
23%
23%
22%
22%
21%
21%
20%
20%
Q1
Q2
Q3
Q4
Q1
Q2
Q3
Q4
Q1
Q2
Q3
Q4
Q1
Q2
Q3
Q4
Q1
Q2
Q3
Q4
Q1
Q2
Q3
Q4
Q1
Q2
Q3
Q4
Q1
Q2
Q3
Q4
Q1
Q2
Q3
Q4
Q1
Q2
Q3
Q4
Q1
Q2
Q3
Q4
Q1
Q2
Q3
Q4
26%
2003
2004
2005
2006
2007
2008
2009
2010
2011
2012
2013
2014
Business profit stable in the EU28, nearly stable in the euro area
In the EU28 the business profit share7 was 38.4% in the third quarter of 2014, stable compared with the second
quarter of 2014. In the euro area the profit share was 38.7% in the third quarter, compared with 38.8% in the
previous quarter.
Profit share of non-financial corporations (seasonally adjusted)
Euro area
EU28
43%
42%
42%
41%
41%
40%
40%
39%
39%
38%
38%
37%
37%
Q1
Q2
Q3
Q4
Q1
Q2
Q3
Q4
Q1
Q2
Q3
Q4
Q1
Q2
Q3
Q4
Q1
Q2
Q3
Q4
Q1
Q2
Q3
Q4
Q1
Q2
Q3
Q4
Q1
Q2
Q3
Q4
Q1
Q2
Q3
Q4
Q1
Q2
Q3
Q4
Q1
Q2
Q3
Q4
Q1
Q2
Q3
Q4
43%
2003
2004
2005
2006
2007
2008
2009
2010
2011
2012
2013
2014
The profit share was nearly stable in the euro area as compensation of employees (wages and social
contributions) plus taxes less subsidies on production increased at the same pace as value added (+0.7%).
Nominal growth of components of the investment rate and the profit share (euro area)
(seasonally adjusted data, change compared with the previous quarter)
6%
6%
5%
5%
4%
4%
3%
3%
2%
2%
1%
1%
0%
0%
-1%
-1%
-2%
-2%
-3%
Gross value added in current prices
-3%
-4%
Gross fixed capital formation in current prices
-4%
-5%
Compensation of employees and taxes less
subsidies on production in current prices
-5%
-6%
-7%
-7%
-8%
-8%
-9%
-9%
-10%
-10%
Q1
Q2
Q3
Q4
Q1
Q2
Q3
Q4
Q1
Q2
Q3
Q4
Q1
Q2
Q3
Q4
Q1
Q2
Q3
Q4
Q1
Q2
Q3
Q4
Q1
Q2
Q3
Q4
Q1
Q2
Q3
Q4
Q1
Q2
Q3
Q4
Q1
Q2
Q3
Q4
Q1
Q2
Q3
Q4
Q1
Q2
Q3
Q4
-6%
2003
2004
2005
2006
2007
2008
2009
2010
2011
2012
2013
2014
1. The gross investment rate of non-financial corporations is defined as gross fixed capital formation divided by gross value
added. This ratio relates the investment of non-financial businesses in fixed assets (buildings, machinery etc.) to the value
added created during the production process.
2. Until 31 December 2014 the euro area (EA18) consisted of 18 Member States: Belgium, Germany, Estonia, Ireland, Greece,
Spain, France, Italy, Cyprus, Latvia, Luxembourg, Malta, the Netherlands, Austria, Portugal, Slovenia, Slovakia and Finland,
plus the European Central Bank and European Stability Mechanism. From 1 January 2015 the euro area (EA19) also
includes Lithuania.
As part of Eurostat's guidelines for the dissemination of data when the euro area is enlarged, the aggregate data series
commented on in this News Release refer to the official composition in the most recent quarter for which data are available.
Thus News Releases with data for quarters up to the fourth quarter of 2014 comment on EA18 series, while Releases with
data for the first quarter of 2015 onwards will comment on EA19 series. Data for EA19 will be published in July 2015 (first
release of sector accounts for the first quarter of 2015).
Eurostat's guidelines can be found on the Eurostat website:
http://ec.europa.eu/eurostat/en/web/products-eurostat-news/-/GUIDE_ENLARG_2007
3. Compared with News Release 13/2015 of 20 January 2015, the business investment rate remains unchanged whereas
business profit share for the third quarter of 2014 has been revised from 38.8% to 38.7% in the euro area. Compared with
News Release 163/2014 of 27 October 2014 the business investment rate for the second quarter of 2014 remains
unchanged in both the euro area and the EU28. The business profit share has been revised from 38.4% to 38.8% in the
euro area and form 38.2% to 38.4% in the EU28.
4. The European Union (EU28) consists of 28 Member States: Belgium, Bulgaria, the Czech Republic, Denmark, Germany,
Estonia, Ireland, Greece, Spain, France, Croatia, Italy, Cyprus, Latvia, Lithuania, Luxembourg, Hungary, Malta, the
Netherlands, Austria, Poland, Portugal, Romania, Slovenia, Slovakia, Finland, Sweden and the United Kingdom, plus the EU
institutions.
5. Seasonal adjustment has been performed using the Tramo-Seats method. The seasonally adjusted series are built up
indirectly as the sum of seasonally adjusted components.
6. The compilation of the European sector accounts follows the European System of Accounts 2010 (ESA2010) and covers
the period from the first quarter of 1999 to the third quarter of 2014.
Institutional sectors bring together economic units with broadly similar characteristics and behaviour, namely: households
(including non-profit institutions serving households), non-financial corporations, financial corporations, government and the
rest of the world. In the latter to measure the external transactions of the euro area / EU, it is necessary to remove crossborder flows within the area concerned.
The ECB and Eurostat publish integrated non-financial and financial accounts, including financial balance sheets, for the
euro area. Eurostat also publishes the non-financial accounts of the European Union.
Eurostat's website includes detailed annual sector accounts by country and derived key indicators, which also include the
indicators that combine non-financial and financial accounts such as additional profitability indicators.
The full set of quarterly sector accounts is published for euro area / EU aggregates only. However, some of the Member
States' selective data are available in the Eurostat database and a subset of quarterly key indicators is published around 102
days after each quarter at http://ec.europa.eu/eurostat/sectoraccounts (see "Quarterly data") for 15 out of the 18 members of
the European Economic Area (EEA) whose GDP is above 1% of the EU total, subject to availability. The other 13 EEA
members, whose GDP is below 1% of the EU total, do not have to transmit the quarterly accounts of corporations to
Eurostat.
General information on European sector accounts compilation is given in the metadata file available at
http://ec.europa.eu/eurostat/cache/metadata/en/nasq_10_nf_tr_esms.htm
For detailed data and methodology, please see Eurostat's website at: http://ec.europa.eu/eurostat/sectoraccounts and
ECB's website at: http://www.ecb.eu/stats/acc/html/index.en.html.
7. The profit share of non-financial corporations is defined as gross operating surplus divided by gross value added. This
profitability-type indicator shows the share of the value added created during the production process remunerating capital. It
is the complement of the share of wage costs (plus taxes less subsidies on production) in value added.
Issued by: Eurostat Press Office
For further information:
Tim ALLEN
Tel: +352-4301-33 444
[email protected]
Leonidas AKRITIDIS
Filippo GREGORINI
Enrico INFANTE
Eurostat news releases on the internet:
http://ec.europa.eu/eurostat
Tel: +352- 4301- 38582
[email protected]
Selected Principal European Economic Indicators: http://ec.europa.eu/eurostat/euroindicators
Follow Eurostat on Twitter: http://twitter.com/EU_Eurostat
Table 1: Key indicators of the euro area (EA18) and of the European Union (EU28)
2003
2004
2005
2006
2007
2008
2009
2010
2011
2012
2013
2014
Q1
Q2
Q3
Q4
Q1
Q2
Q3
Q4
Q1
Q2
Q3
Q4
Q1
Q2
Q3
Q4
Q1
Q2
Q3
Q4
Q1
Q2
Q3
Q4
Q1
Q2
Q3
Q4
Q1
Q2
Q3
Q4
Q1
Q2
Q3
Q4
Q1
Q2
Q3
Q4
Q1
Q2
Q3
Q4
Q1
Q2
Q3
22.5
23.0
21.7
23.0
22.6
23.3
21.9
22.9
22.8
23.6
22.5
23.7
23.8
23.9
23.0
24.4
24.3
24.6
23.2
24.9
24.3
24.5
23.4
23.5
22.2
21.7
20.8
21.4
20.9
22.1
20.8
21.7
21.9
22.5
21.5
22.4
21.9
22.5
21.2
22.2
21.0
22.1
21.1
22.1
21.3
22.1
21.1
22.6
22.6
22.5
22.7
22.6
22.8
22.7
22.6
22.8
23.1
23.3
23.4
23.8
23.5
23.8
24.1
24.3
24.1
24.0
24.6
24.4
24.0
24.2
23.2
22.4
21.2
21.4
21.1
21.1
21.5
21.4
21.4
22.1
21.9
22.1
22.1
22.1
22.0
21.8
21.8
21.3
21.6
21.7
21.7
21.7
21.6
21.7
42.2
39.7
41.8
37.9
42.7
40.4
42.3
38.5
42.3
40.7
42.6
38.9
43.4
40.7
42.9
39.7
44.3
41.3
43.8
40.4
43.2
41.2
42.9
38.2
40.4
37.8
41.5
38.0
41.5
39.1
42.2
39.1
42.3
38.9
41.9
38.4
41.7
37.9
41.1
37.5
41.5
37.6
41.0
36.9
41.4
36.8
40.4
40.5
40.2
40.5
40.5
40.8
40.8
40.6
40.7
40.6
40.9
41.1
41.4
41.3
41.7
41.8
42.2
42.4
42.4
42.7
42.5
41.8
41.8
41.5
40.2
38.8
39.1
39.7
39.4
39.9
40.3
40.4
40.3
40.5
40.2
40.3
40.1
39.8
39.7
39.8
39.5
39.5
39.5
39.3
39.3
39.1
38.8
38.7
22.4
23.0
21.8
23.2
22.5
23.0
21.8
22.9
22.1
24.8
22.5
23.7
23.5
24.3
23.2
24.5
23.8
24.4
23.6
25.5
23.9
24.9
24.1
24.4
22.1
21.8
21.2
21.8
20.5
21.7
21.1
22.0
21.4
22.4
21.8
22.6
21.6
22.4
21.4
22.4
20.7
22.1
21.6
22.6
21.2
22.3
21.7
22.8
22.7
22.4
22.7
22.8
22.7
22.4
22.4
22.5
24.5
23.1
23.2
23.9
24.0
23.8
24.0
24.2
24.1
24.2
24.9
24.4
24.5
24.6
23.8
22.6
21.4
21.5
21.3
21.1
21.3
21.4
21.5
21.9
21.9
22.1
22.1
22.2
22.0
21.8
21.8
21.4
21.7
21.9
21.9
22.0
21.9
22.0
40.1
38.6
40.5
38.1
40.5
39.4
41.2
38.7
40.1
39.9
41.5
39.2
41.6
40.0
41.9
39.7
41.6
39.9
42.1
40.3
41.1
40.2
41.8
38.5
39.1
37.1
40.5
38.5
39.7
38.6
41.3
39.8
40.6
38.4
41.0
39.2
40.0
37.6
39.9
38.2
39.5
37.2
40.0
38.3
39.1
36.7
39.7
Seasonally
adjusted
Not seasonally
adjusted
Seasonally
adjusted
European Union (EU28)
Investment rate, %
Profit share, %
Not seasonally
adjusted
Seasonally
adjusted
Not seasonally
adjusted
Seasonally
adjusted
Not seasonally
adjusted
Euro area (EA18)
Investment rate, %
Profit share, %
39.4
39.1
39.4
39.5
39.8
39.8
39.8
39.7
39.5
40.1
40.3
40.5
40.6
40.9
41.0
40.9
40.9
40.9
41.3
41.1
40.7
40.8
40.7
39.2
38.4
38.4
39.1
38.8
39.1
39.7
40.0
39.9
39.8
39.7
39.8
39.7
39.2
39.2
39.0
38.8
39.0
38.8
38.7
38.8
38.5
38.4
38.4
Table 2: Gross operating surplus, its components, changes in inventories and gross fixed capital
formation of non-financial corporations, in the euro area (EA18)
(Seasonally adjusted)
2010
2011
2012
2013
2014
224696
225513
227318
231184
233363
237454
236721
238137
242312
249203
254281
258519
264807
266768
274450
282484
290833
292930
295529
304941
306278
302555
304465
285280
265117
250566
254263
252219
253819
262940
264267
265504
278333
277300
280979
282240
282261
280666
279297
278647
271617
277952
279126
281326
281810
281136
284366
9029
3283
-1912
2162
-4198
2976
6320
13638
-2553
8715
1089
15015
14734
9721
12775
4279
22868
17173
15480
13767
12189
9041
19044
10310
-14525
-25044
-13114
-9745
-2278
8828
7169
8951
22472
20394
13571
1452
3021
542
-8152
-3456
-6322
-5759
-1252
-5785
-4694
-9362
-8852
0.0
0.3
1.3
0.7
1.4
0.8
0.3
1.0
0.7
1.5
1.1
1.3
1.0
1.8
1.5
1.9
2.1
1.4
1.4
0.9
1.3
0.3
0.0
-2.6
-3.5
-0.4
0.7
0.4
0.7
1.5
0.9
0.7
1.5
0.4
0.6
0.3
0.0
0.0
0.2
-0.2
-0.1
0.8
0.3
0.4
0.4
0.1
0.7
0.4
0.8
0.8
0.7
0.7
0.9
0.6
0.9
0.8
1.1
0.8
0.6
1.2
1.0
1.3
1.3
1.8
1.2
0.9
1.2
2.6
0.2
0.6
-0.4
-1.2
-1.0
-0.2
0.8
0.0
0.8
0.7
0.8
1.3
0.8
0.4
0.6
0.6
0.2
0.1
0.3
-0.1
0.7
0.6
0.5
0.7
0.6
0.7
0.4
0.8
0.8
0.6
0.7
0.8
0.5
0.8
0.7
1.0
0.8
1.0
1.3
1.1
1.3
1.3
1.7
1.1
0.9
1.2
2.7
0.3
0.6
-0.5
-1.1
-0.8
0.0
0.2
0.7
0.8
0.6
0.8
1.1
0.8
0.3
0.6
0.4
0.3
0.1
0.2
-0.2
0.5
0.5
0.5
0.8
0.7
0.7
-0.5
-0.4
1.9
0.6
2.3
0.6
-0.1
1.2
0.5
2.2
1.6
2.2
0.6
2.9
1.7
2.8
2.6
1.5
2.0
0.4
-0.6
0.4
-0.8
-5.5
-6.9
0.6
2.1
-0.2
1.9
2.4
1.2
0.4
1.8
-0.1
0.9
-0.2
-0.8
-0.2
0.3
-1.0
-0.1
0.9
-0.2
0.2
-0.1
-0.7
0.6
Gross fixed capital
formation
403784
402173
409689
411980
421537
424081
423469
428569
430834
440291
447302
457215
460007
473183
481338
494658
507587
515338
525550
527821
524816
526885
522617
493741
459714
462332
472031
471319
480437
492164
498292
500355
509115
508426
512978
512106
508116
507081
508728
503560
502837
507593
506759
507819
507384
503733
506915
Gross operating surplus
8559
8376
8776
9289
9252
9672
10163
10847
11512
12310
12495
10097
9747
9510
9788
9880
10332
11118
10975
10759
10694
10346
10277
10317
9745
8608
7424
11724
6497
6917
7732
7777
8625
9275
9943
10256
11673
10817
10754
10874
11491
13263
13763
13947
13041
12828
12928
Of which
Compensation
of employees
583910
588713
593326
597124
601468
606487
609800
614739
618895
624799
629671
636232
644346
651427
659815
668327
679987
687703
694026
702528
721455
723559
727811
724466
716481
710462
710317
711750
716772
722267
726401
732455
740876
746520
749111
753572
756524
759005
759640
761502
760134
764146
768302
771881
778202
783270
788469
Total
2009
996253
999262
1011791
1018393
1032257
1040240
1043433
1054155
1061240
1077400
1089467
1103544
1114101
1134120
1150941
1172864
1197905
1214159
1230551
1241109
1256966
1260789
1260705
1228523
1185939
1181403
1189772
1194793
1203707
1221347
1232425
1240587
1258616
1264221
1272032
1275935
1276313
1276903
1279122
1275936
1274462
1285003
1288824
1293647
1298627
1299831
1308312
% change compared with the previous
quarter
Compensation
of employees
and other taxes
less subsidies
on production
Gross value added
2008
Changes in inventories &
net acquisitions of
valuables
2007
Gross fixed capital
formation
2006
Gross operating surplus
2005
Other taxes less subsidies
on production
2004
Compensation of
employees (paid)
2003
Q1
Q2
Q3
Q4
Q1
Q2
Q3
Q4
Q1
Q2
Q3
Q4
Q1
Q2
Q3
Q4
Q1
Q2
Q3
Q4
Q1
Q2
Q3
Q4
Q1
Q2
Q3
Q4
Q1
Q2
Q3
Q4
Q1
Q2
Q3
Q4
Q1
Q2
Q3
Q4
Q1
Q2
Q3
Q4
Q1
Q2
Q3
Gross value added
Millions of euro at current prices
-0.5
0.4
0.8
1.7
0.9
1.8
-0.3
0.6
1.8
2.8
2.0
1.7
2.4
0.7
2.9
2.9
3.0
0.7
0.9
3.2
0.4
-1.2
0.6
-6.3
-7.1
-5.5
1.5
-0.8
0.6
3.6
0.5
0.5
4.8
-0.4
1.3
0.4
0.0
-0.6
-0.5
-0.2
-2.5
2.3
0.4
0.8
0.2
-0.2
1.1


© Copyright 2026