
Low velocity impact modeling in composite laminates
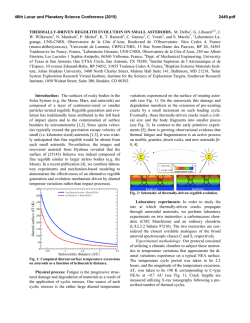
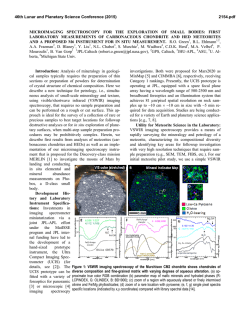
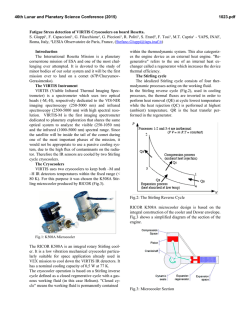
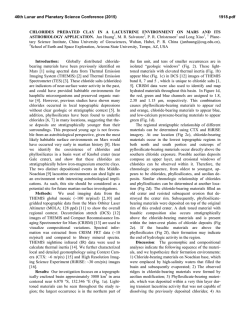
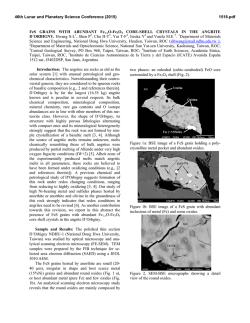
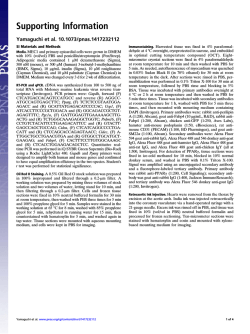
Open Archive Toulouse Archive Ouverte (OATAO)
OATAO is an open access repository that collects the work of Toulouse researchers and
makes it freely available over the web where possible.
This is an author-deposited version published in: http://oatao.univ-toulouse.fr/
Eprints ID: 6769
To link to this article: DOI:10.1016/j.composcitech.2012.08.019
URL: http://dx.doi.org/10.1016/ j.composcitech.2012.08.019
To cite this version: Bouvet, Christophe and Rivallant, Samuel and
Barrau, Jean-Jacques Low velocity impact modeling in composite
laminates capturing permanent indentation. (2012) Composites Science
and Technology, vol. 72 (n° 16). pp. 1977-1988. ISSN 0266-3538
Any correspondence concerning this service should be sent to the repository
administrator: [email protected]
Low velocity impact modeling in composite laminates capturing
permanent indentation
C. Bouvet ⇑, S. Rivallant, J.J. Barrau
Université de Toulouse; INSA, UPS, Mines Albi, ISAE; ICA (Institut Clément Ader); ISAE, 10 Avenue Edouard Belin, 31055 Toulouse Cedex 4, France
a r t i c l e
i n f o
Keywords:
B. Impact behavior
C. Damage tolerance
B. Delamination
a b s t r a c t
This paper deals with impact damage and permanent indentation modeling. A numerical model has been
elaborated in order to simulate the different impact damage types developing during low velocity/low
energy impact. The three current damage types: matrix cracking, fiber failure and delamination, are simulated. Inter-laminar damage, i.e. interface delamination, is conventionally simulated using interface elements based on fracture mechanics. Intra-laminar damage, i.e. matrix cracks, is simulated using interface
elements based on failure criterion. Fiber failure is simulated using degradation in the volume elements.
The originality of this model is to simulate permanent indentation after impact with a ‘‘plastic-like’’
model introduced in the matrix cracking elements. This model type is based on experimental observations showing matrix cracking debris which block crack closure. Lastly, experimental validation is performed, which demonstrates the model’s satisfactory relevance in simulating impact damage. This
acceptable match between experiment and modeling confirms the interest of the novel approach proposed in this paper to describe the physics behind permanent indentation.
1. Introduction
Low velocity impact is one of the most critical load factors for
composite laminates. Indeed, for structures submitted to low energy impacts or small dropped objects, such as tools during assembly or maintenance operations, composite laminates reveal a
brittle behavior and can undergo significant damage in terms of
matrix cracks, fiber breakage or delamination. This damage is particularly dangerous because it drastically reduces the residual
mechanical characteristics of the structure, and at the same time
can leave very limited visible marks on the impacted surface [1].
Consequently, it is essential to define a damage tolerance demonstration to design this type of structure in order to take possible
damage into account. The damage tolerance concept [2] was introduced in the seventies for civil aircraft structures and these
requirements are expressed by European certification JAR 25.571:
‘‘The damage tolerance evaluation of the structure is intended to
ensure that should serious fatigue, corrosion or accidental damage
occur within the operational life of the airplane, the remaining
structure can withstand reasonable loads without failure or excessive structural deformation until the damage is detected’’. In the
field of aeronautics, damage tolerance, for damage corresponding
to impact loading, leads to dimensioning the structure according
to impact detectability: if the damage is not visibly detectable,
⇑ Corresponding author.
E-mail address: [email protected] (C. Bouvet).
i.e. when the impact indentation depth is less than a given value,
called barely visible impact damage (BVID), the structure must
support extreme loads and if the damage is detectable, i.e. when
the impact indentation depth is greater than BVID, another criterion must be considered, such as repair or replacement of the
structure [2,3].
The BVID is defined as the minimum damage that can be detected by visual evaluation [2]. In the field of aeronautics, it has
been demonstrated that a permanent indentation between 0.25
and 0.5 mm is detectable during detailed visual inspection with a
probability greater than 99% [4].
Consequently, the development of numerical tools is essential
to the aerospace industry to optimize composite structures
according to the damage tolerance concept. Thus, the challenge is
to simulate, with the same model, damage during impact and in
particular permanent indentation, and the residual mechanical
characteristics after impact, in order to be able to numerically
optimize design of composite structures with impact damage
tolerance. Many authors have studied the impact behavior of
composite structures and its effect on residual strength, both
experimentally (e.g. [1,5–7]), as well as numerically (e.g. [8–11]),
and although some authors have worked on the permanent indentation phenomenon (e.g. [6,12–15]), considerable work is still
necessary to understand the physics of this phenomenon and to
correctly model it. Currently, this residual deformation after
impact is explained, for thermoset resin such as epoxy, with ‘‘plasticity’’. Indeed, this type of resin presents important permanent
deformation after testing, particularly under shear stress [16], similar to plasticity deformation. Consequently, some authors simulate this permanent indentation using plasticity modeling of the
matrix (e.g. [17–19]). For example, Shi et al. [15] simulate damage
development in a simple cross ply [0, 90]2S in composite laminate
subjected to low velocity impact and in particular permanent
deformation after impact. A stress-based failure criterion was used
to predict damage initiation while damage propagation in the form
of intra- and inter-laminar cracking was simulated by energy based
criteria. The permanent indentation is formed due to the modeling
of the nonlinear shear behavior of the polymer matrix developed
by Berbinau [20] (Fig. 1).
Another approach consists of using conventional Hertz contact
modeling. For example, Karakuzu et al. [21] perform an experimental and numerical study of a glass/epoxy composite plate and
empirically simulate the permanent indentation a0 as:
a0 ¼ am ð1 ðacr =am Þn Þ
ð1Þ
where am is the maximum indentation, acr is a material parameter,
corresponding to a critical indentation and n is a material parameter. This approach accurately reproduces the permanent indentation value, but does not make it possible to totally simulate the
plate deformation after impact on the impacted and non-impacted
sides. Another empirical approach is used by Caprino et al. [14]. In
this study of indentation and penetration of carbon fiber reinforced
plastic laminates, they predict the indentation as an empirical function of impact energy level. In practical terms, they show that a single indentation law function of impact energy level and penetration
energy, holds for many laminates with different fiber architectures,
laminate types, matrix types and constraint conditions. The drawback of this type of modeling is its inability to totally reproduce
plate deformation because this model is totally linked to a test type,
such as impact.
Recently, Gonzalez et al. [22] also proposed a model able to simulate impact and compression after impact (CAI) tests. This model
uses constitutive material models formulated within the context
of continuum damage mechanics and accounts for both ply failure
mechanics and delamination. The comparisons with experimental
data seem accurate, both for impact test, as well as for CAI, although
insufficient knowledge of the real CAI damage obtained experimentally makes difficult these comparisons. However, permanent
indentation is not taken into account. But this work is in progress
Fig. 1. Permanent indentation predicted by the numerical model of Shi et al. [15]:
impacted side (a) and through the thickness (b).
and the authors argue that using the coupled plasticity and damage
model for in-plane and out-of-plane loading conditions of Donadon
et al. [23] will make it possible to capture the permanent dent
depth. The modeling developed by Faggiani and Falzon [17] is also
able to simulate impact and CAI tests on a real structure. Faggiani
and Falzon simulate impact damage and residual strength of a stiffened composite panel under compression. To do this, an intralaminar damage model, based on continuum damage mechanics,
is coupled with interface elements, based on the critical energy release rate. The permanent indentation after impact of the panel is
simulated using nonlinear shear formulation of the intra-laminar
damage model. Faggiani and Falzon observe that this deformation
should be significant in predicting the CAI response of the panel.
The numerical correlation on time-force history, on damage shape
and on residual strength correlates satisfactorily. Nevertheless,
insufficient knowledge of the real impact damage obtained experimentally makes it difficult to evaluate the reliability of this model.
In particular, the ultrasonic investigations (C-Scan) given in this
study are not experimentally reproducible to determine the delaminated interface shapes and other experimental examinations,
such as micrographic cuts or subsequent image inter-correlation
during CAI tests, are needed to evaluate the reliability of the model.
However, this conclusion is generally valid for many models in the
literature and experimental investigations of impact tests are often
insufficient to evaluate the domain of their validity.
This conclusion is also valid for the physical phenomenon
responsible for permanent indentation. Although resin plasticity
is conventionally admitted as an explanation for this residual
deformation, other phenomena may play a role. For example,
Chen et al. [13] studied failure mechanisms of laminated composites subjected to static indentation and showed an apparent coupling between permanent indentation and fiber failure. In
practical terms, the transition of rapid increase in dent depth is
due to fiber failure produced at the impact force plateau. This
coupling is not easy to explain using only resin plasticity, and
other failure phenomena should create permanent indentation.
In a previous study [24], we suggested that another phenomenon
responsible for permanent deformation seems to be impact debris
in 45° cracks through the ply thickness (Fig. 2a). Indeed, in these
photographs, taken after a 25 J impact test on a composite laminate with unidirectional (UD) reinforcement (cf. Section 3), debris
in the 45° matrix cracks seem to block their closure and to hold
the adjacent delaminations open. This phenomenon is schematically presented in Fig. 2b and could explain part of the permanent
indentation phenomenon. Nevertheless, it cannot fully explain
permanent indentation and other phenomena, such as plasticity
or compaction of the resin (due to initial porosity) or friction of
delaminated interfaces, matrix cracks or fiber/resin debonding,
may play a role.
Lastly, the goal and the originality of this study is to propose a
numerical model which is able to represent permanent indentation
taking into account this phenomenon of debris blocking the matrix
cracks closure. The model presented consists of an evolution based
on a previous version [24,25] with integration of permanent indentation and modification of the fiber failure criterion.
The first section (Section 2) presents the basic approach for
modeling the three most common damage types developed during
impact: matrix cracking, delamination and fiber failures. Permanent indentation is simulated using an original ‘‘plastic-like’’ model introduced in the matrix cracking interfaces.
Section 3 deals with experimental validation. An impact reference case has been chosen to evaluate the accuracy of the proposed
model. Then, this model is used to highlight some experimental results, such as the formation of delamination of the first interface on
the non-impacted side, or the residual shape of the plate on impacted and non-impacted sides.
90° cut
impactor
Matrix cracks
25 J impact
Fibres failure
impactor
Delaminations
2 mm
0° cut
debris
Open blocked delaminations
(a)
impactor
0°
90°
0°
debris
Open blocked delaminations
(b)
Fig. 2. Micrographic cuts after 25 J impact (a) and the principle of creation of permanent indentation (b).
(a)
Longitudinal cracking
Loading direction
Matrix
cracking
(c)
Matrix
cracking
Delamination
Delamination initiation
Delamination
initiation
Transverse cracking
(b)
Fibers failure
Delamination propagation
(a) Cracking + saturation of lower ply
=> delamination
100 μm
Delamination propagation
(b) Bending cracking => delamination
of the ply non-impacted side
100 μm
Fig. 3. Impact damage in laminate with UD reinforcement: (a) different damage types [7], (b) damage photographs [5], and (c) diagram of the principle of interaction between
intra- and inter-laminar damage [11].
2. Modeling principle
A low velocity/low energy impact on a composite laminate with
UD reinforcement induces three types of damage: matrix cracks,
fiber failure and delamination (Fig. 3) [5,7,11].
Conventionally, the first damage to appear is matrix cracking.
When this damage increases, delamination quickly occurs. Interaction between these two damage phenomena is clearly visible
during impact tests. This interaction is crucial to explain the very
original morphology of the delaminated interfaces through the
Fibres
direction
Model
E1
I1
E2
z
l
Interface I1 : driven by
criteria in volumic
elements E 1, E2
Matrix Cracks
Planes
t
Model
Disjointed
Strips
Broken
Interfaces
Safe
Interfaces
Fig. 4. Model of the ply with longitudinal strips.
thickness of the plate. Chang and Chang illustrate this interaction
[11] in Fig. 3c which schematically shows the two types of delamination formation:
The delamination induced by inner shear cracks which
generates a substantial delamination along the bottom
interface and a small confined delamination along the
upper interface of the cracked plies.
The delamination induced by a surface bending crack,
which generates a delamination along the first interface
of the cracked ply.
Consequently, the key point for an impact model is the interaction between intra-laminar damage, namely matrix cracks and fiber failure, and inter-laminar damage, namely delamination.
Some models in the literature (e.g. [8–10,17,26]) take this interaction into account using explicit relations between the damage variables of matrix cracking in the ply and the damage variables of
delamination between plies. Another way to model this interaction
is to allow for the discontinuity created by matrix cracks, in order
to naturally account for this interaction [8,27]. Indeed, this discontinuity seems essential for the formation of the impact damage
[28] and should be modeled to correctly simulate this damage
morphology. Consequently, the plies mesh must respect the material orthotropy in order to account for the discontinuity aspect of
the matrix cracks in the fiber direction. Then, in the proposed model, each ply is meshed separately using little longitudinal strips
with one volume element in the ply thickness (Fig. 4).
2.1. Matrix cracking modeling
Afterwards, these little strips are connected together with zerothickness interface elements normal to the transverse direction.
These interface elements can account for matrix cracks in the
thickness of the ply. Nevertheless, this type of mesh presents some
drawbacks:
This mesh is complicated by uniform size in the impact
zone. Nevertheless, it is possible to simulate an impact
on a real structure using a multi-scale approach: the
model described above for the area concerned with
impact damage, and a conventional FE model for the
remaining structure [29].
This mesh can only simulate cracks occurring through the
entire thickness of the ply and is not able to simulate
small, diffusive matrix cracks. This means the propagation
of matrix cracks within the ply thickness is assumed to be
instantaneous. Thus, if the ply thickness is not too great,
the propagation of a matrix crack in the thickness takes
place very quickly and its effect on the creation of the
impact damage should remain local.
This mesh can only simulate cracks normal to interfaces.
However, matrix cracks due to out-of-plane shear stress
(stz), are globally inclined at 45°. This hypothesis avoids
the use of an overly complex mesh, and seems reasonable
if the ply thickness is small compared to the laminate
thickness.
The mesh size imposes the maximum density of matrix
cracks in the transverse direction of the ply. This drawback could seem very significant but the presence of
one matrix crack, i.e. of a broken interface, should unload
the neighboring interfaces in the transverse direction and
prevent their breaking. Indeed, the matrix cracks, taken
into account in this model, are only the largest ones, i.e.
those running through the entire ply thickness, and not
the little, diffuse matrix cracks. This means that the model
does not take into account the network of little matrix
cracks because the effect of these diffuse matrix cracks
seems small compared to those running through the
entire thickness.
Another consequence of this imposed maximum density of matrix cracks is the choice of the failure criterion and energy dissipated by this phenomenon. It would be interesting to use
fracture mechanics, in addition to interface elements, to simulate
the critical energy release rate [30]. But the mesh density is imposed a priori and induces the maximum energy possible to dissipate, unless the mesh is fine enough to simulate each crack. As it is
not possible to simulate each matrix crack (Fig. 2a), the proposed
model has been chosen without energy dissipation.
Then the model ignores the energy dissipated by matrix cracking, even if a part of this energy should be included in the energy
dissipated by delamination. Indeed, the DCB (Double Cantilever
Beam) test, which is used to evaluate the critical energy release rate
for delamination, is a overall test. In practical terms, the energy dissipated during the test which is experimentally evaluated, is the
sum of all damage types [31,32]. In particular, the energy dissipated
by the matrix cracks, accompanying the delamination, is taken into
account. Nevertheless, the consequences of this non-dissipative
model should be evaluated with other experimental tests. Another
solution would be to use cohesive crack modeling to allow multiple
matrix cracks per element, as proposed by Raimondo et al. [33].
In the proposed case, the interface degradation is abrupt: if the
material is safe, the stiffness of these matrix cracking interfaces is
considered to be very high (typically 106 MPa/mm) and this
stiffness is set to zero if matrix cracks exist. Of course, this abrupt
σt
σtf
τtz
τ tzf
v
kt0
εt =
u
w
w
u
v
k tz0
w
γ tz =
εt
εt0
w
u
max(γtz(τ))
ktz
τ<t
w
γtz
γtz0
max(εt(τ))
kt
v
w
τ<t
Blue line : loading
Red line : unloading
Blue line : loading
Red line : unloading
(a)
(b)
Fig. 5. Permanent indentation model under tension (a) and shear (b).
degradation can induce shock issue during numerical simulation
and additional damping should be added [22]. The energy dissipated by this viscosity damping should remain low [34], typically
less than 2% of the total energy.
The failure is driven by a standard criterion similar to Hashin’s
criterion [35,36], calculated in the neighboring volume elements:
hrt iþ
!2
f
t
r
s2 þ s2tz
þ lt
sflt
2 6 1
ð2Þ
where rt is the transverse stress, slt and stz the shear stresses in the
(lt) and (tz) planes, < >+ the positive value, rft the transverse failure
stress and sflt the shear failure stress of the ply. This conventional
quadratic criterion [35,36] is written with stresses at each Gauss
point of the two neighboring volume elements and the interface
is broken when the criterion is reached at one of these points (for
more details, see [24]). This is an original point of the proposed
model and can be considered to be an average stress over a distance
which depends on the mesh size. This mesh sensitivity will have to
be studied further; this work is currently in progress.
Hereafter, these matrix cracking interface elements are used to
simulate permanent indentation. Indeed, part of the permanent
indentation seems to be impact debris in 45° cracks through the
ply thickness (Fig. 2) [12]. This phenomenon has been taken into
account in the present model using an original ‘‘plastic-like’’ model
behavior in the matrix cracking elements in order to limit their closure after failure under tension (rt) and out-of-plane shear (stz)
(Fig. 5). The formulation of the law after crack initiation is given
below:
8
>
0
>
>
) rt ¼ 0
e
P
min
max
ð
e
ð
s
ÞÞ;
e
t
t
<
t
s6t
>
>
>
ðet ðsÞÞ; e0t ) rt ¼ kt et minðmaxðet ðsÞÞ; e0t Þ
: et < min max
s6t
s6t
8
>
>
>
ðctz ðsÞÞ; c0tz ) stz ¼ 0
< ctz P min max
s6t
>
>
> ctz < min maxðctz ðsÞÞ; c0tz ) stz ¼ ktz ctz min maxðctz ðsÞÞ; c0tz
:
s6t
s6t
ð3Þ
where kt and ktz are the stiffness values of debris, et and ctz are the
dimensionless displacements of the interface displacements, and 0t
and c0tz the dimensionless sizes (Fig. 5) of these debris respectively
in the normal direction and in shear:
(
et ¼ wu
ctz ¼ wv
(
e0t ¼ uw0
c0tz ¼ vw0
ð4Þ
where w is the width of the element and u0 and v0 are the sizes of
the debris respectively in the normal and transverse direction
(Fig. 5).
Then, when a matrix crack exists, its closure is prevented if its
dimensionless displacement et (ctz) is below a critical size 0t (c0tz )
corresponding to the debris size. This critical debris size can be
compared to the critical indentation acr (Eq. (1)) proposed by
Karakuzu et al. [21].
If the crack is assumed to be 45° in the (tz) plane these two
stiffness values and debris sizes are equivalent and are assumed
to be equal:
kt ¼ ktz
e0t ¼ c0tz
ð5Þ
Consequently, only two material parameters are necessary to
take into account the phenomenon of permanent indentation.
These two parameters are difficult to correlate with material
parameters measured in conventional tests and are directly
determined using the impact test. Therefore, this evaluation process limits the predictive character of this model, and in particular for the part linked to permanent indentation. Other works
are in progress to evaluate these parameters using simpler
experimental studies. It can be observed that these two parameters are the only ones in this model which are directly determined during the impact test: all other values are obtained
from conventional experimental tests described in the literature
[31,32,37,38,41].
This no-closure model integrated into the interface elements of
matrix cracking makes it possible to obtain a realistic deformed
shape of the plate, not only during impact but also after impact,
as well as a permanent indentation (Fig. 14).
2.2. Fiber failure modeling
For the fiber failures observed after impact (Fig. 2), there is no
evidence of distributed fiber damage. Moreover, due to the high
critical energy release rate of fiber failure [38], it is necessary to
dissipate this energy in the model. Additional interface elements
could be used but would result in very complex meshing. Therefore, to avoid the use of such interfaces, fiber failure is taken into
account using conventional continuum damage mechanics with
original formulation to produce a constant energy release rate
per unit area. This approach can be compared to methods based
on characteristic element length, which makes mesh-size independent modeling possible [15,35,39,40].
Therefore, in order to simulate the critical energy release rate
due to fiber failure per unit area of crack, the dissipated energy
of a volume element should be:
Stress σ l
Fiber failure
Volume : V
Section : S
ε
ε1
Strain ε l
0
(a)
(b)
Fig. 6. Principle of fiber failure (a) and behavior law in the longitudinal direction (b).
Disjointed
Strips
Model
Delamination
Fig. 7. Principle of the interface model between plies.
σi
for i = I, II, III
σi0
GIII
GIIIc
GIIc
di0
di
GII
GI GIc
(a)
(b)
Fig. 8. Evolution of the stress–relative displacement jump curves (a) and linear
mixed mode of fracture (b).
Z
V
Z
!
e1
rl del
0
dV ¼ S GfI
ð6Þ
where el (rl) is the longitudinal stress (strain), V (S) the volume (section) of the element, e1 is the strain of total degradation of the fiber
stiffness (Fig. 6) and GfI the energy release rate in opening mode in
the direction of the fibers. In this case, the law is written only in
opening mode I (Fig. 6), but could be generalized with other fracture
modes.
Afterwards, the stiffness in fibers is degraded using a damage
variable df:
rl ¼ ð1 df Þ ðHll el þ Hlt et þ Hlz ez Þ
ð7Þ
where Hll, Hlt and Hlz are the stiffness values in the longitudinal
direction. And this damage variable is conventionally calculated
according to the longitudinal strain in order to obtain a linear decrease of the longitudinal stress (Fig. 6) [15]:
e1 ðel e0 Þ
df ¼
el ðe1 e0 Þ
An originality of this fiber failure approach is to initiate the
damage when the maximum of the longitudinal strains calculated
at the element nodes reaches the fiber failure strain fl . The use of
extrapolated strains at element nodes, rather than direct strain values at integration points, makes it easier to take into account the
bending behavior of each ply with only one finite volume element
in the thickness. Nevertheless, this condition prevents the use of
reduced integration elements and involves the use of eight Gauss
points elements. Then, the e0 parameter is common to the eight
Gauss points of each element and is evaluated using the longitudinal strains calculated at the element nodes. The e1 and df parameters are also chosen common to the eight Gauss points in order to
solve the Eq. (6) only one time for each element.
2.3. Delamination modeling
After the different plies are meshed with volume elements and
matrix crack interface elements (Fig. 4), two consecutive plies are
joined using zero-thickness interface elements (Fig. 7).
These delamination interface elements are conventionally
softening interfaces [30,42] of zero thickness, driven by fracture
mechanics. They are written in mixed fracture mode (modes I, II,
III) to simulate the energy dissipated by delamination. Moreover,
the shearing (II) and tearing (III) fracture modes are combined
and in the following, the term of mode II will be abusively used
to name fracture modes II and III. Then, an equivalent relative
displacement jump is written in order to simulate a linear coupling
law between the fracture modes:
vffiffiffiffiffiffiffiffiffiffiffiffiffiffiffiffiffiffiffiffiffiffiffiffiffiffiffiffiffiffiffiffiffiffiffiffiffiffiffiffiffiffiffiffiffiffiffiffiffiffiffiffiffiffiffiffiffiffiffiffiffiffiffiffiffiffiffiffiffiffiffiffiffiffiffiffi
!2
!2
u
0
0
u
2
dI
dI
deq ¼ t hdI iþ þ
d
þ
d
II
III
0
0
dII
dIII
ð9Þ
ð8Þ
where e1 is calculated using Eq. (6) and e0 is the strain of damage
initiation.
where dI, dII and dIII are the relative displacement jumps
0
0
0
respectively in the z, l and t directions, dI , dII and dIII are the critical
relative displacement jumps respectively in the z, l and t directions
Table 1
Material parameters.
Etl (GPa)
Ecl (GPa)
Et (GPa)
mlt
Glt (GPa)
rft (MPa)
sflt (MPa)
130
100
10
0.29
4.8
50
90
GdI
GdII
GfI
0t
kt (MPa/mm)
0.02
10000
0
kI
f
l
(MPa/mm)
6
0.016
10
(N/mm)
0.5
(N/mm)
1.6
133
Model
Experiment
Model
Experiment
Force (kN)
Force (kN)
(N/mm)
Displacement (mm)
Time (s)
(b)
(a)
Fig. 9. Curves of force versus time (a) and displacement (b) obtained experimentally and numerically.
90°
Experiment : 25 J
90°
Model : 25 J
45°
50 mm
50 mm
0°
0°
-45°
-45°
1: 0/45
6 : 45/0
1 : 0/45
2 : 45/90
5 : 90/45
Impacted side
4 : -45/90
3 : 90/-45
Experiment : 25 J
90°
50 mm
45°
6 : 45/0
5 : 90/45
4 : -45/90
Impacted side
2: 45/90
3: 90 /-45
Model : 25 J
45°
90°
50 mm
0°
45°
0°
-45°
-45°
1 : 0/45
1 : 0/45
2 : 45/90
2 : 45/90
4 : -45/90 Non impacted side
3 : 90/-45
4 : -45/90
3 : 90/-45
Non Impacted side
(b)
(a)
Fig. 10. Comparison between delaminated interfaces obtained experimentally (a) and numerically (b) after a 25-J impact test.
calculated according to failure stresses (Fig. 8) (for more details, see
[25]):
0
dI ¼
r0I
0
kI
0
0
0
dII ¼
0
r0II
0
kII
0
dIII ¼
r0III
0
kIII
respectively in the z, l and t directions. And the two shear directions
are assumed to be equivalent:
0
ð10Þ
where kI , kII and kIII are the stiffness values respectively in the z, l
and t directions and r0I , r0II and r0III are the critical stresses
0
dIII ¼ dII
0
0
kIII ¼ kII
r0III ¼ r0II
ð11Þ
To avoid introducing additional material parameters, the critical
stresses are assumed to be equal to the failure stresses of the ply:
r0I ¼ rft
r0II ¼ r0III ¼ sflt
ð12Þ
90°
Model : 17 J
90°
Experiment : 17 J
45°
50 mm
50 mm
45°
0°
0°
-45°
-45°
1 : 0/45
1 : 0/45
2 : 45/90
4 : -45/90
2 : 45/90
Non impacted side
3 : 90/-45
4 : -45/90
3 : 90/-45
(a)
Non Impacted side
(b)
Fig. 11. Comparison between delaminated interfaces obtained experimentally (a) and numerically (b) after a 17-J impact test.
Impacted side
90°
Impacted side
90°
6 : 45/0
0°
T700/M21
Impact at 25 J
[02, 452 , 902, -452]S
5 : 90/45
0°
delaminated area
4 : -45/90
0°
1
90°
0
45°
0°
3 : 90/-45
-45°
0°
50 mm
2 : 45/90
0°
1 : 0/45
0°
Non impacted side
Non impacted side
(a)
(b)
Fig. 12. Dimensionless energy release rates in mode I, GI/GdI (a), and II, GII/GdII (b) for each interface.
Then, a decreasing exponential law is chosen:
8
>
>
>
>
>
>
>
<
rI
0
¼ r0I exp b deq dI
0
exp b deq dII
rII ¼ r
>
>
>
>
>
>
>
: rIII ¼ r0III exp b deq d0III
0
II
b¼
r0I
dI
deq
0
dII dI
deq d0
II
1
GdI
ð13Þ
0
dIII dI
deq d0
III
ð14Þ
d0I
2
And the use of the same b coefficient for modes I, II and III
imposes:
0
kII
¼
0
kIII
ðr0 Þ2 1
1
¼ IId
þ
2 b d0I
GII
!
ð15Þ
0
where the coefficient b is determined to dissipate the energy release
rate GdI in mode I under the stress–strain curve and GdII in mode II
and III (Fig. 8):
The last undetermined coefficient kI (Table 1) is considered to
be very high. It can be observed that a linear mixed mode of fracture is imposed (Fig. 8b) due to the choice of the equivalent relative
displacement jump (Eq. (9)).
0°
90°
0°
90°
0°
impactor
Damaged
central cone
0°
90°
0°
90°
0°
impactor
Mode I delamination initiation
Mode II delamination propagation
maxi out-of-plane shear
(a)
(b)
Fig. 13. Impact damage with creation of a highly damaged central conical shape: delamination initiation in mode I (a) and propagation in mode II (b).
This model adopted for delamination is often used in the
literature [8,28] although this expression (Eq. (9)) is original. The
definition of this equivalent relative displacement jump enables
us to automatically compare all the possible mode ratios and
how much energy should still be available to dissipate until total
failure occurs. Indeed, during complex loading, with large variation
in the mode ratio, it is not very easy to evaluate this remaining
energy to be dissipated using conventional formulation [30,41].
3. Experimental validations
The proposed model is used to simulate an experimental impact
test on a 100 150 mm2 laminate plate manufactured with T700/
M21 carbon/epoxy composite with UD reinforcement. This plate,
with stacking sequence [02, 452, 902, 452]S is simply supported
by a 75 125 mm2 window (AITM 00–10) and impacted at 25 J
with a 16 mm diameter 2 kg impactor. Only half of the plate is
meshed due to symmetry considerations, the boundary conditions
are imposed to represent the contact with a fixed rigid body and
the impactor is assumed to be non-deformable. The mechanical
characteristics of this material and the material parameters used
in this model are summarized in Table 1.
In this table (Table 1), Etl (Ecl ) is the tension (compression)
Young’s modulus in the fiber direction, Et is the Young’s modulus
in transverse direction, mlt is the Poisson’s ratio, Glt is the shear
modulus. As mentioned above (Section 2.1), it can be observed that
the 0t and kt are the only two parameters directly determined
using the impact test: all other values come from conventional
experimental tests presented in the literature [31,32,37,38,41].
The model is simulated using ABAQUS/ExplicitÒ v6.9 with user
subroutine Vumat. The total calculation time of this model is
approximately 6 h with eight CPUs without optimization of the
modeling to decrease this time.
The comparisons between experimental and numerical curves
of impact force versus time and impactor displacement are illustrated in Fig. 9. A good correlation is obtained between the experiment and model, demonstrating that the real impact damage is
well accounted for in the numerical simulation.
In Fig. 10, delaminated interfaces obtained by calculation are
compared to the experimentally obtained results on the impacted
and non-impacted sides. The accurate correlation between experimental and numerical results tends to confirm the relevance of the
model, and in particular the model of interaction between inter
and intra-laminar damage. As mentioned above (Section 2), the
shape of the delaminations is closely linked to the interaction between matrix cracks and delamination. In particular, the orientation of delamination with the fibers of the lower ply or the
characteristic shape of the first interface of the non-impacted side
is accurately simulated. Moreover, this first delamination shape
seems to be nearly separated into two parts, just as in the experimental results, although in the C-scan, the extensive matrix cracking of the first ply of the non-impacted side makes this observation
difficult. To confirm this result, which is coherent with the literature [1,9], a comparison was performed between the delamination
and the C-scan examination performed on the non-impacted side
of a 17-J impact (Fig. 11). This delamination shape can be explained
by the creation of a central conical shape at the beginning of the
impact test below the impactor, with high matrix cracking due to
out-of-plane stresses (stz and slz). The delamination tends to occur
on the boundaries of this cone and is not created just below the
impactor.
This phenomenon can be highlighted by the illustration of the
dimensionless energy release rates in mode I, GI/GdI and II, GII/GdII
at the end of the impact for each delaminated interface (Fig. 12).
In this figure, blue1 (resp. red) color corresponds to dimensionless
energy release rate equals 0 (resp. 1) and the orange line to the
mark of the delaminated area. It can be observed in this figure that
mode II generally predominates compared to mode I, except in a
central zone around the impactor point. This zone can be assimilated to a conical central zone with its axis in the impact direction
and with its higher diameter on the non-impacted side. It can be
concluded that at the beginning of the impact test, the direct contact of the impactor with the laminate induces a conical shape with
high matrix cracking due to out-of-plane stresses (stz and slz).
These matrix cracks tend to isolate a central cone which induces
the beginning of delamination with a high rate of mode I
(Fig. 13a). This scenario is coherent with the literature [1,9], which
indicates a precursor role regarding the development of delamination and which assumes that the delamination initiation is principally related to mode I characteristics.
After this phase of delamination initiation, propagation of
delamination is principally defined by mode II (Fig. 13b). This
shearing fracture mode is due to high stresses in the lower ply of
the interface in the fiber direction (rl), inducing high shear stresses
in interfaces (slz and stz), and explains the propagation direction of
the delamination in the fiber direction of the lower ply.
In Fig. 14, the deformed shape of the plate, obtained numerically, is represented in two cut planes 0° and 90°, at maximum displacement (Fig. 14a) and after a 25-J impact (Fig. 14b). Some major
damage is clearly visible in this figure: for example, the first ply,
non-impacted side, is clearly broken in the transverse direction,
which is visible in the 90° cut. It can also be observed that, for
an impact of 25 J, this ply is not broken in the fiber direction. This
transverse crack corresponds to the conventional crack observed
after impact on the non-impacted side [27]. Delamination is also
1
For interpretation of color in Figs. 12 and 15, the reader is referred to the web
version of this article.
Disp. (mm)
1.3
0°
45°
90°
-45°
90°
45°
0°
90° cut
-6
Impact axis
Impact axis
4 mm
0°
45°
90°
-45°
90°
45°
0°
0° cut
t = 1.9 ms / F = 5.5 kN
(a)
90° cut
Disp. (mm)
0°
45°
90°
-45°
90°
45°
0°
0
-1.5
Impact axis
4 mm
0° cut
Impact axis
0°
45°
90°
-45°
90°
45°
0°
t = 4.5 ms / F = 0 kN
(b)
Fig. 14. Deformed mesh during 25 J impact at maximum displacement (a) and after impact (b).
Z displacement (mm)
0.22
100 mm
100 mm
90°
45°
0°
Impacted side
Defomation scale
factor : 40
Impacted side
Permanent
indentation
-0.61
Experiment
0.94
Model
0°
90°
45°
Defomation scale
factor : 20
Non impacted side
-0.29
(a)
Non impacted side
(b)
Fig. 15. Deformed shape of the plate after a 25 J impact: experimental (a) and numerical (b) results.
observable, in the very large opening of the first interface, nonimpacted side, on the 0° cut. The significant delamination of this
interface is conventionally observed using C-Scan (Fig. 10a). The
central zone below the impactor is also severely damaged, as in
the experiment (Fig. 2a). The overall simulated shape of permanent
deformation (Fig. 10b) correlates well with experimental photographs (Fig. 2a) and in particular the permanent opening of the
non-impacted side’s first delamination is obtained, although the
simulated opening is larger than the experimental one. This difference can be partially due to the experimental procedure of cutting
and polishing which induces partial disappearance of the permanent indentation, but also to the model of matrix crack blocking
which is in an early stage and should be confirmed in other cases.
A study is currently underway to determine the importance of debris blocking of the 45° cracks on the permanent indentation.
Then, the deformed shape of the plate resulting from the 25-J
impact is plotted on the impacted and non-impacted sides
(Fig. 15). The experimental results are obtained with Vic-3DÒ
image correlations and the numerical results are obtained from
the finite element calculations. The permanent indentation is
clearly visible on the impacted side, but is difficult to define because the plate is twisted. We choose to define it according to
the distance between the lowest line of the twisted plate and the
lowest point of the plate, i.e. at the impact point (Fig. 15a). In this
case, a value of about 0.5 mm is obtained. The plate shape after impact is accurately simulated by the numerical model, and in particular, the general twisted shape of the plate is reproduced. The
orientation of the twisted shape, in the diagonal the nearest to
the 45° ply, is due to the [02, 452, 902, 452]S draping sequence
which induces a higher bending stiffness in this direction. In practical terms, the bending stiffness in this direction. In practical
terms, the bending stiffness D11 is about 3.6 105 N. mm in the
45° direction, compared to 1.8 105 N. mm in the 45° direction.
This twisted shape is also visible on the non-impacted side, in
both the experimental and numerical results. Moreover, the deformation of the impact point is larger than on the impacted side. For
example, in the Z direction, the permanent indentation is about
1 mm compared to 0.5 mm on the impacted side. On the nonimpacted side, the terms of the impact point and the permanent
indentation have been exaggerated to simplify the discussion. This
higher indentation on the non-impacted side is due to the increased plate thickness in the impacted zone. This phenomenon
is also visible in the micrographic cuts (Fig. 2), although it is lower,
probably due to the cutting and polishing processes. It is generally
simulated by the model, although amplified. Indeed, the black zone
(Fig. 15b) represents Z-displacements above 0.94 mm, the highest
experimental value, and the gray zone represents Z-displacements
below 0.29 mm, the lowest experimental value obtained. Moreover, the experimental and numerical scales are set to a constant
and were correlated to half scale (green color). Moreover, it can
be observed on the numerically obtained, non-impacted side of
the deformed shape, openings exist between consecutive fiber
strips (white colored zone). These opening are artificial and due
to the large deformation scale factor.
The deformed zone is also larger in the 0° plane of the nonimpacted side, compared to the impacted side. This phenomenon
is also generally simulated by modeling even if it is amplified.
Consequently, the relatively good correlation of the simulations
with experimental results on the deformed shape obtained after
impact shows the accuracy of the permanent indentation modeling.
4. Conclusion
A numerical model has been elaborated in order to simulate the
different impact damage types developing during low velocity/low
energy impact. The three most current damage types are simulated: matrix cracking, fiber failure and delamination.
The originality of the proposed model is to simulate permanent
indentation after impact with a ‘‘plastic-like’’ model introduced in
the interface elements of matrix cracking. This choice is based on
experimental observations showing matrix cracking debris which
block crack closure. The accurate correlation between experimental and numerical results, in particular of the deformation after impact, confirms the interest of this novel approach in describing the
physics behind permanent indentation. Nevertheless, modeling the
permanent indentation required two supplementary material
parameters These parameters are difficult to relate to conventional
material parameters measured in conventional tests and are directly determined using the impact test. Therefore, this evaluation
process limits the predictive character of this model, and in particular for the part linked to permanent indentation. Other studies are
currently underway in order to evaluate these parameters with
other, simpler experimental studies.
This model accurately simulates a reference impact case on
composite laminate with UD reinforcement with a few material
parameters to identify. Indeed, except for the two material parameters for permanent indentation directly determined using impact
tests, all other values are obtained from conventional experimental
tests described in the literature. Of course, this conclusion should
be confirmed with other conditions, such as other impact energies,
other draping sequences, other boundary conditions, and other
materials. Moreover, the mesh sensitivity should be studied
further.
This modeling results in very complex meshing with many elements and a long calculation time. This is a problem for industrial
calculation with complex draping sequences and complex geometry. Nevertheless, it is possible to simulate an impact on a real
structure using this type of model for the area concerned with
the impact damage, and with a classical FE model on the remaining
structure.
Lastly, in order to be able to numerically optimize design of
composite structures with impact damage tolerance, it is necessary
to simulate the impact damage and the residual mechanical
characteristics after impact, using the same model. This work is
currently in progress and shows that other problems appear, for
example, fiber failure under compression stress.
References
[1] Abrate S. Impact on composites structures. Cambridge Univ. Press; 1998.
[2] Rouchon J. Fatigue and damage tolerance aspects for composite aircraft
structures. Delft; 1995.
[3] Tropis A, Thomas M, Bounie JL, Lafon P. Certification of the composite outer
wing of the ATR72. J Aero Eng 1994;209:327–39.
[4] Alderliesten RC. Damage tolerance of bonded aircraft structures. Int J Fatigue
2008;31(6):1024–30.
[5] Petit S, Bouvet C, Bergerot A, Barrau JJ. Impact and compression after impact
experimental study of a composite laminate with a cork thermal shield.
Compos Sci Technol 2007;67:3286–99.
[6] Zheng D, Binienda WK. Effect of permanent indentation on the delamination
threshold for small mass impact on plates. Int J Solid Struct 2007;44(25–
26):8143–58.
[7] Eve O. Etude du comportement des structures composites endommagées par
un impact basse vitesse. Thèse de doctorat. Université de Metz; 1999.
[8] Allix O, Blanchard L. Mesomodeling of delamination: towards industrial
applications. Compos Sci Technol 2006;66:731–44.
[9] Choi HY, Chang K. A model for predicting damage in graphite/epoxy laminated
composites resulting from low-velocity point impact. J Compos Mater
1992;26(14):2134–69.
[10] De Moura MF, Gonçalves SF. Modelling the interaction between matrix
cracking and delamination in carbon-epoxy laminates under low velocity
impact. Compos Sci Technol 2004;64:1021–7.
[11] Chang FK, Chang K. A progressive damage model for laminate composites
containing stress concentrations. J Compos Mater 1987:834–55.
[12] Abi Abdallah E, Bouvet C, Rivallant S, Broll B, Barrau JJ. Experimental analysis of
damage creation and permanent indentation on highly oriented plates.
Compos Sci Technol 2009;69(7-8):1238–45.
[13] Chen P, Shen Z, Xiong J, Yang S, Fu S, Ye L. Failure mechanisms of
laminated composites subjected to static indentation. Compos Struct
2006;75:489–95.
[14] Caprino G, Langella A, Lopresto A. Indentation and penetration of carbon fibre
reinforced plastic laminates. Composites: Part B 2003;34:319–25.
[15] Shi Y, Swait T, Soutis C. Modelling damage evolution in composite laminates
subjected to low velocity impact. Compos Struct; 2012. doi: 10.1016/
j.compstruct.2012.03.039.
[16] Fiedler B, Hojo M, Ochiai S, Schulte K, Ando M. Failure behavior of an epoxy
matrix under different kinds of static loading. Compos Sci Technol
2001;61:1615–24.
[17] Faggiani A, Falzon BG. Predicting low-velocity impact damage on a stiffened
composite panel. Composites: Part A 2010;41(6):737–49.
[18] Iannucci L, Willows ML. An energy based damage mechanics approach to
modelling impact onto woven composite materials – Part I: Numerical models.
Composites: Part A 2006;37:2041–56.
[19] Johnson HE, Louca LA, Mouring S, Fallah AS. Modelling impact damage in
marine composite panels. Int J Imp Eng 2009;36:25–39.
[20] Berbinau P, Soutis C, Goutas P, Curtis PT. Effect of off-axis ply orientation on 0fibre microbuckling. Composites Part A 1999;30:1197–207.
[21] Karakuzu R, Erbil E, Aktas M. Impact characterization of glass/epoxy composite
plates: an experimental and numerical study. Composites Part B
2010;41:388–95.
[22] Gonzalez EV, Maim P, Camanho PP, Turon A, Mayugo JA. Simulation of dropweight impact and compression after impact tests on composite laminates.
Comput Struct; 2012. doi: 10.1016/j.compstruct.2012.05.015.
[23] Donadon MV, Iannucci L, Falzon BG, Hodgkinson JM, de Almeida SFM. A
progressive failure model for composite laminates subjected to low velocity
impact damage. Comput Struct 2008;86(11–12):1232–52.
[24] Bouvet C, Castanié B, Bizeul M, Barrau JJ. Low velocity impact modeling in
laminate composite panels with discrete interface elements. Int J Solid Struct
2009;46(14–15):2809–21.
[25] Bouvet C, Rivallant S, Barrau JJ. Low velocity impact modelling in laminate
composites and permanent indentation. Workshop on dynamic failure of
composites and sandwich structures. Toulouse, France: Institut Clément Ader;
2011.
[26] Lopes CS, Camanho PP, Gürdal Z, Maimí P, González EV. Low-velocity impact
damage on dispersed stacking sequence laminates. Part II: Numerical
simulations. Compos Sci Technol 2009;69(7–8):937–47.
[27] Aymerich F, Dore F, Priolo P. Simulation of multiple delaminations in impacted
cross-ply laminates using a finite element model based on cohesive interface
elements. Compos Sci Technol 2009;69:1699–709.
[28] Wisnom MR. Modelling discrete failures in composites with interface
elements. Compos Part A: Appl Sci Manuf 2010;41(7):795–805.
[29] Ha-Minh C, Kanit T, Boussu F, Abdellatif I. Numerical multi-scale modeling for
textile woven fabric against ballistic impact. Compos Mater Sci 2011;50(7):
2172–84.
[30] Mi Y, Crisfield MA, Davies GAO. Progressive delamination using interface
elements. J Compos Mater 1998;32(14):1246–72.
[31] Prombut P. Caractérisation de la propagation de délaminage des stratifiés
composites multidirectionnels. Thèse de doctorat. Université de Toulouse; 2007.
[32] Prombut P, Michel L, Lachaud F, Barrau JJ. Delamination of multidirectional
composite laminates at 0°/theta° ply interfaces. Eng Fract Mech 2006;7:
2427–42.
[33] Raimondo L, Iannucci L, Robinson P, Curtis PT. A progressive failure model for
mesh-size-independent FE analysis of composite laminates subject to lowvelocity impact damage. Compos Sci Technol 2012;72:624–32.
[34] ABAQUS 6.9-3 User’s manual. (RI) USA: Dassault Systemes Simulia Corp.
Providence; 2009.
[35] Hashin Z, Rotem A. A fatigue failure criterion for fiber-reinforced materials. J
Compos Mater 1973;7:448–64.
[36] Hashin Z. Failure criteria for unidirectional fiber composites. J Appl Mech
1980;47:329–34.
[37] HexplyÒ M21 product data – HexPly company.
[38] Pinho ST, Robinson P, Iannucci L. Fracture toughness of the tensile and
compressive fibre failure modes in laminated composites. Compos Sci Technol
2006;66:2069–79.
[39] Caprino G, Lopresto A, Langella A, Leone C. Damage and energy absorption in
GFRP laminates impacted at low-velocity: indentation model. Proc Eng
2011;10:2298–311.
[40] Bazant ZP, Oh BH. Progressive Carck and band theory for fracture of concrete.
Mater. Struct. 1983;16:155–77.
[41] Pinho ST. Modelling failure of laminated composites using physically-based
failure models. PhD of the University of London; 2005.
[42] Yang Q, Cox B. Cohesive models for damage evolution in laminated
composites. Int J Fract 2005;133:107–37.


© Copyright 2026