
2232
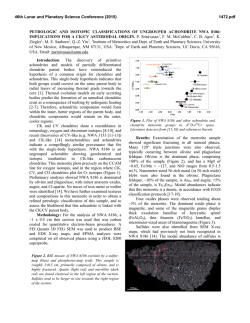
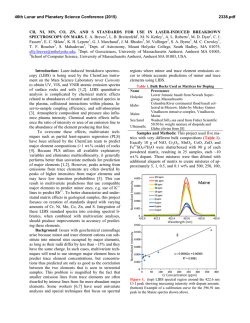
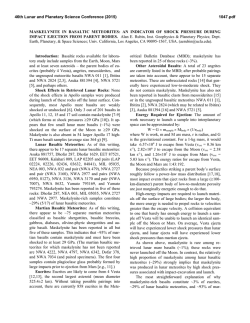
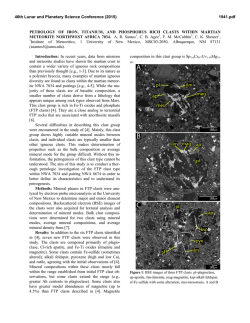
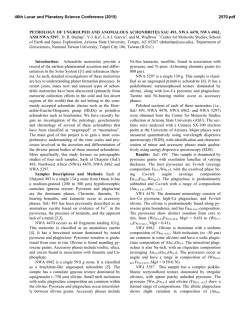
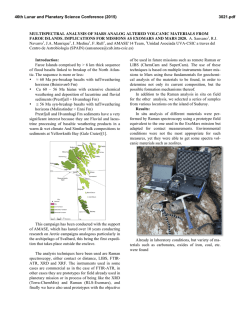
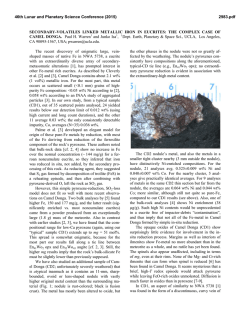
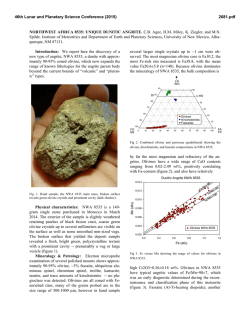
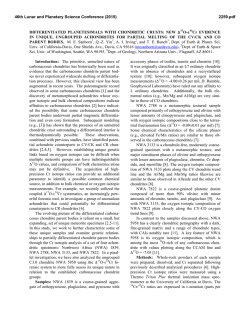
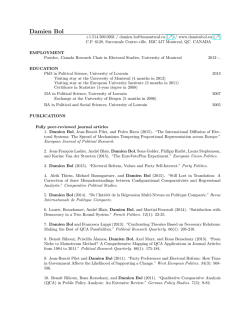
46th Lunar and Planetary Science Conference (2015)
2232.pdf
LASER INDUCED BREAKDOWN SPECTROSCOPY SAMPLING IN MARTIAN POLYMICT BRECCIA
NORTHWEST AFRICA 7034. S. R. Gordon1, H. E. Newsom1, S. Clegg2, M. D. Dyar3, and C. B. Agee1, 1Institute
of Meteoritics, Univ. New Mexico, Albuquerque, NM 87131 ([email protected]), 2Los Alamos National Laboratory (LANL), Los Alamos, NM, 3Department of Astronomy, Mount Holyoke College, South Hadley, MA, USA.
Introduction: The ChemCam instrument on board
the Mars Science Laboratory (MSL) Curiosity rover
uses laser induced breakdown spectroscopy (LIBS) to
determine the chemical composition of rock and soil
targets in Gale crater, Mars. The 1064 nm laser with a
spot size on the scale of ~350 microns can be shot in
grids, called rasters, to examine many locations and
determine an average composition for each target [1].
The number of LIBS spectra needed to calculate an
accurate average rock composition varies by the grain
size and heterogeneity of each target. A study by [2]
used modeling to determine the number of LIBS observations needed to give an accurate bulk composition
of a heterogeneous target based on the spot size/grain
size ratio. This study is replicated here using a martian
heterogenous hand sample, basaltic breccia Northwest
Africa (NWA) 7034. NWA 7034 has a bulk composition similar to the martian crust [3] and includes clasts
of varying compositions ranging in size on the order of
hundreds of microns to tens of mm [4]. The principals
from [2] are used to perform a semi-quantitative experiment using energy dispersive spectroscopy (EDS)
element maps of the meteorite to determine the number
of LIBS observations needed to give accurate clast and
bulk compositions for this sample. The LIBSSIM program used in [2] is also used to test the sampling limits
needed to accurately analyze a heterogenous sample
using NWA 7034 as a basis for a theoretical model.
Methods: Qualitative Study The sample used in
this study is a polished, carbon coated, saw cut slab of
NWA 7034 that had already been analyzed by LIBS in
ten locaitons; thus, ten LIBS pits are visible on the
surface of the sample. EDS images of NWA 7034 were
created using the JEOL JSM 5800LV scanning electron microscope (SEM) at the University of New Mexico using a 30 kV accelerating voltage, 32 nA beam
current and 150x magnification. Images of Si, Ti, Al,
Fe, Mg, Ca, Na, and K were created along with a
backscattered electron (BSE) image. Pixel intensity
corresponds to the relative concentration of the element in each pixel. Relative changes in elemental
composition were measured on the scale of a LIBS
spot size across the bulk matrix and within two basaltic
clasts in the meteorite using the ImageJ program. The
average pixel intensities and their standard deviations
were then compared to determine how many LIBS
observations would give statistically different results
among the matrix and basaltic clasts in the meteorite.
The results of the Mg imaging and analysis process are
presented in this abstract.
Figure 1. Backscattered electron (BSE) image of the NWA
7034 sample used in this study. The lower right corner of the
sample has been cut off due to instrument limitations and
sample size. EDS analysis points for the bulk matrix are
shown in a grid on the left side of the sample. Two clasts
(outlined in white dashed curves) and their EDS analysis
points are shown on the bottom right of the sample. Areas
discussed in Figures 2 and 3 are outlined in yellow dotted
boxes.
Quantitative Study The methods outlined in the
LIBSSIM
Research
Version
User
Guide
(http://mtholyoke.edu/~pdobosh/libssim) and the bulk
mineralogy of NWA 7034 reported in the text of [3]
were used to simulate the matrix of the meteorite sample. In the program, each color in the simulation grid
represents a different mineral input by the user. The
pixel counts of theoretical LIBS observations are translated to oxide weight percentages at random locations
on the grid. For the matrix simulation, a grain size of 5
pixels (correlating to 50 microns) and a beam size of
35 pixels (350 microns) were chosen to represent the
average fine-grained matrix and LIBS spot sizes. Ten
random observation points were taken inside the grid
and the average oxide percentages at those locations
were compared to the bulk composition of NWA 7034
reported in the supplemental materials of [3].
Qualitative Results: Bulk matrix composition. A
3x4 grid of analysis locations was created on the Mg
map for NWA 7034. Each rectangular analysis area
spans the LIBS spot size seen on the surface of the
sample. The average pixel intensity of each analysis
location was measured as a proxy of the average Mg
composition that would be measured by a LIBS analy-
46th Lunar and Planetary Science Conference (2015)
sis point in that location. The average intensity of the
grid was calculated to be 22.5 and the standard deviation is 0.4.
2232.pdf
cept FeO with average values still within 1-σ, suggesting more than ten observation points would give more
precise oxide composition values. The decrease in
standard deviation is greater than 5% for SiO2, Al2O3,
TiO2, Fe2O3, CaO, and Na2O when the number of observations is increased from 10 to 20. A further increase to 30 LIBS observation points shows a greater
decrease in all oxide standard deviations except FeO,
MgO, and K2O.
Figure 2. Magnesium EDS image overlain with EDS analysis locations on the matrix. See Figure 1 for scale.
Individual clast compositions. Twelve analyses of
two basaltic clasts were made on the Mg EDS image as
shown in Figure 3. The average intensity of each rectangular location was recorded, and the average and
standard deviation of the six observations for each
clast were then compared. For the clast to the left in
the image, the average intensity is 20.2 with a standard
deviation of 0.3. For the clast to the right in the image,
the average Mg pixel intensity is 24.7 with a standard
deviation of 0.7.
Figure 3. Magnesium EDS image overlain with EDS analysis locations on two basaltic clasts, outlined in the dashed
white lines. See Figure 1 for scale.
Quantitative Results: The LIBSSIM grid simulation of NWA 7034 matrix gave similar totals to the
bulk composition reported in the supplemental materials of [3] within 1-σ for Al2O3, Na2O, and K2O and
within 2-σ for SiO2, FeO, and MgO. TiO2 and CaO
were not similar to the reported values within 2-σ;
thus, they will not be included in the discussion.
The 10-location theoretical LIBS observation done
by LIBSSIM program shows a reliable bulk composition for the simulated NWA 7034 matrix. This supports the conclusions of [2] that when the grain size of
a sample is smaller than the beam size, an accurate
analysis can be taken with just ten LIBS locations.
Increasing the number of observations from 10 to 20
decreased the standard deviation of all the oxides ex-
Figure 4. LIBSSIM grid simulation of NWA 7034 bulk matrix using mineralogy given in [3] and an average grain size
of 50 microns. Each colored square represents one of the
following different minerals: andesine, enstatite, ferrosilite,
pigeonite, augite, magnetite, maghemite, anorthoclase. Black
squares represent theoretical LIBS analysis locations.
Conclusions: Qualitative Study The two clasts
show a statistical difference when sampled in six different locations on each clast on the Mg element map.
Additionally, compared to the average intensity of the
section of matrix measured in this study, each area has
statistically different measurements. Thus, the ChemCam testbed unit used to analyze this meteorite sample
should be able to qualitatively distinguish between
bulk matrix and clast compositions with fewer than ten
observation points.
Quantitative Study The LIBSSIM experiment using
a simulated NWA 7034 matrix composition supported
the results of the theoretical study in [2]. Further study
is needed to determine the best number of LIBS analysis locations needed to precisely analyze the LIBSSIM
simulation of NWA 7034. A study using LIBSSIM to
recreate the clast compositions in this sample will also
allow for further testing of the LIBSSIM program using NWA 7034 as a basis for simulation of heterogenous martian material.
References: [1] Wiens, R. C. et al (2102) Space Sci. Rev., 170,
167-227. [2] McCanta, M. C. et al (2013) Plan. and Space Sci., 81,
48-54. [3] Agee, C. B. et al (2012) Science, 339, 780-785. [4]
McCubbin, F. M. et al (2104) 77th Met. Soc. Meeting, #5099.

© Copyright 2026