
Atlas Copco - Engelsk faxmall - för hela företaget
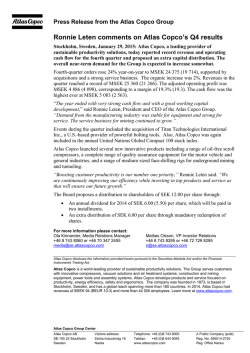
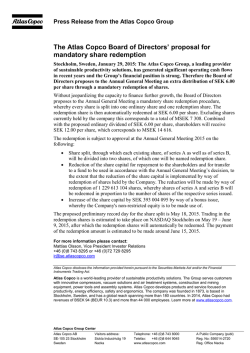
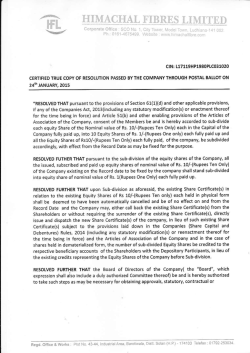
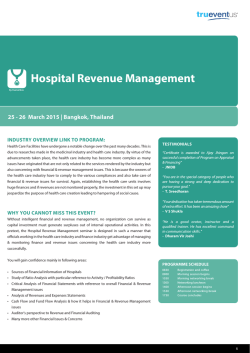
Press Release from the Atlas Copco Group January 29, 2015 Atlas Copco Interim report on Q4 and full-year summary 2014 (unaudited) Record operating cash flow and extra distribution proposed Orders increased 24% year-on-year to MSEK 24 375 (19 714), organic growth of 2% Revenues increased to a record of MSEK 25 360 (21 266), organic decline of 3% Operating profit at MSEK 4 771 (4 155), including items affecting comparability of MSEK -115 (+57), corresponding to a margin of 18.8% (19.5) Adjusted operating profit of MSEK 4 886 (4 098), corresponding to a margin of 19.3% (19.3) Profit before tax amounted to MSEK 4 436 (3 925) Profit for the period increased 15% to MSEK 3 335 (2 903) Basic earnings per share were SEK 2.74 (2.39) Record operating cash flow at MSEK 5 083 (2 563) The Board proposes a distribution to shareholders of SEK 12.00 per share through annual dividend for 2014 of SEK 6.00 (5.50) per share, which will be paid in two installments an extra distribution of SEK 6.00 per share through mandatory share redemption MSEK Orders received Revenues Operating profit – as a percentage of revenues Profit before tax – as a percentage of revenues Profit for the period Basic earnings per share, SEK Diluted earnings per share, SEK Return on capital employed, % October - December 2014 2013 24 375 19 714 25 360 21 266 4 771 4 155 18.8 19.5 4 436 3 925 17.5 18.5 3 335 2 903 2.74 2.39 2.73 2.38 24 January - December 2014 2013 93 873 81 290 93 721 83 888 17 015 17 056 18.2 20.3 13% 16 091 16 266 17.2 19.4 15% 12 175 12 082 10.01 9.95 9.99 9.92 % 24% 19% 15% % 15% 12% 0% -1% 1% 28 Near-term demand outlook The overall demand for the Group is expected to increase somewhat. Previous near-term demand outlook (published October 20, 2014): The overall demand for the Group’s equipment and service is expected to increase somewhat. Atlas Copco Group Center Atlas Copco AB SE-105 23 Stockholm Sweden Visitors address: Sickla Industriväg 19 Nacka Telephone: +46 (0)8 743 8000 Telefax: +46 (0)8 644 9045 Web site www.atlascopco.com A Public Company (publ) Reg. No: 556014-2720 Reg. Office Nacka Atlas Copco – Q4 2014 2 (19) Atlas Copco Group – Summary of full-year 2014 Orders and revenues Orders received in 2014 increased 15% to MSEK 93 873 (81 290), corresponding to an organic growth of 1%. Revenues increased 12%, to MSEK 93 721 (83 888), corresponding to a 2% organic decline. Sales bridge MSEK 2013 Structural change, % Currency, % Price, % Volume, % Total, % 2014 January - December Orders received Revenues 81 290 83 888 +12 +12 +2 +2 +1 +1 +0 -3 +15 +12 93 873 93 721 Results and cash flow Operating profit amounted to MSEK 17 015 (17 056), corresponding to a margin of 18.2% (20.3). Items affecting comparability amounted to MSEK -729 (+63) and include impairment of assets and restructuring costs in Mining and Rock Excavation Technique of MSEK -415 (-120) and onetime items in Compressor Technique of MSEK -180 and in Common Group Functions of -134 (+183). Adjusted operating margin was 18.9% (20.3). Changes in exchange rates compared with the previous year had a positive effect on the operating profit of MSEK 670. Profit before tax amounted to MSEK 16 091 (16 266), corresponding to a margin of 17.2% (19.4). Profit for the period totaled MSEK 12 175 (12 082). Basic and diluted earnings per share were SEK 10.01 (9.95) and SEK 9.99 (9.92), respectively. Operating cash flow before acquisitions, divestments and dividends reached a record MSEK 13 869 (9 888). Orders, revenues and operating profit margin 100 000 Dividend The Board of Directors proposes to the Annual General Meeting that an ordinary dividend of SEK 6.00 (5.50) per share be paid for the 2014 fiscal year. Excluding shares currently held by the company, this corresponds to a total of MSEK 7 308 (6 675). The dividend is proposed to be paid in two equal installments, the first with record date April 30, 2015 and the second with record date October 30, 2015. The proposed payment periods will facilitate a more efficient cash management. Mandatory share redemption Atlas Copco has generated significant operating cash flows in recent years and the Group’s financial position is strong. Without jeopardizing the capacity to finance further growth, the Board of Directors proposes to the Annual General Meeting a mandatory share redemption procedure, whereby every share is split into one ordinary share and one redemption share. The redemption share is then automatically redeemed at SEK 6.00 per share. This corresponds to a total of MSEK 7 308. Combined with the proposed ordinary dividend, shareholders will receive MSEK 14 616. The redemption is subject to approval at the Annual General Meeting 2015. The proposed preliminary record day for the share split is May 18, 2015. The payment of the redemption shares would, if approved, be made around June 15, 2015. Personnel stock option program The Board of Directors will propose to the Annual General Meeting a similar performance-based long-term incentive program as in previous years. For Group Management, participation in the plan will require own investment in Atlas Copco shares. It is proposed that the plan is covered as before through the repurchase of the company’s own shares. The details of the proposal will be communicated in connection with the Notice of the Annual General Meeting. Earnings and dividends 25% 25 22.38 90 000 80 000 20% 20 15% 15 70 000 60 000 12.00 50 000 12.24 40 000 10% 10 9.00 30 000 8.33 20 000 5% 11.47 10.68 9.95 10.01 5.50 6.00 8.16 4.84 6.09 5 5.22 10 000 5.14 3.71 0 0% 2004 2005 2006 2007 2008 2009 2010 2011 2012 2013 2014 0 1.50 2.13 2.38 3.00 3.00 3.00 4.00 5.00 5.50 2004 2005 2006 2007 2008 2009 2010 2011 2012 2013 2014* Earnings per share, SEK Orders received, MSEK Revenues, MSEK Operating margin, % Adjusted operating margin, % Ordinary dividend per share, SEK Dividend and redemption per share, SEK *As proposed by the Board Atlas Copco – Q4 2014 3 (19) Review of the fourth quarter Market development The demand for Atlas Copco’s equipment and services improved somewhat sequentially i.e. compared to the previous quarter, supported by growth in the service business. The demand improved for industrial tools and assembly systems. For stationary compressors, the demand was mixed with continued robust demand for small- and medium sized machines and low demand for large machines. The demand for mining and construction equipment was largely unchanged at a low level. Edwards, the vacuum solutions business, had a strong quarter. Compared to the previous year, the order volumes increased for industrial tools and assembly systems, were stable for small- and medium-sized compressors, and somewhat lower for large compressors and for mining and construction equipment. The service business continued to grow. Sales bridge October - December Orders received Revenues 19 714 21 266 +13 +14 +9 +8 +1 +1 +1 -4 +24 +19 24 375 25 360 MSEK 2013 Structural change, % Currency, % Price, % Volume, % Total, % 2014 Orders, revenues and operating profit margin 30 000 30% 25 000 25% 20 000 20% 15 000 15% 10 000 10% 5 000 5% Geographic distribution of orders received excl. Edwards October - December Atlas Copco Group 2014 Orders recieved Change* Change* +23 +9 North America 24 -3 -4 South America 8 +14 +8 Europe 31 -1 -1 Africa/Middle East 9 +21 -4 Asia 24 +18 +18 Australia 4 +14 +4 100 *Change in orders received compared to the previous year in local currency, % %. October - December 2014 North America South America Europe Africa/Middle East Asia/Australia Compressor Technique 22 6 31 6 35 100 Industrial Technique 28 4 44 1 23 100 0 0% Q1 Q2 Q3 Q4 Q1 Q2 Q3 Q4 Q1 Q2 Q3 Q4 2012 2012 2012 2012 2013 2013 2013 2013 2014 2014 2014 2014 Orders received, MSEK Revenues, MSEK Operating margin, % Adjusted operating margin, % Mining and Rock Excavation Tech. 25 14 20 17 24 100 Construction Technique 23 9 35 13 20 100 Atlas Copco Group 24 8 31 9 28 100 Atlas Copco – Q4 2014 Revenues, profits and returns Revenues were MSEK 25 360 (21 266), corresponding to an organic decrease of 3%. The operating profit at MSEK 4 771 (4 155) includes items affecting comparability of MSEK -115 (+57), whereof MSEK -120 in Compressor Technique and MSEK +5 (+127) in Common Group Functions. The latter includes an insurance reimbursement of MSEK +40 and MSEK -35 (+37) change in provision for share-related long-term incentive programs. The fourth quarter 2013 also included restructuring costs of MSEK 70 in Mining and Rock Excavation Technique and a capital gain of MSEK 90 in Common Group Functions. The adjusted operating profit increased 19% to MSEK 4 886 (4 098), corresponding to a margin of 19.3% (19.3). The profit improvement was primarily due to acquisitions and more favorable exchange rates. The margin was negatively affected by lower revenue volume and dilution from acquisitions, but supported by currency. The positive net currency effect compared to the previous year was MSEK 490. Net financial items were MSEK -335 (-230). Interest net was MSEK -206 (-233) and other financial items were MSEK -129 (+3), related to exchange differences and revaluation of financial derivatives. Profit before tax amounted to MSEK 4 436 (3 925), corresponding to a margin of 17.5% (18.5). Profit for the period totaled MSEK 3 335 (2 903). Basic and diluted earnings per share were SEK 2.74 (2.39) and SEK 2.73 (2.38), respectively. The return on capital employed during the last 12 months was 24% (28). Return on equity was 28% (34). The Group uses a weighted average cost of capital (WACC) of 8.0% as an investment and overall performance benchmark. Revenues and operating profit – bridge Volume, price, MSEK Q4 2014 mix and other Atlas Copco Group Revenues 25 360 -681 EBIT 4 771 -207 % 18.8% 30% 4 (19) Operating cash flow and investments Operating cash surplus reached MSEK 5 707 (4 310), supported by acquisitions and currency. Working capital decreased by MSEK 1 179 (603), primarily due to a reduction of inventory, and, compared to previous year, the tax payments were low in the quarter. Rental equipment, net, increased MSEK 224 (234). Net investments in property, plant and equipment were MSEK 503 (341), and the increase was primarily related to the acquired businesses. In total, operating cash flow reached a record at MSEK 5 083 (2 563). Net indebtedness The Group’s net indebtedness, adjusted for the fair value of interest rate swaps, amounted to MSEK 15 428 (7 504), of which MSEK 2 531 (1 414) was attributable to postemployment benefits. The acquisitions of Edwards and Henrob explain the main part of the increase in net debt. The Group has an average maturity of 5.1 years on interest-bearing liabilities. The net debt/EBITDA ratio was 0.7 (0.4). The net debt/equity ratio was 30% (19). Acquisition and divestment of own shares During the quarter, 1 143 777 A shares and 69 500 B-shares were divested for a net value of MSEK 262. These transactions are in accordance with mandates granted by the Annual General Meeting and relate to the Group’s long-term incentive programs. Employees On December 31, 2014, the number of employees was 44 056 (40 241). The number of consultants/external workforce was 3 015 (2 137). For comparable units, the total workforce decreased by 407 from December 31, 2013. Currency One-time items and acquisitions 1 690 490 3 085 405 Share based LTI programs -72 Q4 2013 21 266 4 155 19.5% Atlas Copco – Q4 2014 5 (19) Compressor Technique MSEK Orders received Revenues Operating profit – as a percentage of revenues Return on capital employed, % October - December 2014 2013 11 035 7 734 11 685 8 546 2 471 1 948 21.1 22.8 40 65 % 43% 37% 27% January - December 2014 2013 42 249 31 765 42 165 31 782 8 974 7 279 21.3 22.9 % 33% 33% 23% 2013 figures have been restated to adjust for the move of the Specialty Rental division from the Compressor Technique business area to the Construction Technique business area. Stable equipment orders and growth in service Strong quarter for vacuum solutions Adjusted operating margin at 22.2% Sales bridge MSEK 2013 Structural change, % Currency, % Price, % Volume, % Total, % 2014 October - December Orders received Revenues 7 734 8 546 +30 +30 +9 +9 +1 +1 +3 -3 +43 +37 11 035 11 685 Industrial compressors The demand for small- and medium-sized compressors was robust and the order volumes remained at the same level as in the previous year as well as sequentially. Compared to the previous year, all regions had a positive development, except Asia, which had significantly lower orders in China and India. The demand for larger machines continued to be soft and order volumes were somewhat lower compared to the previous year, but somewhat higher sequentially. Geographically, the order intake for large machines was very strong in Africa/Middle East and in South America, but continued to be weak in Asia. Gas and process compressors The order intake improved compared to the previous year, but declined somewhat sequentially. Geographically and compared to the previous year, orders increased in the Middle East, in Asia and in Europe, but decreased in North America. Vacuum solutions The vacuum solutions business continued to have a robust order intake with a strong demand from the semiconductor industry, particularly in Asia. See also page 16. Service The service business continued to grow in all major markets with the highest growth rates in Asia, South America and Africa/Middle East. Innovation A range of oil-free scroll compressors was introduced, targeting several applications, e.g. laboratories and dairies. These silent, compact compressors have been equipped with more efficient motors and a more advanced controller. The range also has a new more energy-efficient element and include also multi scroll units, which can operate in various set-ups, matching the capacity to the customer’s air demand. In early 2015, Atlas Copco will introduce a variable speed drive (VSD) vacuum pump for general industrial applications. The pump, called GHS VSD+, represents a real leap forward and delivers significant energy savings of around 50%. Revenues and profitability Revenues increased to a record of MSEK 11 685 (8 546), corresponding to a 2% organic decline. The operating profit was MSEK 2 471 (1 948). The profit includes items affecting comparability of MSEK 120. This includes a negative effect for 2014 of MSEK 50 related to a one-time acquisition accounting adjustment for currency derivatives entered by Edwards prior to the acquisition, and several smaller items. The adjusted operating margin was 22.2% (22.8) and was supported by currency, but negatively impacted by volume and dilution from acquisitions. Return on capital employed (last 12 months) was 40% (65). Orders, revenues and operating profit margin 12 000 30% 10 000 25% 8 000 20% 6 000 15% 4 000 10% 2 000 5% 0 0% Q1 Q2 Q3 Q4 Q1 Q2 Q3 Q4 Q1 Q2 Q3 Q4 2012 2012 2012 2012 2013 2013 2013 2013 2014 2014 2014 2014 Orders received, MSEK Revenues, MSEK Operating margin, % Adjusted operating margin, % Atlas Copco – Q4 2014 6 (19) Industrial Technique MSEK Orders received Revenues Operating profit – as a percentage of revenues Return on capital employed, % October - December 2014 2013 3 166 2 548 3 468 2 692 783 621 22.6 23.1 36 42 % 24% 29% 26% January - December 2014 2013 11 335 9 594 11 450 9 501 2 557 2 138 22.3 22.5 % 18% 21% 20% Record quarter, with strong growth in Asia and a good start for Henrob Solid growth in the service business Operating margin at 22.6% Sales bridge MSEK 2013 Structural change, % Currency, % Price, % Volume, % Total, % 2014 October - December Orders received Revenues 2 548 2 692 +11 +17 +9 +8 +1 +1 +3 +3 +24 +29 3 166 3 468 Motor vehicle industry The demand for advanced industrial tools and assembly systems to the motor vehicle industry continued to be strong and the order volumes increased both compared to the previous year and sequentially. Geographically and compared to the previous year, the order volumes increased strongly in Asia, but were somewhat lower in North America and Europe. The recently acquired business for self-piercing rivets, Henrob, had a good fourth quarter both in Europe and in North America. Acquisition In December, Atlas Copco acquired Titan Technologies International Inc., a provider of powerful bolting tools to the oil and gas and other industries. The company is based in the U.S. and had revenues of about MUSD 5 (MSEK 35) and 14 employees in 2014. Revenues and profitability Revenues increased to a record of MSEK 3 468 (2 692), corresponding to an organic increase of 4%. Operating profit was also a record at MSEK 783 (621), corresponding to an operating margin of 22.6% (23.1), supported by increased volume and currency, but diluted by acquisitions. Return on capital employed (last 12 months) was 36% (42). Orders, revenues and operating profit margin 4 000 30% 3 500 25% 3 000 20% 2 500 General industry The overall demand for industrial power tools from the general manufacturing industries was stable and order intake was largely unchanged compared to the previous year and sequentially. Orders received from the aerospace segment as well as from customers demanding high torque bolting equipment were strong in the quarter. Geographically, Asia achieved strong growth, while the order volumes in North America were lower than in the previous year. 2 000 15% 1 500 10% 1 000 5% 500 0 Service The service business, e.g maintenance and calibration services, continued to achieve a solid growth, with a particularly strong development in Europe. Innovation A complete range of quality assurance equipment, digital torque wrenches, calibration equipment and calibration benches, used at quality departments at customers to test and calibrate pneumatic and electric assembly tools was introduced in the quarter. The target customers are motor vehicle as well as general industry. 0% Q1 Q2 Q3 Q4 Q1 Q2 Q3 Q4 Q1 Q2 Q3 Q4 2012 2012 2012 2012 2013 2013 2013 2013 2014 2014 2014 2014 Orders received, MSEK Revenues, MSEK Operating margin, % Atlas Copco – Q4 2014 7 (19) Mining and Rock Excavation Technique MSEK Orders received Revenues Operating profit – as a percentage of revenues Return on capital employed, % October - December 2014 2013 6 492 6 162 6 622 6 709 1 225 1 190 18.5 17.7 29 41 % 5% -1% 3% January - December 2014 2013 25 752 26 092 25 718 29 013 4 307 6 083 16.7 21.0 % -1% -11% -29% Stable demand for equipment Continued growth in the service business Further reduction of working capital Sales bridge MSEK 2013 Structural change, % Currency, % Price, % Volume, % Total, % 2014 October - December Orders received Revenues 6 162 6 709 +1 +1 +7 +7 +0 +0 -3 -9 +5 -1 6 492 6 622 Mining equipment The demand for mining equipment remained at a low level. The order volumes were slightly lower sequentially and compared to the previous year. Geographically, Australia, North America and Europe had a higher order intake compared to the previous year, whereas the order intake in Asia and Africa was lower. Civil engineering equipment The order intake for equipment for infrastructure projects was at the same level as in the previous year, but it was somewhat lower sequentially. Service and consumables The service and spare parts business increased somewhat compared to the previous year, with a positive development in North and South America as well as in Australia, but with a negative development in Asia. Consumables volumes decreased compared to the previous year and sequentially, mainly due to a weak development in Asia and in South America. Efficiency measures The business area continued to identify and implement further efficiency measures. The total workforce for comparable units has been reduced by 154 during the quarter, and further reduction of working capital was achieved. Revenues and profitability Revenues were MSEK 6 622 (6 709), corresponding to an organic decline of 9%. Operating profit was MSEK 1 225 (1 190), corresponding to a margin of 18.5% (17.7). Previous year includes restructuring costs of MSEK 70, and the adjusted margin was 18.5% (18.8). The margin was supported by currency, but was impacted negatively by lower volumes and dilution from acquisitions. Return on capital employed (last 12 months) was 29% (41). Orders, revenues and operating profit margin 12 000 30% 10 000 25% 8 000 20% 6 000 15% 4 000 10% 2 000 5% 0 Innovation An upgraded range of medium sized face-drilling rigs for underground mining and tunneling that has been enhanced to make them stronger, cleaner, safer and easier to operate. The design improvements include stronger booms, a new filtration system, increased safety features and Atlas Copco’s award winning rig control system. In field trials these enhancements have returned top ratings for productivity, longer service intervals and lower operating costs. 0% Q1 Q2 Q3 Q4 Q1 Q2 Q3 Q4 Q1 Q2 Q3 Q4 2012 2012 2012 2012 2013 2013 2013 2013 2014 2014 2014 2014 Orders received, MSEK Operating margin, % Revenues, MSEK Adjusted operating margin, % Atlas Copco – Q4 2014 8 (19) Construction Technique MSEK Orders received Revenues Operating profit – as a percentage of revenues Return on capital employed, % October - December 2014 2013 3 714 3 395 3 625 3 449 395 384 10.9 11.1 12 13 % 9% 5% 3% January - December 2014 2013 14 847 14 260 14 739 13 967 1 768 1 733 12.0 12.4 % 4% 6% 2% 2013 figures have been restated to adjust for the move of the Specialty Rental division from the Compressor Technique business area to the Construction Technique business area. Mixed equipment demand Order intake increased in Europe and North America, but was significantly down in China and Brazil Operating margin at 10.9% Sales bridge MSEK 2013 Structural change, % Currency, % Price, % Volume, % Total, % 2014 October - December Orders received Revenues 3 395 3 449 +0 +0 +8 +8 +1 +1 +0 -4 +9 +5 3 714 3 625 Construction equipment The overall order volumes for construction equipment decreased somewhat compared to the previous year. The order volumes decreased for road construction equipment and for portable compressors, while it was stable for construction and demolition tools. Geographically, there was a mixed development with some growth in Europe and North America, while some markets showed significant negative development, e.g. China, Brazil, Australia and in the Middle East. Compared to the previous quarter, and due to normal seasonal effects, the order intake increased for most types of equipment. Revenues and profitability Revenues reached MSEK 3 625 (3 449), corresponding to an organic decline of 3%. Operating profit was MSEK 395 (384), corresponding to a margin of 10.9% (11.1). The margin was negatively affected by volume and product mix, but supported by currency. Return on capital employed (last 12 months) was 12% (13). Orders, revenues and operating profit margin 5 000 20% 4 500 18% 4 000 16% 3 500 14% 3 000 12% 2 500 10% 2 000 8% 1 500 6% 1 000 4% 500 2% 0 Specialty rental The specialty rental business continued to develop favorably and orders received increased in most major markets compared to the previous year. The growth in Asia, North America and Australia was particularly strong. Service The service business grew somewhat, with growth in Africa/Middle East and in Europe and a lower order intake in North and South America. Innovation Atlas Copco’s large paver range has been equipped with stage IV engines and is not only compliant with the latest emission standards, but is also contributing to lower fuel consumption. Calculations suggest that fuel savings up to 4 200 liters annually is possible. 0% Q1 Q2 Q3 Q4 Q1 Q2 Q3 Q4 Q1 Q2 Q3 Q4 2012 2012 2012 2012 2013 2013 2013 2013 2014 2014 2014 2014 Orders received, MSEK Revenues, MSEK Operating margin, % Atlas Copco – Q4 2014 Accounting principles The consolidated accounts of the Atlas Copco Group are prepared in accordance with International Financial Reporting Standards (IFRS) as disclosed in the annual report 2013. The interim report is prepared in accordance with IAS 34 Interim Financial Reporting. New and amended accounting standards The new and amended IFRS standards and IFRIC interpretations effective from January 1, 2014 have not had any material effect on the consolidated financial statements. For further information, see the annual report 2013. Risks and factors of uncertainty Market risks The demand for Atlas Copco’s equipment and services is affected by changes in the customers’ investment and production levels. A widespread financial crisis and economic downturn affects the Group negatively both in terms of revenues and profitability. However, the Group’s sales are well diversified with customers in many industries and countries around the world, which limits the risk. 9 (19) that in most cases there are more than one sub-supplier that can supply a certain component. Atlas Copco is also directly and indirectly exposed to raw material prices. Cost increases for raw materials and components often coincide with strong end-customer demand and can partly be offset by increased sales to mining customers and partly compensated for by increased market prices. Acquisitions Atlas Copco has the ambition to grow all its business areas, primarily through organic growth, complemented by selected acquisitions. The integration of acquired businesses is a difficult process and it is not certain that every integration will be successful. Therefore, costs related to acquisitions can be higher and/or synergies can take longer to materialize than anticipated. For further information, see the annual report 2013. Financial risks Atlas Copco is subject to currency risks, interest rate risks and other financial risks. In line with the overall goals with respect to growth, return on capital, and protecting creditors, Atlas Copco has adopted a policy to control the financial risks to which the Group is exposed. A financial risk management committee meets regularly to manage and follow up financial risks, in line with the policy. Forward-looking statements Some statements in this report are forward-looking, and the actual outcome could be materially different. In addition to the factors explicitly discussed, other factors could have a material effect on the actual outcome. Such factors include, but are not limited to, general business conditions, fluctuations in exchange rates and interest rates, political developments, the impact of competing products and their pricing, product development, commercialization and technological difficulties, interruptions in supply, and major customer credit losses. Production risks Many components are sourced from sub-suppliers. The availability is dependent on the sub-suppliers and if they have interruptions or lack capacity, this may adversely affect production. To minimize these risks, Atlas Copco has established a global network of sub-suppliers, which means Atlas Copco AB Atlas Copco AB and its subsidiaries are sometimes referred to as the Atlas Copco Group, the Group or Atlas Copco. Atlas Copco AB is also sometimes referred to as Atlas Copco. Any mentioning of the Board of Directors or the Directors refers to the Board of Directors of Atlas Copco AB. Atlas Copco – Q4 2014 10 (19) Consolidated income statement MSEK Revenues Cost of sales Gross profit Marketing expenses Administrative expenses Research and development costs Other operating income and expenses Operating profit - as a percentage of revenues Net financial items Profit before tax - as a percentage of revenues Income tax expense Profit for the period Profit attributable to - owners of the parent - non-controlling interests Basic earnings per share, SEK Diluted earnings per share, SEK Basic weighted average number of shares outstanding, millions Diluted weighted average number of shares outstanding, millions Key ratios Equity per share, period end, SEK Return on capital employed, 12 month values, % Return on equity, 12 month values, % Debt/equity ratio, period end, % Equity/assets ratio, period end, % Number of employees, period end 3 months ended Dec. 31 Dec. 31 2014 2013 25 360 21 266 -15 751 -13 323 9 609 7 943 -2 604 -2 163 -1 481 -1 212 -788 -572 35 159 4 771 4 155 18.8 19.5 -335 -230 4 436 3 925 17.5 18.5 -1 101 -1 022 3 335 2 903 12 months ended Dec. 31 Dec. 31 2014 2013 93 721 83 888 -58 669 -51 766 35 052 32 122 -9 825 -8 338 -5 668 -4 801 -2 933 -2 117 389 190 17 015 17 056 18.2 20.3 -924 -790 16 091 16 266 17.2 19.4 -3 916 -4 184 12 175 12 082 3 333 2 2.74 2.73 2 902 1 2.39 2.38 12 169 6 10.01 9.99 12 072 10 9.95 9.92 1 217.2 1 213.3 1 215.6 1 212.8 1 218.1 1 214.5 1 216.6 1 214.2 42 24 28 30 48 44 056 33 28 34 19 45 40 241 Atlas Copco – Q4 2014 11 (19) Consolidated statement of comprehensive income MSEK Profit for the period Other comprehensive income Items that will not be reclassified to profit or loss Remeasurements of defined benefit pension plans Income tax relating to items that will not be reclassified 3 months ended Dec. 31 Dec. 31 2014 2013 3 335 2 903 12 months ended Dec. 31 Dec. 31 2014 2013 12 175 12 082 -160 47 -113 13 -13 0 -759 194 -565 45 -18 27 2 852 - 1 101 15 5 687 - 444 16 -640 -579 -1 052 -712 -15 -117 -199 -31 - - 81 - Income tax relating to items that may be reclassified 428 2 625 352 772 711 5 228 410 127 Other comprehensive income for the period, net of tax 2 512 772 4 663 154 Total comprehensive income for the period 5 847 3 675 16 838 12 236 Total comprehensive income attributable to - owners of the parent - non-controlling interests 5 835 12 3 671 4 16 806 32 12 229 7 Items that may be reclassified subsequently to profit or loss Translation differences on foreign operations - realized and reclassified to income statement Hedge of net investments in foreign operations Cash flow hedges Adjustments for amounts transferred to the initial carrying amounts of acquired operations Atlas Copco – Q4 2014 12 (19) Consolidated balance sheet MSEK Intangible assets Rental equipment Other property, plant and equipment Financial assets and other receivables Deferred tax assets Total non-current assets Inventories Trade and other receivables Other financial assets Cash and cash equivalents Assets classified as held for sale Total current assets TOTAL ASSETS Equity attributable to owners of the parent Non-controlling interests TOTAL EQUITY Borrowings Post-employment benefits Other liabilities and provisions Deferred tax liabilities Total non-current liabilities Borrowings Trade payables and other liabilities Provisions Total current liabilities TOTAL EQUITY AND LIABILITIES Dec. 31, 2014 33 197 3 177 9 433 1 981 1 549 49 337 18 364 26 015 2 150 9 404 11 55 944 105 281 Dec. 31, 2013 17 279 2 420 6 907 2 440 961 30 007 16 826 21 726 1 697 17 633 2 57 884 87 891 50 575 178 50 753 22 182 2 531 1 958 1 127 27 798 2 284 22 953 1 493 26 730 105 281 39 647 147 39 794 19 997 1 414 1 074 1 027 23 512 5 595 17 925 1 065 24 585 87 891 Fair value of derivatives and borrowings The carrying value and fair value of the Group’s outstanding derivatives and borrowings are shown in the tables below. The fair values of bonds are based on level 1 and the fair values of derivatives and other loans are based on level 2 in the fair value hierarchy. Compared to 2013, no transfers have been made between different levels in the fair value hierarchy and no significant changes have been made to valuation techniques, inputs or assumptions. Outstanding derivative instruments recorded to fair value MSEK Dec. 31, 2014 Non-current assets and liabilities Assets 161 Liabilities 159 Current assets and liabilities Assets 166 Liabilities 496 Carrying value and fair value of borrowings MSEK Bonds Other loans Dec. 31, 2014 Carrying value 17 269 7 197 24 466 Dec. 31, 2013 188 24 250 243 Dec. 31, 2014 Fair value 18 800 7 351 26 151 Dec. 31, 2013 Carrying value 18 630 6 964 25 593 Dec. 31, 2013 Fair value 19 793 7 053 26 846 Atlas Copco – Q4 2014 13 (19) Consolidated statement of changes in equity MSEK Opening balance, January 1, 2014 Changes in equity for the period Total comprehensive income for the period Dividends Acquisition and divestment of own shares Share-based payments, equity settled Closing balance, December 31, 2014 MSEK Opening balance, January 1, 2013 Changes in equity for the period Total comprehensive income for the period Dividends Change of non-controlling interests Acquisition and divestment of own shares Share-based payments, equity settled Closing balance, December 31, 2013 Equity attributable to owners of the non-controlling parent interests 39 647 147 Total equity 39 794 16 806 -6 681 890 -87 32 -1 - 16 838 -6 682 890 -87 50 575 178 50 753 owners of the parent 34 131 Equity attributable to non-controlling interests 54 Total equity 34 185 12 229 -6 668 -2 24 -67 7 -1 87 - 12 236 -6 669 85 24 -67 39 647 147 39 794 Atlas Copco – Q4 2014 14 (19) Consolidated statement of cash flows MSEK Cash flows from operating activities Operating profit Depreciation, amortization and impairment (see below) Capital gain/loss and other non-cash items Operating cash surplus Net financial items received/paid Taxes paid Pension funding and payment of pension to employees Change in working capital Investments in rental equipment Sale of rental equipment Net cash from operating activities Cash flows from investing activities Investments in property, plant and equipment Sale of property, plant and equipment Investments in intangible assets Sale of intangible assets Acquisition of subsidiaries and associated companies Sale of subsidiaries Other investments, net Net cash from investing activities Cash flows from financing activities Dividends paid Dividends paid to non-controlling interest Acquisition of non-controlling interest Repurchase and sales of own shares Change in interest-bearing liabilities Net cash from financing activities Net cash flow for the period Cash and cash equivalents, beginning of the period Exchange differences in cash and cash equivalents Cash and cash equivalents, end of the period October - December 2014 2013 January - December 2014 2013 4 771 1 009 -73 5 707 102 -674 4 155 705 -550 4 310 -71 -1 348 17 015 3 709 -298 20 426 -849 -3 828 17 056 2 703 -554 19 205 -523 -4 622 -71 1 179 -339 115 6 019 -591 603 -347 113 2 669 -115 2 056 -1 719 416 16 387 -634 -538 -1 456 435 11 867 -521 18 -326 -35 -107 -971 -353 12 -299 1 -358 -57 -58 -1 112 -1 548 86 -1 187 10 -8 415 * 489 -10 565 -1 255 64 -1 009 12 -1 493 -56 -735 -4 472 262 -2 362 -2 100 -1 62 -440 -379 -6 681 -1 890 -8 566 -14 358 -6 668 -1 -3 24 4 113 -2 535 2 948 6 245 211 9 404 1 178 16 056 399 17 633 -8 536 17 633 307 9 404 4 860 12 416 357 17 633 *Part of the consideration for the acquisition of Henrob will be paid in 2015. In addition, a contingent consideration will, if certain criteria are met, be paid in 2015 or later. Depreciation, amortization and impairment Rental equipment Other property, plant and equipment Intangible assets Total 236 408 365 1 009 188 307 210 705 895 1 506 1 308 3 709 695 1 195 813 2 703 Calculation of operating cash flow MSEK Net cash flow for the period Add back: Change in pensions Change in interest-bearing liabilities Repurchase and sales of own shares Dividends paid Dividends paid to non-controlling interest Acquisition of non-controlling interest Acquisitions and divestments Investments of cash liquidity Operating cash flow October - December 2014 2013 2 948 1 178 January - December 2014 2013 -8 536 4 860 2 362 -262 35 5 083 8 566 -890 6 681 1 8 415 -368 13 869 591 440 -62 1 415 2 563 591 -4 113 -24 6 668 1 3 1 549 353 9 888 Atlas Copco – Q4 2014 15 (19) Revenues by business area, adjusted for the move of Specialty Rental division 2012 MSEK (by quarter) 2013 2014 Q1 Q2 Q3 Q4 Q1 Q2 Q3 Q4 Compressor Technique 7 858 8 182 8 078 8 607 7 383 8 037 7 816 8 546 9 409 10 353 10 718 11 685 Q1 - of which external 7 839 8 162 8 063 8 586 7 368 8 020 7 815 8 538 9 361 10 307 10 682 11 653 - of which internal 19 20 15 21 15 17 1 8 48 Q2 46 Q3 36 Q4 32 Industrial Technique 2 471 2 420 2 280 2 395 2 183 2 243 2 383 2 692 2 505 2 650 2 827 3 468 - of which external 2 464 2 414 2 271 2 387 2 177 2 233 2 374 2 679 2 493 2 636 2 816 3 454 - of which internal 7 6 9 8 6 10 9 13 12 14 11 14 Mining and Rock Excavation Technique 8 434 8 846 8 278 8 496 7 562 7 857 6 885 6 709 6 251 6 396 6 449 6 622 - of which external 8 418 8 807 8 265 8 508 7 545 7 851 6 882 6 704 6 237 6 373 6 398 6 618 - of which internal 16 39 13 -12 17 6 3 5 14 23 51 4 Construction Technique 3 593 4 156 3 557 3 352 3 173 3 850 3 495 3 449 3 354 4 068 3 692 3 625 - of which external 3 454 3 986 3 431 3 236 3 071 3 706 3 385 3 324 3 272 3 971 3 621 3 558 - of which internal 139 170 126 116 102 144 110 125 82 97 71 67 Common Group functions/ Eliminations Atlas Copco Group -102 -167 -99 -102 -74 -144 -27 -130 -96 -119 -96 -40 22 254 23 437 22 094 22 748 20 227 21 843 20 552 21 266 21 423 23 348 23 590 25 360 Operating profit by business area, adjusted for the move of Specialty Rental division 2012 MSEK (by quarter) 2013 2014 Q1 Q2 Q3 Q4 Q1 Q2 Q3 Q4 Q1 Q2 Q3 Q4 1 730 1 769 1 912 2 063 1 671 1 834 1 826 1 948 1 915 2 219 2 369 2 471 22.0 21.6 23.7 24.0 22.6 22.8 23.4 22.8 20.4 21.4 22.1 21.1 593 552 480 533 487 482 548 621 543 595 636 783 - as a percentage of revenues 24.0 22.8 21.1 22.3 22.3 21.5 23.0 23.1 21.7 22.5 22.5 22.6 Mining and Rock Excavation Technique - as a percentage of revenues 2 077 24.6 2 196 24.8 2 036 24.6 2 026 23.8 1 771 23.4 1 738 22.1 1 384 20.1 1 190 17.7 1 071 17.1 1 155 18.1 856 13.3 1 225 18.5 Compressor Technique - as a percentage of revenues Industrial Technique Construction Technique 426 621 479 299 384 511 454 384 406 545 422 395 11.9 14.9 13.5 8.9 12.1 13.3 13.0 11.1 12.1 13.4 11.4 10.9 -212 4 614 -110 5 028 18 4 925 -222 4 699 -157 4 156 -32 4 533 0 4 212 12 4 155 -175 3 760 -175 4 339 -138 4 145 -103 4 771 - as a percentage of revenues 20.7 21.5 22.3 20.7 20.5 20.8 20.5 19.5 17.6 18.6 17.6 18.8 Net financial items -120 -185 -188 -211 -111 -254 -195 -230 -158 -165 -266 -335 Profit before tax 4 494 4 843 4 737 4 488 4 045 4 279 4 017 3 925 3 602 4 174 3 879 4 436 20.2 20.7 21.4 19.7 20.0 19.6 19.5 18.5 16.8 17.9 16.4 17.5 SEK 2012 Q1 Q2 Q3 Q4 2013 Q1 Q2 Q3 Q4 2014 Q1 Q2 Q3 Q4 Basic earnings per share 2.81 2.98 2.87 2.81 2.46 2.58 2.52 2.39 2.27 2.64 2.37 2.74 Diluted earnings per share 2.80 2.97 2.86 2.81 2.45 2.56 2.51 2.38 2.27 2.64 2.36 2.73 26 24 25 28 30 28 30 33 35 33 37 42 1.18 1.56 3.79 3.49 1.35 2.72 1.97 1.63 1.62 2.39 3.22 4.18 - as a percentage of revenues Common Group functions/ Eliminations Operating profit - as a percentage of revenues Key figures by quarter Equity per share Operating cash flow per share % Return on capital employed, months value 12 37 39 37 36 34 32 30 28 26 25 25 24 Return on equity, 12 months value 49 52 48 46 42 40 37 34 32 31 30 28 Debt/equity ratio, period end 43 62 40 27 23 37 27 19 37 51 44 30 Equity/assets ratio, period end 38 37 39 42 42 39 42 45 45 43 45 48 Number of employees, period end 38 623 39 332 39 921 39 811 40 344 40 369 40 116 40 241 43 846 43 937 44 243 44 056 Atlas Copco – Q4 2014 16 (19) Acquisitions Revenues MSEK* 35 1 063 162 Date 2014 Dec 31. 2014 Sep. 10 2014 Sep. 3 2014 May 5 Number of employees* 14 400 120 120 Acquisitions Business area Titan Technologies International Inc. Industrial Technique Henrob Industrial Technique Ash Air (NZ) Ltd. and Fox Air NZ Ltd. Compressor Technique National Pump & Compressor Ltd. & Compressor Technique McKenzie Compressed Air Inc., Distributor USA 2014 Feb. 3 Geawelltech Mining & Rock Excavation Tech. 90 19 2014 Jan. 9 Edwards Group Compressor Technique 6 950 3 400 2013 Nov. 22 Tentec Ltd Industrial Technique 105 65 2013 Oct. 17 Archer Underbalanced Services Mining & Rock Excavation Tech. 230 75 2013 Oct. 14 Synatec Industrial Technique 105 120 2013 Sep. 10 Pneumatic Holdings Construction Technique 73 16 2013 Sep. 9 Dost Kompresör, Distributor Turkey Compressor Technique 16 2013 May 3 National Pump & Compressor, Compressor Technique 45 Distributor USA 2013 May 2 Saltus-Werk Max Forst Industrial Technique 70 65 2013 Apr. 23 Rapid-Torc Industrial Technique 75 30 2013 Apr. 3 MEYCO Mining & Rock Excavation Tech. 190 45 2013 Mar. 5 Shandong Rock Drilling Tools Co., Ltd Mining & Rock Excavation Tech. 420 687 2013 Feb. 28 Air et Techniques Energies Provence Compressor Technique 30 Distributor France *Annual revenues and number of employees at time of acquisition. No revenues are disclosed for former Atlas Copco distributors. For disclosure as per IFRS 3 for the Edwards acquisition, see below. For the other acquisitions made in 2014, disclosure as per IFRS 3 will be given in the annual report 2014. See the annual report for 2013 for disclosure of acquisitions made in 2013. Atlas Copco acquires Edwards, expanding into process vacuum solutions On January 9, 2014, the acquisition of Edwards, a leading The final purchase price allocation is summarized below. global supplier of vacuum and abatement solutions, was completed. MSEK Contribution from date of control, MSEK Revenues Operating profit - as a percentage of revenues Amortization of intangible assets 8 535 1 555 18.2 223 The operating profit 2014 was negatively affected by MSEK 50 related to a one-time acquisition accounting adjustment for currency derivatives entered by Edwards prior to the acquisition. In 2013, Edwards had revenues of approximately MGBP 680 (MSEK 6 950), and an adjusted EBITDA approximately MGBP 160 (MSEK 1 640). Intangible assets Property, plant and equipment Other assets Cash and cash equivalents Interest-bearing loans and borrowings Other liabilities and provisions Net identifiable assets Goodwill Total consideration Cash and cash equivalents acquired Net cash outflow 3 933 1 252 2 489 917 -3 300 -2 631 2 660 5 118 7 778 -917 6 861 Atlas Copco – Q4 2014 17 (19) Parent company Income statement MSEK Administrative expenses Other operating income and expenses Operating profit/loss Financial income and expenses Appropriations Profit/loss before tax Income tax Profit/loss for the period October - December 2014 2013 -135 -78 80 37 -55 -41 351 3 351 3 860 5 070 4 156 8 380 -818 -1 020 3 338 7 360 January - December 2014 2013 -464 -379 186 337 -278 -42 1 007 9 102 3 860 5 070 4 589 14 130 -797 -855 3 792 13 275 Balance sheet MSEK Total non-current assets Total current assets TOTAL ASSETS Dec. 31 2014 94 316 8 462 102 778 Dec. 31 2013 93 770 20 126 113 896 Total restricted equity Total non-restricted equity TOTAL EQUITY Total provisions Total non-current liabilities Total current liabilities TOTAL EQUITY AND LIABILITIES Assets pledged Contingent liabilities 5 785 37 515 43 300 353 48 510 10 615 102 778 502 9 579 5 785 41 194 46 979 797 39 456 26 664 113 896 198 7 570 Accounting principles Atlas Copco AB is the ultimate Parent Company of the Atlas Copco Group. The financial statements of Atlas Copco AB have been prepared in accordance with the Swedish Annual Accounts Act and the accounting standard RFR 2, Accounting for Legal Entities. The same accounting principles and methods of computation are followed in the interim financial statements as compared with the most recent annual financial statements. See also accounting principles, page 9. Atlas Copco – Q4 2014 18 (19) Parent Company Distribution of shares Share capital equaled MSEK 786 (786) at the end of the period, distributed as follows: Class of share A shares B shares Total - of which A shares held by Atlas Copco - of which B shares held by Atlas Copco Total shares outstanding, net of shares held by Atlas Copco Shares 839 394 096 390 219 008 1 229 613 104 11 111 707 501 379 1 218 000 018 Personnel stock option program The Annual General Meeting 2014 approved a performancebased long-term incentive program. For Group Executive Management, the plan requires management’s own investment in Atlas Copco shares. The intention is to cover Atlas Copco’s obligation under the plan through the repurchase of the company’s own shares. For further information, see www.atlascopco.com/agm. The sale of a maximum 8 800 000 series A and B shares currently held by the company, for the purpose of covering costs of fulfilling obligations related to the performance stock option plans 2009, 2010 and 2011. The shares may only be purchased or sold on NASDAQ Stockholm at a price within the registered price interval at any given time. During 2014, 4 303 105 series A shares and 144 000 series B shares were divested. These transactions are in accordance with mandates granted. The company’s holding of own shares on December 31, 2014 appears in the table to the left. Risks and factors of uncertainty Financial risks Atlas Copco is subject to currency risks, interest rate risks and other financial risks. In line with the overall goals with respect to growth, return on capital, and protecting creditors, Atlas Copco has adopted a policy to control the financial risks to which Atlas Copco AB and the Group is exposed. A financial risk management committee meets regularly to manage and follow up financial risks, in line with the policy. For further information, see the 2013 annual report. Transactions in own shares Atlas Copco has mandates to purchase and sell own shares as per below: The purchase of not more than 4 800 000 series A shares, whereof a maximum of 3 500 000 may be transferred to personnel stock option holders under the Performance Stock Option Plan 2014. The purchase of not more than 70 000 series A shares, later to be sold on the market in connection with payment to Board members who have opted to receive synthetic shares as part of their board fee. The sale of not more than 55 000 series A shares to cover costs related to previously issued synthetic shares to Board members. Related parties There have been no significant changes in the relationships or transactions with related parties for the Group or Parent Company compared with the information given in the annual report 2013. Atlas Copco – Q4 2014 This is Atlas Copco Atlas Copco is a world-leading provider of sustainable productivity solutions. The Group serves customers with innovative compressors, vacuum solutions and air treatment systems, construction and mining equipment, power tools and assembly systems. Atlas Copco develops products and service focused on productivity, energy efficiency, safety and ergonomics. The company was founded in 1873, is based in Stockholm, Sweden, and has a global reach spanning more than 180 countries. In 2014, Atlas Copco had revenues of BSEK 94 (BEUR 10.3) and more than 44 000 employees. Business areas Atlas Copco has four business areas. The business areas are responsible for developing their respective operations by implementing and following up on strategies and objectives to achieve sustainable, profitable development. The Compressor Technique business area provides industrial compressors, vacuum solutions, gas and process compressors and expanders, air and gas treatment equipment and air management systems. The business area has a global service network and innovates for sustainable productivity in the manufacturing, oil and gas, and process industries. Principal product development and manufacturing units are located in Belgium, Germany, the United States, China and India. The Industrial Technique business area provides industrial power tools, assembly systems, quality assurance products, software and service through a global network. The business area innovates for sustainable productivity for customers in the automotive and aerospace industries, industrial manufacturing and maintenance, and in vehicle service. Principal product development and manufacturing units are located in Sweden, France and Japan. The Mining and Rock Excavation Technique business area provides equipment for drilling and rock excavation, a complete range of related consumables and service through a global network. The business area innovates for sustainable productivity in surface and underground mining, infrastructure, civil works, well drilling and geotechnical applications. Principal product development and manufacturing units are located in Sweden, the United States, Canada, China and India. The Construction Technique business area provides construction and demolition tools, portable compressors, pumps and generators, lighting towers, and compaction and paving equipment. The business area offers specialty rental and provides service through a global network. Construction Technique innovates for sustainable productivity in infrastructure, civil works, oil and gas, energy, drilling and road construction projects. Principal product development and manufacturing units are located in Belgium, Germany, Sweden, the United States, China, India and Brazil. 19 (19) Vision, mission and strategy The Atlas Copco Group’s vision is to become and remain First in Mind—First in Choice® of its customers and other principal stakeholders. The mission is to achieve sustainable, profitable development. Sustainability plays an important role in Atlas Copco’s vision and it is an integral aspect of the Group’s mission. An integrated sustainability strategy, backed by ambitious goals, helps the company deliver greater value to all its stakeholders in a way that is economically, environmentally and socially responsible. See the annual report 2013 for a summary of all Group goals and for more information. For further information Analysts and investors Mattias Olsson, Vice President Investor Relations Phone: +46 8 743 8295 or +46 72 729 8295 Karin von Matern, IR Officer Phone: +46 8 743 8291 or +46 70 149 8291 [email protected] Media Ola Kinnander, Media Relations Manager Phone: +46 8 743 8060 or +46 70 347 2455 [email protected] Conference call A conference call for investors, analysts and media will be held on January 29 at 3.00 PM CET. The dial-in numbers are: United Kingdom +44 203 428 1400 Sweden +46 8 5664 2695 United States +1 646 502 5119 The conference call will be broadcasted live via the Internet. Please see the Investor Relations section of our website for the link and presentation material: www.atlascopco.com/ir The webcast and a recorded audio presentation will be available on our homepage following the call. Report on Q1 2015 The report on Q1 2015 will be published on April 28, 2015. Annual General Meeting The Annual General Meeting for Atlas Copco AB will be held April 28, 2015 at 4 p.m. in Aula Magna, Stockholm University, Frescativägen 6, Stockholm, Sweden.
© Copyright 2026