
FC Stone Afternoon Market Recap
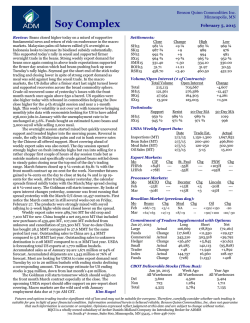
FCStone Grain Recap
January 30, 2015
CORN:
Values spent most of the session in the negative but rallied again into the close on heavy volume
to cut the loss to only 1.5 cents on the front month. There is still lots of debate about the acreage
mix for the coming year and the debate is whether these values are low enough for the moment.
High volume closes that buy up the market may discourage much more selling as the feeling in
the market may be geared to at least a dead cat bounce. I still believe the market is factoring in a
90 mln acre planted number for US corn but that is only 2.2% different than the 88 perceived a
month or so ago. Funds sold 3000 corn today.
SOYBEANS:
Values broke at the open and remained weak all session. Robust production in South America
weighs on the market. The grain analyst Safras & Mercado took their production estimate down
to 95 mmt for Brazil but that still 8 mmt better than last year. The USDA rests at 95.5 mmt. Goias
and Southern MG remain the troubled spots for soy production. The BA Exchange now estimates
the Argentina soy production at 54.5 which is just under the USDA at 55 mmt and just above last
year’s 54 mmt production. Production must rise in the Western Hemisphere to meet the increase
of 7 mmt of demand growth per year for its soy production. A recent update in three country
disposals show the pace has not deviated though the production growth projections will raise
stocks in the western hemisphere high enough to justify up to $1.00 downside in the market. The
better predictor of proper US soy values is now delineated in Brazilian currency as SA dominates
production. Those models point to a 3+ Real drop per bu from current levels.
When it comes to soy demand one has to consider the biodiesel industries of the US, Brazil and
Argentina. Brazil and Argentina have been pressing forward to higher and higher production
levels. Brazil has between 58 and 65 active biodiesel plants which are currently operating at
nearly half of their capacity and they are putting out 2/3 of the production the US is currently
producing with 93 plants. Argentina is currently putting out just under half the amount of biodiesel
production the US is annually at 2800 mln liters. Brazil production is growing about 20% per year
as the industry is ramping up for a 7% blend rate requirement. The demand for biodiesel is
growing fast enough that there is little if any exports of biodiesel from Brazil and the country has a
14% tariff on biodiesel imports. Argentina is geared differently. Its demand has grown greatly
but its market and tax structure is geared towards export with Arg exporting more than half of its
production as seen in the graph below. Currently there is some profitability barriers to exporting
much biodiesel from Arg to the US but the EPA’s allowances will allow more biodiesel to flow in
the future.
---------------------------------------------------------------------------------------------------------------------------------This material should be construed as market commentary, merely observing economic, political and/or market conditions, and not intended to
refer to any particular trading strategy, promotional element or quality of service provided by FCStone, LLC. FCStone, LLC is not responsible for any
redistribution of this material by third parties, or any trading decisions taken by persons not intended to view this material. Information contained herein was
obtained from sources believed to be reliable, but is not guaranteed as to its accuracy. Contact FCStone designated personnel for specific trading advice to
meet your trading preferences. These materials represent the opinions and viewpoints of the author, and do not necessarily reflect the viewpoints and trading
strategies employed by FCStone, LLC.
www.intlfcstone.com
515-223-3788
FCStone Grain Recap
January 30, 2015
Page 2
www.intlfcstone.com
515-223-3788
FCStone Grain Recap
January 30, 2015
Palm oil will be a factor in biodiesel production as “mineral oils” have fallen so has the probability
that Indonesia will be a great producer of biodiesel. Competing cheaper crude oil will edge out
the more expensive Palm oil unless the government plans on pledging the treasury to fight
economic forces. Palm oil will also switch over to finding food sources and increase its discount
to soy oil and edge out soy oil in the food oils balance table.
Funds sold 6000 soybeans, 4000 meal, and bought 4000 soy oil today. Crude oil rallies 3 dollars
in the final minutes of trade as a late report showed the number of drilling operations had dropped
significantly.
WHEAT:
Values finished on the weak side again with a short dip below the psychological support of 500
WH15 during the day. Weather seems to be cooperating in the Midwest for wheat. Despite a
projected cold blast in the coming week a 4-8 inch snow is out ahead of it which should buffer
winterkill. The system keeps shifting around even 48 hours ahead of the arrival time the weather
agencies don’t know how far north or south it will hit. As I did in yesterday’s corn and soybean
section I broke down my best estimate of how the all wheat demand will work out in the coming
year. I have placed my best current estimate up against the CBO’s baseline table and then one
alternate outcome that uses a lower abandonment rate and better yield.
US Wheat 15-16
FCStone Baseline
Alt
Planted
Harvested
55
45.1
55.5
47
55.5
48
Yield
45.4
45.5
47
Carryin
Production
Available
687
2048
2885
654
2139
2943
687
2256
3093
Food
Seed
Feed
Exports
Total Use
960
74
216
925
2175
967
75
200
950
2192
960
75
250
925
2210
Carryout
710
751
883
Page 3
www.intlfcstone.com
515-223-3788
FCStone Grain Recap
January 30, 2015
My current feed number is higher than the CBO’s figure but not unjustified by the WN15-CN15
spread vs historical usage models. The alternative outcome uses a 250 feed usage figure which is
high because the production number would be higher and I believe the competitive world export
market would force more feeding domestically to keep the carryout down under 900.
The attaché to Australia lowered his wheat production estimate to 23.2 mmt and an export figure
to 18.1 which is different than the USDA’s 24 mmt and 17.5 mmt figures. Dryness in Queensland,
NSW and Victoria were mostly cited as the reason for the decline in production.
Funds sold 4000 wheat in the CME today. New adjustments from the CFTC to Managed money
positions show they are shorter than previously thought with our new estimate of their position
standing at 22k short.
ECBOT
HIGH
LOW
CLOSE
CHANGE
Mar Corn
May Corn
3.73
3.81
3.6575
3.7375
3.70
3.785
- 1 1/2
- 1 1/2
Mar Beans
May Beans
9.7275
9.79
9.55
9.6175
9.61
9.6775
- 7 1/4
-7
Mar wheat
5.1175
4.97
5.0275
-5
Regards
Bevan Everett
Page 4
www.intlfcstone.com
515-223-3788


© Copyright 2026