
Jan 28, 2015 - Moneycontrol
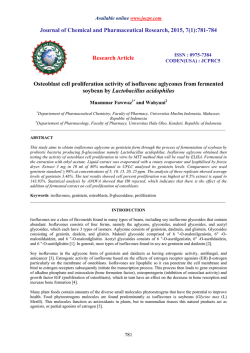
ADMISI Commodity Research
January 28, 2015
Contents
Tushar Rathod: [email protected]
(Click on the topics)
1. Recap
2. Physical Market Rates
3. Arrivals
4. Weather
5. Charts and Outlook
6. Disclaimer
1
ADMISI Commodity Research
January 28, 2015
Tushar Rathod: [email protected]
Recap
Indian markets
NCDEX
Previous Close
Soybean
FEB5
3334
3356
APR5
3358
3383
JUN5
3374
3406
AUG5
3388
3400
Net Total Change in OI =
Open
High
Low
3350
3355
3367
3371
-3650
3388
3398
3414
3440
3292
3314
3337
3310
Spread
Feb-2015
Apr-2015
Jun-2015
NCDEX
Previous Close
Soy Oil
FEB5
616.2
623.15
APR5
591.1
593.05
JUN5
572.25
566.05
AUG5
572.85
563.4
Net Total Change in OI =
High
Low
611.2
585.45
568
568
3665
626
596
569
568
609
583.2
562.5
562.8
•
•
Feb-2015
High
Low
3340
3383
3416
3466
-2090
3397
3434
3468
3510
3325
3364
3405
3453
Apr-2015
% Chg.
Volume
0.66
0.74
0.95
0.35
51460
31100
10310
450
Jun-2015
-50
-23
Net
Chg.
6.95
1.95
-6.2
-9.45
Apr-2015
30.10
Open
Spread
Apr-2015
May-2015
Jun-2015
•
•
Apr-2015
-27
Open
Spread
Feb-2015
Apr-2015
Jun-2015
NCDEX RM
Previous Close
Seed
APR5
3377
3388
MAY5
3411
3428
JUN5
3449
3430
JUL5
3504
3471
Net Total Change in OI =
Feb-2015
Net
Chg.
22
25
32
12
May-2015
-40
Net
Chg.
11
17
-19
-33
Volume
1.13
0.33
-1.08
-1.65
65145
21165
16225
3200
66660
41430
18100
1730
OI
Chg.
-4510
-1560
2560
-140
% Vol.
Chg.
29.91
35.33
83.02
-42.91
OI
64130
63455
59075
15340
OI
Chg.
-5360
3695
4475
855
Aug-2015
59.75
29.65
2.65
% Chg.
Volume
0.33
0.50
-0.55
-0.94
33180
7120
1690
670
Jun-2015
-42
-2
OI
Aug-2015
-44
-17
6
% Chg.
Jun-2015
57.10
27.00
% Vol.
Chg.
30.41
28.67
46.45
-4.26
% Vol.
Chg.
-15.59
19.46
39.67
235.00
OI
31010
5410
2380
420
OI
Chg.
-2250
-380
430
110
Jul-2015
-83
-43
-41
Indian oilseed complex prices closed firmer yesterday after the recent losses. Rupee ended higher.
According to reports, Indian Soy meal exports in 2014-15 could hit its lowest level since 1988-89 at
800,000 MT due to higher global Soy supplies.
Traders estimate this year’s Soybean crop between 9 – 10 million MT. USDA estimates Indian
Soybean crop at 11.0 million MT. COOIT expects Indian Soy crop at 9.17 million MT.
Indian RM Seed output in 2014-15 may be 7.0 million MT vs. 7.4 million MT in the previous year.
2
ADMISI Commodity Research
January 28, 2015
•
•
•
•
Tushar Rathod: [email protected]
Latest sowing data shows, RM Seed was sowed in 6.49 million hectares across India vs. 7.04
million hectares in the corresponding period in the previous year.
According to 1st Advance estimates for 2014-15 released by GoI, India’s output for Soybean is
estimated at 11.82 million MT.
Soy meal exports from India rose to 193,832 MT in December from 110,806 MT in November.
India's oil meal exports in December 2014 were 389K MT vs. 188K MT in previous month.
Veg. oil imports in December 2014 were at 1.12 million MT vs. 1.05 million MT in Dec 2013.
Soybean - Akola
Soybean - Indore
Soybean - Kota
Soybean - Vidisha
TOTAL SOYBEAN
NCDEX Warehouse Inventory
23-Jan-15
731
3524
140
170
4565
26-Jan-15
731
3300
140
170
4341
10
1757
6172
128
8067
10
1757
6172
128
8067
RM Seed - Alwar
RM Seed - Jaipur
RM Seed - Kota
RM Seed - Sri Ganganagar
TOTAL RM Seed
Date
27-Jan-15
27-Jan-15
27-Jan-15
27-Jan-15
27-Jan-15
27-Jan-15
27-Jan-15
27-Jan-15
27-Jan-15
27-Jan-15
India Physical Market Rates
Commodity
Soybean - Indore - NCDEX
Soybean - Kota - NCDEX
Refined Soy oil - Indore - NCDEX
Refined Soy oil - Mumbai - NCDEX
Refined Soy oil - Nagpur - NCDEX
Soybean meal Export - Kandla - NCDEX
Soybean meal - Indore - NCDEX
Soy meal Export Kandla FAS - SEA
Mustard meal Export Kandla FAS - SEA
Mustard oil - Sri Ganganagar - NCDEX
Rate
3295.00
3177.95
639.55
620.00
637.00
28450.00
28000.00
455.00
275.00
725.00
Units
Rs. / 100 Kg
Rs. / 100 Kg
Rs. / 10 Kg
Rs. / 10 Kg
Rs. / 10 Kg
Rs. / MT
Rs. / MT
USD / MT
USD / MT
Rs. / 10 Kg
3
ADMISI Commodity Research
January 28, 2015
International
•
•
•
•
•
Tushar Rathod: [email protected]
CBOT Soybean
Previous
Close
Open
High
Low
MAR5
MAY5
JUL5
AUG5
SEP5
983.5
990.25
996
996.25
982.75
973.75
981.25
987
987.25
973.5
982.25
989.75
995
993.75
983.25
985.5
992.5
998.25
997.75
983.75
972.25
979
985.25
985.75
971.25
CBOT Soy Meal
Previous
Close
Open
High
Low
MAR5
MAY5
JUL5
AUG5
SEP5
338.9
331.6
329.8
328.9
327.4
336.6
328.8
326.5
325.3
323.8
338.9
331.6
329.4
328
328.3
342.6
335.1
333.1
330.3
328.8
335
327.2
325.3
324.3
323
Net
Chg.
-9.75
-9.00
-9.00
-9.00
-9.25
Net
Chg.
-2.3
-2.8
-3.3
-3.6
-3.6
% Chg.
-1.00
-0.92
-0.91
-0.91
-0.95
% Chg.
-0.68
-0.85
-1.01
-1.11
-1.11
CBOT Soy Oil
Previous
Close
Open
High
Low
Net
Chg.
% Chg.
MAR5
MAY5
JUL5
AUG5
SEP5
31.08
31.28
31.48
31.52
31.54
31.17
31.37
31.57
31.6
31.6
31.06
31.27
31.5
31.54
31.57
31.29
31.49
31.7
31.71
31.71
30.87
31.07
31.28
31.34
31.34
0.09
0.09
0.09
0.08
0.06
0.29
0.29
0.29
0.25
0.19
CBOT Soy complex prices closed mixed yesterday with bean and meal moving lower on Chinese
cancellations.
USDA confirmed that private exporters cancelled sales of 120,000 MT of Soybeans to China for
delivery in 2014/15. USDA said exporters also reported fresh sales of 111,000 MT of Soybeans to
unknown destinations.
USDA's announcement marked the third cancellation this month of Soybean sales to top buyer
China. The moves reflect a seasonal shift in the focus of the export market from the United States
to South America, where the Soy harvest is getting started.
According to CFTC CoT report, for the week ending 20 January, non commercial traders
decreased their net long positions in CBOT Soybeans.
ICE Canola prices closed lower yesterday.
4
ADMISI Commodity Research
January 28, 2015
Tushar Rathod: [email protected]
Physical Market Rates
Date
28-Jan-15
28-Jan-15
27-Jan-15
28-Jan-15
Physical Market Rates - Soybean
Commodity
Brazil Soybean January - FOB Paranagua
Argentina Soybean May - FOB Up River
China Imported Soybean Dalian
USA Soybean January - FOB Gulf
Date
28-Jan-15
28-Jan-15
27-Jan-15
Physical Market Rates - Soy meal
Commodity
Brazil Soy meal January - FOB Paranagua
Argentina Soy meal February - FOB Up River
China HQ Soy meal Dalian
Date
28-Jan-15
28-Jan-15
27-Jan-15
27-Jan-15
Physical Market Rates - Soy Oil
Commodity
Brazil Soy Oil February - FOB Paranagua
Argentina Soy Oil February - FOB Up River
China Standard Soy Oil Dalian
India Soy Oil Degummed CIF Mumbai
Rate
404.04
373.62
3300.00
393.70
Rate
383.50
423.39
3180.00
Rate
735.70
736.79
5500.00
827.00
Units
$ / MT
$ / MT
CNY / MT
$ / MT
Units
$ / MT
$ / MT
CNY / MT
Units
$ / MT
$ / MT
CNY / MT
$ / MT
5
ADMISI Commodity Research
January 28, 2015
Tushar Rathod: [email protected]
Arrivals
6
ADMISI Commodity Research
January 28, 2015
Tushar Rathod: [email protected]
IMD
7
ADMISI Commodity Research
January 28, 2015
Tushar Rathod: [email protected]
Charts & Outlook
NCDEX Charts
Source: - Reuters
NCDEX Soybean April (3383.00)
Trade Recommendation: - Sell below 3395, S/L 3435, TGT 3331 - 3285.
Source: - Reuters
NCDEX Soy Oil April (591.10)
Trade Recommendation: - Sell in the range 595 - 597, S/L 600.50, TGT 588 - 581.
8
ADMISI Commodity Research
January 28, 2015
Tushar Rathod: [email protected]
Source: - Reuters
NCDEX RM Seed April (3388.00)
Trade Recommendation: - None.
NCDEX Outlook: - Rupee is trading weaker. Downside towards 3300/580 levels may be seen in
Soybean/Soy oil with resistance at 3400/600 levels. RM Seed prices may move lower towards 3300 levels.
CBOT Charts
Source: - Reuters
CBOT Soybean March (974.75)
Trade Recommendation: - None.
9
ADMISI Commodity Research
January 28, 2015
Tushar Rathod: [email protected]
Source: - Reuters
CBOT Soy meal March (337.70)
Trade Recommendation: - None.
Source: - Reuters
CBOT Soy Oil March (30.91)
Trade Recommendation: - None.
Outlook: - Ideas of new supplies from S. America amid China cancellations are bearish. Soy complex
prices may move lower towards 960/315/30.00 levels. Resistance is at 1000/350 levels for Soybean/ Soy
meal.
10
ADMISI Commodity Research
January 28, 2015
Tushar Rathod: [email protected]
DISCLAIMER:
This document is not for public distribution and has been furnished to you solely for your information and must not be reproduced or
redistributed to any other person. Persons into whose possession this document may come are required to observe these restrictions.
This material is for the personal information of the authorized recipient, and we are not soliciting any action based upon it. This report
is not to be construed as an offer to sell or the solicitation of an offer to buy any commodity or commodity derivative in any
jurisdiction where such an offer or solicitation would be illegal. It is for the general information of clients of ADMISI Commodities
Private Limited. It does not constitute a personal recommendation or take into account the particular investment objectives, financial
situations, or needs of individual clients. We have reviewed the report, and in so far as it includes current or historical information, it
is believed to be reliable though its accuracy or completeness cannot be guaranteed. Neither Archer Daniels Midland Company
(ADM), nor ADMISI Commodities Private Limited, nor any person/entity connected with it, accepts any liability arising from the
use of this document. The recipients of this material should rely on their own investigations and take their own professional advice.
Price and value of the investments referred to in this material may go up or down. Past performance is not a guide for future
performance. Certain transactions -including those involving futures, options and other derivatives as well as non-investment grade
securities - involve substantial risk and are not suitable for all investors. Reports based on technical analysis centers on studying charts
of a stock's price movement and trading volume, as opposed to focusing on a commodity’s fundamentals and as such, may not match
with a report on a commodity's fundamentals. Opinions expressed are our current opinions as of the date appearing on this material
only. While we endeavor to update on a reasonable basis the information discussed in this material, there may be regulatory,
compliance, or other reasons that prevent us from doing so. Prospective investors and others are cautioned that any forward-looking
statements are not predictions and may be subject to change without notice. Our investment businesses may make investment
decisions that are inconsistent with the recommendations expressed herein. No part of this material may be duplicated in any form
and/or redistributed without ADMISI Commodities Private Limited prior written consent.
11

© Copyright 2026