
Genomics and Applied Biology
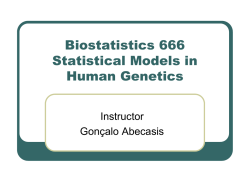
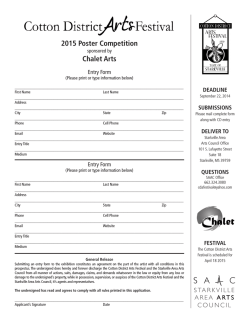
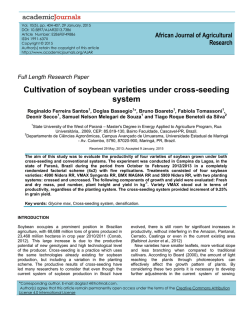
Genomics and Applied Biology 2013, Vol.4, No.4, 22-34
http://gab.sophiapublisher.com
Research Report Open Access Relationship Between SSR-Based Molecular Marker and Cotton F1 Inter
Specific Hybrids Performance for Seed Cotton Yield and Fiber Properties
Yanal A. Alkuddsi , S.S. Patil , S.M. Manjula , H.L Nadaf , B.C. Patil
Agricultural Research Station, University of Agricultural Sciences, Dharwad- 580005, Karnataka, India
Corresponding Author email: [email protected];
Author
Genomics Appied Biology, 2013, Vol.4, No.4 doi: 10.5376/gab.2013.04.0004
Copyright © 2013 Alkuddsi et al. This is an open access article published under the terms of the Creative Commons Attribution License, which permits unrestricted
use, distribution, and reproduction in any medium, provided the original work is properly cited.
Abstract Knowledge of genetic diversity and relationships among breeding materials has a significant impact on crop improvement.
Keywords Gossypium hirsutum; Gossypium barbadense; SSR marker; Genetic distance (GD)
Preferred citation for this article:
Alkuddsi et al., 2013, Relationship Between SSR-Based Molecular Marker and Cotton F1 Inter Specific Hybrids Performance for Seed Cotton Yield and
Fiber Properties, Genomics and Applied Biology, Vol.4, No.4 22-34 (doi: 10.5376/gab.2013.04.0004)
Received: 29 Jun., 2013
| Accepted: 16 Jul., 2013
| Published: 29 Oct., 2013
Genomics and Applied Biology
Association between parental divergence and progeny performance has not been well documented in cotton (Gossypium hirsutum L.).
The objectives of this study were to estimate genetic diversity among selected cotton genotypes on the basis of simple sequence
repeat (SSR) markers, and to investigate the relationship between genetic diversity and F1 population performance and heterosis.The
present study was conducted to investigate the relationship between parents molecular marker diversity and interspecific hybrids of
cotton to evaluate the hybrid performance and heterosis using molecular markers. Twenty eight F4 lines of (Gossypium barbadense L.)
were crossed with the four common diverse testers (Gossypium hirsutum L.) viz., DH 98-27 (T1), ZCH8 (T2), 178-24 (T3) and DH
18-31 (T4) to produce 112 F1 inter specific hybrids during 2010. These 112 F1 hybrids, their F5 barbadense lines with 4 hirsutum
testers and ruling commercial check (MRC6918 and DCH32) were evaluated for yield and fiber quality traits and sown during kharif
2011 at University of Agricultural Sciences, Dharwad, India. Genetic distances (GD) among the parents were calculated from 40
microsatellite marker data, and their correlation with hybrid performance and heterosis were analysed. The dendrogram constructed
from the pooled data revealed three distinct clusters. One cluster involved testers and other clusters showed all lines were placed
which are already having proven record in giving good hybrids. The similarity coefficient values between the line DB 533 × DB 534
F4 IPS 49 and the tester DH 98-27 showed 67%. It revealed that DB 533 × DB 534 F4 IPS 49 was closely related to DH 98-27 with
67% similarity between parents. The hybrid between DB 533 x DB 534 F4 IPS 49 and DH 98-27 exhibited the highest yield of
2884.26 kg/ha. Similarity coefficient (88%) value between lines and testers showed between the line DB 533 × DB 534 F4 IPS 52
and the tester ZCH8, the hybrid between these recorded an yield of 2 040.757 kg/ha. Lowest similarity coefficient value was noticed
between the line DB 533 × DB 534 F4 IPS 16 and tester DH 98-27 which revealed that they are far distinct from each other. This
combination exhibited 2384.62 kg/ha yield. Genetic distance (GD) ranged from 0.041 to 0.429, with an average of 0.183. The result
implied that each cluster dendrogram substantially reflected its own genetic relationship among parents. Overall, a low significant
correlation of GD with hybrid performance and heterosis was detected in Table 2. Highly significant positive correlation were found
between genetic distance (GD) and ginning outturn for F1 performance (0.277) and heterosis over MRC 6918 (0.279) and DCH 32
(0.279), while significant positive correlation were found between genetic distance (GD) and ginning outturn for mid parent heterosis
(0.237). Highly significant positive correlation were found between genetic distance (GD) and seed cotton yield for F1 performance
(0.359) and heterosis over Bt check MRC 6918 (0.336) and over non Bt check DCH 32 (0.362), while significant positive correlation
were found between genetic distance (GD) and seed cotton yield for mid parent heterosis (0.226). Significant positive correlation
were found between genetic distance (GD) and lint index for mid parent heterosis (0.227), F1 performance (0.251) and heterosis over
MRC 6918 (0.250) and DCH 32 (0.250), while significant positive correlation were found only between genetic distance (GD) and
fiber micronaire value for F1 performance (0.241).
23
Genomics and Applied Biology
Introduction
Cotton (Gossypium L.) is a leading fiber crop in the
world. Although the genus Gossypium L. has
approximately 50 species, only four of them are
cultivated, which include two diploids (2n = 2x = 26):
G. arboretum L. (A2A2) and G. herbaceum L. (A1A1),
as well as two allotetraploids (2n = 4x = 52): G.
Hirsutum L. (AADD) and G. barbadense L. (AADD).
It was believed that the tetraploid cotton was
originated from an interspecific hybridization of an
old world diploid species that was closely related with
G. arboreum or G. herbaceum (A genome donor) and a
new world diploid species relative to G. raimondii
Ulbrich or G. gossipioides Standley (D genome donor),
which occurred about 1~2 million years ago (Beasley,
1940).
Genomics and Applied Biology
Use of heterosis in cotton production might be one of
the key approaches to increase seed cotton yield.
Heterosis for yield in F1 hybrids cotton has been
extensively analyzed in the past decades. Useful
heterosis for yield in F1 hybrids during 1947 and 1972
ranged from 7% to 50% in interspecific hybrids and
from 10% to 138% in intraspecific hybrids (Davis,
1978). In any hybrid programme, a large number of
crosses need to be made, while only few of the
hybrids will show good performance over the standard
check. This process is extremely labour intensive,
time-consuming and tedious. Molecular markers
increasingly detect locus differences among genotypes
and represent a powerful tool for the assessment of
genetic diversity in plant species (Tanksley, 1983).
Selection of desirable parents is an important task to
initiate a hybrid-breeding programme. Because
heterosis is associated with the interaction of different
alleles at a locus (Jones, 1945), it has been suggested
that molecular marker diversity may be used to select
parents for hybridization.
In cotton, a number of efforts have been made to
investigate the relationship between DNA markerbased genotype variation of the parents to be used in a
hybrid- breeding programme and heterosis with
varying results. For example, Diers et al. (1996)
reported that marker- based genetic distance was not
consistently correlated with heterosis for inbred
diallels and for cultivar diallels in rape seed. Sheng et
al. (2002) reported significant correlation between
genetic distance and seed yield but the determinative
coefficient was very low (0.1024). However, Riaz et al.
(2001) found that the genetic distance of
sequence-related amplified polymorphism (SRAP) in
American. B. napus inbred lines was significantly
correlated with hybrid yield performance and heterosis.
Meredith and Brown (1998) studied the relationship
between genetic distance estimated by restriction
fragment length polymorphic (RFLP) markers among
15 cultivars and one strain from the USA and yield
heterosis of 120 F2 hybrids produced by a half _
diallel genetic design and found that the correlation
were very low (r=0.08). Wu et al. (2002) studied the
correlation between genetic distance measured by
random amplified polymorphic DNAs (RAPD), inter
simple sequence repeat (ISSR) and simple sequence
repeat (SSR) markers among six domestic and two
exotic cultivars and interspecific F1 and F2 hybrids,
and found the correlation between these was low.
Gutierrez et al. (2002) used five US, four Australian
cultivars and two day- neutral converted lines of
G.hirsutum to analysis the association between genetic
distance based on SSR markers and performance of
agronomic and fiber traits of F2-bulk populations and
deduced that significant correlations ranged from
negative to positive depending on the traits, genetic
background and environment.
Zhang et al. (2007) studied the relationship between
parental molecular marker diversity and hybrid
performance in both intra and inter specific hybrids of
cotton to evaluate the feasibility of predicting hybrid
performance using molecular markers. Three
cytoplasmic male sterile (CMS) lines were crossed
with 10 restorer lines to produce 22 F, hybrids during
2003. Of 22 F(1) s, 14 hybrids were intraspecific (G.
hirsutum × G. hirsutum) and eight interspecific (G.
hirsutum × G. barbadense). These 22 F, hybrids and
their parents were evaluated for yield and fiber quality
traits at Zhejiang University, Hangzhou, China during
2004 and 2005. Genetic distances (GD) among the
parents were calculated from 56 random-amplified
polymorphic DNAs (RAPD) and 66 simple sequence
repeat (SSR) marker data, and their correlation with
hybrid performance and heterosis were analysed.
Relationship SSR-Based Molecular Marker Cotton F1 Inter Specific Hybrids Performance Seed Cotton Yield
Mohammadi et al. (2008) investigated the correlation
between the potential of molecular markers and
hybrids performance in Maize. Significant correlation
was found between GD value of parental lines and
hybrid performance for the testcross and diallel data.
In diallel analysis significant correlation was observed
between total grain yield per ear (TGW) and genetic
distance based on SM coefficient, whereas the
correlation of GD and specific combining ability of
hybrids for this trait was not. Through the stepwise
multiple regression analysis a total of 19 informative
SSR markers distributed over all chromosomes,
except chromosomes 7 and 8, were detected. GD
values based on informative markers in general were
grater compared to that of based on all markers and
significant improvement was observed in the
correlations between GD estimates based on
informative markers and TGW as well as SCA.
24
polymorphism among parents, these 23 primers
produced a total of 134 amplified profiles (Table 1).
Among these, 93 were polymorphic with an average
of 68.65 per cent polymorphism. Primers viz., BNL
3871, BNL 3867 and BNL 1611 gave highest (100%)
polymorphism. The number of bands ranged from two
(BNL 3871, BNL 1034, BNL 1227 and BNL 3867) to
ten (BNL 2655, BNL 3145, BNL 1440, BNL 3171 and
BNL 3994) with an average of 3.35 bands per primer.
The primers viz., BNL 1034, BNL 1227, BNL 1059
and CIR 246 showed the least polymorphism (50%).
DNA amplification pattern of 32 parents is shown in
Figure 1.
The objectives of the present study were 1- To
investigate the relationship of genetic distance, based
on SSR markers, with hybrid performance and
heterosis and to determine whether these markers
would be useful for predicting hybrid performance
and heterosis in cotton. 2- To improve the yield and
fiber quality using interspecific hybridization
(G.hirsutum × G. barbadense) in cotton.
1 Results and Discussion
1.1 Marker polymorphism
Analysis of microsatellites (SSR’s) in 32 parents (28
barbadense lines and 4 hirsutum testers) using 40
primers. Of these, 23 primers revealed a high DNA
Figure 1 DNA amplification pattern of 32 parents genotypes
Sl. No.
SSR name
Polymorphism
No of bands
Total
Monomorphic
Polymorphic
1
BNL3627
0
0
0
0
2
BNL3147
0
0
0
0
3
BNL2921
0
0
0
0
4
BNL4082
0
0
0
0
5
BNL3871
2
0
2
100
6
BNL1034
2
1
1
50
7
BNL1227
2
1
1
50
8
BNL341
0
0
0
0
9
BNL1231
0
0
0
0
10
BNL1878
0
0
0
0
Genomics and Applied Biology
Table 1 Analysis of SSR patterns generated using 40 primers in cotton genotypes
25
Genomics and Applied Biology
Continuing table 1
Sl. No.
SSR name
No of bands
Total
Monomorphic
Polymorphism
Polymorphic
Genomics and Applied Biology
11
BNL3867
2
0
2
100
12
BNL116
4
1
3
75
13
BNL3511
8
2
6
75
14
BNL3031
0
0
0
0
15
BNL3085
0
0
0
0
16
BNL3569
0
0
0
0
17
BNL1421
7
2
5
71
18
BNL1495
5
2
3
60
19
BNL1521
7
3
4
57
20
BNL2655
10
3
7
70
21
BNL3145
10
2
8
80
22
BNL580
0
0
0
0
23
BNL542
0
0
0
0
24
BNL686
0
0
0
0
25
BNL3383
0
0
0
0
26
BNL1611
6
0
6
100
27
BNL1531
7
3
4
57
28
BNL2920
0
0
0
0
29
BNL2882
3
1
2
67
30
BNL1059
4
2
2
50
31
BNL3418
0
0
0
0
32
BNL3259
5
2
3
60
33
BNL1440
10
3
7
70
34
BNL3171
10
2
8
80
35
BNL3408
5
2
3
60
36
BNL3994
10
3
7
70
37
CIR246
4
2
2
50
38
CIR381
6
2
4
67
39
CIR070
0
0
0
0
40
CIR100
5
2
134
1.2 Molecular marker diversity among the parents
The similarity coefficients (Table 2) involved in the
line x tester study ranged from 57% to 96 %, with an
average of 81%. Among the parental lines, the lines
DB 533 × DB 534 F4 IPS 8 and DB 533 × DB 534 F4
IPS 1 showed highest similarity coefficient value
(96%). While, the lines DB 533 × DB 534 F4 IPS 48
and DB 533 × DB 534 F4 IPS 16 exhibited lowest
similarity coefficient value (57%). All the 32
3
93
60
68.65
genotypes showed diversity among themselves
indicating that there is a considerable amount of
variation, which can be exploited through appropriate
breeding programme.
The dendrogram constructed from the pooled data is
presented in Figure 2, revealed three distinct clusters.
One cluster involved testers and in other clusters all
barbadense lines were placed which are already
having proven record in giving good hybrids.
Relationship SSR-Based Molecular Marker Cotton F1 Inter Specific Hybrids Performance Seed Cotton Yield
Figure 2 Dendrograms derived from an unweighted pair group
method analysis (UPGMA) cluster analysis by using Nei’s
26
(0.277) and heterosis over MRC 6918 (0.279) and
DCH 32 (0.279), while significant positive correlation
were found between genetic distance (GD) and
ginning outturn for mid parent heterosis (0.237).
Highly significant positive correlation were found
between genetic distance (GD) and seed cotton yield
for F1 performance (0.359) and heterosis over Bt
check MRC 6918 (0.336) and over non Bt check DCH
32 (0.362), while significant positive correlation were
found between genetic distance (GD) and seed cotton
yield for mid parent heterosis (0.226). Significant
positive correlation were found between genetic
distance (GD) and lint index for mid parent heterosis
(0.227), F1 performance (0.251) and heterosis over
MRC 6918 (0.250) and DCH 32 (0.250), while
significant positive correlation were found only
between genetic distance (GD) and fiber micronaire
value for F1 performance (0.241).
similarity coefficient based on SSR markers
1.3 Correlation between genetic distance and
hybrid performance and heterosis
Genetic distance (GD) based on SSR markers were
computed in Table 3. Genetic distance (GD) ranged
from 0.041 to 0.429, with an average of 0.183. The
result implied that each cluster dendrogram
substantially reflected its own genetic relationship
among parents. Overall, a low significant correlation
of GD with hybrid performance and heterosis was
detected in Table 4 and Figure 3. Highly significant
positive correlation were found between genetic
distance (GD) and ginning outturn for F1 performance
Figure 3 Relationship between genetic distance (GD) and
interspecific F1 performance, mid parent heterosis and heterosis
over MRC 6918 and DCH 32 for seed cotton yield (kg/ha)
G. hirsutum and G. barbadense are allotetraploid
(2n=4x=52) cottons, which together represent the
most extensively cultivated species worldwide. While
G. hirsutumis the most widely-cultivated species
well-known for its higher yield ad wider
environmental adaptation. It was recognized that the
two species cross easily and produce vigorous F1
hybrids (Loden and Richmind, 1915). Useful heterosis
in interspecific F1 hybrids which combined
productivity and quality has been reported by many
researcher (Davis and Palomo 1980, Roupakias et al.
1998, Galanopoulou-Sendouca and Roupakias, 1999;
Zhang and Wang, 2005).
Genomics and Applied Biology
The similarity coefficient values between the line DB
533 × DB 534 F4 IPS 49 and the tester DH 98-27
showed 67%. It revealed that DB 533 × DB 534 F4
IPS 49 was closely related to DH 98-27 with 67%
similarity between parents. The hybrid between DB
533 × DB 534 F4 IPS 49 and DH 98-27 exhibited the
highest yield of 2884.26 kg/ha. Similarity coefficient
(88%) value between lines and testers showed
between the line DB 533 × DB 534 F4 IPS 52 and the
tester ZCH8, the hybrid between these recorded an
yield of 2040.757 kg/ha. Lowest similarity coefficient
value was noticed between the line DB 533 × DB 534
F4 IPS 16 and tester DH 98-27 which revealed that
they are far distinct from each other. This combination
exhibited 2384.62 kg/ha yield.
27
Genomics and Applied Biology
Table 4 Correlation coefficients of genetic distance (GD) with F1 performance and heterosis
Traits
Mid parent heterosis
F1 performance
Heterosis over Mrc6918 check
Heterosis over DCH32 check
Number of bolls per plant
-0.347
-0.181
-0.177
-0.177
Mean boll weight (g)
-0.222
-0.297
-0.290
-0.290
Seed index (g)
0.193
0.170
0.164
0.164
Ginning outturn (%)
0.237*
0.277**
0.279**
0.279**
Lint index (g)
0.227*
0.251*
0.250*
0.250*
Seed cotton yield (kg/ha)
0.226*
0.359**
0.336**
0.362**
Fibre length (mm)
0.210*
0.120
0.120
0.120
-0.130
-0.130
-0.130
Fibre strength (g/t)
Fibre micronair value (µg/inch)
Fibre uniformity ratio %
Fibre maturity ratio
Fibre elongation %
-0.179
0.266**
-0.036
0.221*
-0.241
0.241*
0.241*
0.241*
-0.056
-0.056
-0.056
0.141
0.148
0.148
-0.119
-0.118
-0.118
* Significant at P = 0.05 ** Significant at P = 0.01
Genomics and Applied Biology
DNA based molecular markers acted as a versatile tool
to study variability and diversity in different plant
species. The development of DNA based markers
represent an alternative procedure of the identification
of promising parental lines for superior performances
of hybrids. The microsatellite (SSR’s) markers have
been widely used for the estimation of variation
among closely related individuals due to its
multiallelic nature and high polymorphism. Molecular
markers based on polymorphism of DNA are
especially useful for this purpose because they are not
affected by environment (Tatineni et al., 1996;
Saghai-Maroof et al., 1984). Several examples of the
application of molecular markers to estimate genetic
distances have been reported in maize (Smith et al.,
1990) and rice (Zhang et al., 1995). Thus, molecular
markers like SSR’s (microsatellite) could be used for
germplasm classification and clustering to derive
valuable information for heterosis prediction.
Therefore, they were useful for heterosis prediction in
seed cotton yield, lint index, ginning outturn and fiber
micronaire. According to Bernardo (1992) inadequate
genome coverage, random dispersion of molecular
markers (unlinked to QTLs) and different levels of
dominance could be the reason for low correlation
between molecular distance and heterosis and/or F1
performance. The existence of multiple allelism and
epistasis could also cause the low correlation of GD
and F1 performance/heterosis.
An assessment of the usefulness of molecular markers
in breeding cotton for yield and fiber quality
improvement may therefore need further consideration.
More molecular markers covering all 26 chromosomes
and at higher densities and molecular markers that are
linked to QTL for agronomic traits and fiber
properties are needed for further studies.
2 Materials and Methods
2.1 Plant materials and field evaluation
During 2010 the twenty eight F4 lines of (Gossypium
barbadense L.) (Table 5) cross (DB 533 × DB 534)
depending on the highest of fiber strength, are
proposed to be crossed with the four common diverse
(Gossypium hirsutum L.) viz., DH 98-27 (T1), ZCH8
(T2), 178-24 (T3) and DH 18-31 (T4) selected based on
the earlier study. The crossing programme was taken
up during 2010. The F4 lines and four common testers
were sown on staggered dates. To obtain derived F1s
seed, the flower buds of the proper size from testers
(used as female) were hand emasculated in the
evening between 3.00 to 6.00 pm. The emasculated
flowers were covered by butter paper packets for
avoiding out crossing as well as ensuring their easy
identification at the time of crossing. The emasculated
Relationship SSR-Based Molecular Marker Cotton F1 Inter Specific Hybrids Performance Seed Cotton Yield
flowers were pollinated during the next day morning
between 9.30 am to 11.30 am by brushing the pollen
from one of the F4 lines (used as male) on the
stigmatic surface. The pedicel of each pollinated
flower was tied with price label bearing date and lines
number for identification of crossed bolls. In this
manner derived F1s seeds were obtained.
Simultaneously, two populations of F4 lines were
selfed and material was advanced to F5 generation
during the same season.
Table 5 List of F4 barbadense line parents involved in the study
Abbreviation
Lines
1
2
3
4
5
6
7
8
9
10
11
12
13
14
15
16
17
18
19
20
21
22
23
24
25
26
27
28
L1
L2
L3
L4
L5
L6
L7
L8
L9
L10
L11
L12
L13
L14
L15
L16
L17
L18
L19
L20
L21
L22
L23
L24
L25
L26
L27
L28
(DB 533 × DB 534 F5 IPS 44)
(DB 533 × DB 534 F5 IPS 62)
(DB 533 × DB 534 F5 IPS 105)
(DB 533 × DB 534 F5 IPS 26)
(DB 533 × DB 534 F5 IPS 71)
(DB 533 × DB 534 F5 IPS 30)
(DB 533 × DB 534 F5 IPS 25)
(DB 533 × DB 534 F5 IPS 49)
(DB 533 × DB 534 F5 IPS 23)
(DB 533 × DB 534 F5 IPS 36)
(DB 533 × DB 534 F5 IPS 15)
(DB 533 × DB 534 F5 IPS 1)
(DB 533 × DB 534 F5 IPS 33)
(DB 533 × DB 534 F5 IPS 24)
(DB 533 × DB 534 F5 IPS 16)
(DB 533 × DB 534 F5 IPS 52)
(DB 533 × DB 534 F5 IPS 12)
(DB 534 × DB 533 F5 IPS 22)
(DB 533 × DB 534 F5 IPS 14)
(DB 533 × DB 534 F5 IPS 34)
(DB 533 × DB 534 F5 IPS 55)
(DB 533 × DB 534 F5 IPS 17)
(DB 533 × DB 534 F5 IPS 32)
(DB 533 × DB 534 F5 IPS 38)
(DB 533 × DB 534 F5 IPS 48)
(DB 533 × DB 534 F5 IPS 13)
(DB 533 × DB 534 F5 IPS 6)
(DB 533 × DB 534 F5 IPS 8)
The experimental material was planted on a medium
black soil at College of Agriculture, Dharwad under
irrigated condition. The F5 lines, derived F1s of two
populations along with the straight crosses and ruling
commercial check (MRC6918 and DCH 32) were
sown during kharif 2011 in all a randomized block
design with two replications and a spacing of 90 cm
between rows and 60 cm between the plants within a
row. Recommended fertilizer doses were applied and
other cultural practices were carried out at regular
interval. Plant protection measures were taken at
appropriate time to control pests and diseases. Each
set of 28 F4 lines thus was involved in 112 crosses
(refer to as derived F1s), which were subjected to L×T
analysis. The observations were recorded for number
of bolls (no/plant), mean boll weight (g), seed index
(g), ginning outturn (%), lint index (g), seed cotton
yield (kg/ha), fiber length (mm), fiber strength (g/t),
fiber micronaire value (µg/inch), fiber uniformity ratio
(%), fiber maturity ratio and fiber elongation (%).
Fiber quality traits were measured with the HighVolume Instrument.
2.2 SSR molecular marker analysis
Leaf tissue of each parents was harvested and total
genomic DNA was extracted from young leaves using
the hexadecyl-trimethyl ammonium bromide (CTAB)
method described by Saghai-Maroofet al., (1984).
SSR assays were performed using 40 oligonucleotide
primers from Sigma Aldrich Chemicals Pvt. Ltd., Co.
Amplification reactions were carried out in 20 mL
volumes containing 2.0 mL 10× assay buffer, 2.0 mL
dNTP mix (2.5 mM each), 0.5 mL forward primer
(5 pM/mL), 0.5 ml Reverse (5 pM/mL), 0.5 mL Taq
DNA polymerase (3U/mL), 2.0 mL Template DNA
(15 ng/mL) and 7.5 mL Sterile double distill water.
The amplification programmed for 5 min at 94℃
Denaturation (initial) of genomic DNA by one cycle
followed by 25 cycles of 1 min at 94℃, 1 min at 48 ±
5℃ and 1 min at 72℃. This was followed by a final
extension at 72℃ for 5 min. Amplification products
were analysed by Non-Denaturing gel electrophoresis
(PAGE) and viewed by silver staining.
2.3 Scoring the amplified fragments
The amplification of DNA profiles for all the primers
were compared with each other and the bands of DNA
at each amplification level of every primer were
scored as present (1) or absent (0) thus generating the
0, 1 matrix.
Per cent polymorphism (%) = (Total No. of
polymorphic bands)/(Total No. of bands generated by
40 primers) ×100%
Genomics and Applied Biology
Sl.No
28
29
Genomics and Applied Biology
2.4 Analysis of SSR profiles
Pair similarity coefficients were calculated for all
pairwise combinations of the parental lines according
to the method developed by Nei and Li (1979): Sij=
2Nij / (Ni+ Nj), where Sij is the similarity between
parents i and j; Nij is the number of bands present in
both parents; Ni is the number of bands present only
in parent I; Nj is the number of bands present only in
parent j. GD (genetic distance) was calculated as GD=
1- Sij. The similarity matrix from SSR markers, which
were computed using NTSYS-PC version 2.1 (Rohlf,
2001) were used to construct dendrograms based on
UPGMA (the unweighted pair- group method with
arithmetic means). Using the same NTSYS software, a
cophenetic value matrix was calculated to test the
goodness of fit for the cluster analysis to the original
distance matrix.
For studying the relationship between SSR molecular
maker and hybrids performance and heterosis, the mid
parent heterosis (MPH) was computed using the
formula 100 × (F1-MP)/MP, where F1 is the hybrid
performance and MP is the mid-parent mean. Per cent
heterosis in F1 over commercial check (CC) was
computed using the formula 100 × (F1-CC)/CC, where
CC commercial check mean.
Galanopoulou-Sendouca
S.,
and
D.
Roupakias,
1999,
Performance of cotton F1 hybrids and its relation to the
mean yield of advanced bulk generation, Eur. J. Agron.,
11(1): 53-62
http://dx.doi.org/10.1016/S1161-0301(99)00018-0
Gutierrez O.A., S. Basu, S. Saha, J.N. Jenkins, D.B. Shoemaker,
C.L. Cheatham, and J.C. McCarty, 2002: Genetic distance
among selected cotton genotypes and its relationship with
F2 performance Crop Sci., 42(6): 1841-1847
http://dx.doi.org/10.2135/cropsci2002.1841
Jones D.F., 1945, Heterosis resulting from degenerative
changes, Genetics, 30(6): 527-542
PMCid:PMC1209309
Loden H.D., and T.R. Richmond, 1915, Hybrid vigor in
cotton–cytogenetic aspects and pratical applications, Econ.
Bot., 5: 387-408
http://dx.doi.org/10.1007/BF02984805
Meredith W.R., and J.S. Brown, 1998, Heterosis and combining
ability of cotton originating from different regions of the
United States, J. Cotton Sci., 2: 77-84
Mohammadi S.A., Prassana B.M., Sudan C., and Singh N.N.,
2008, SSR heterogenic patterns of Maize parental lines
and prediction of hybrid performance, Journal of
Biotechnology and Biotechnological Equipments, 22(1):
541-547
Nei M., and W. Li, 1979, Mathematical model for studying
References
genetic variation terms of restriction endonucleases, Proc.
Beasley J.O., 1940, The origin of American tetraploid
Natl Acad. Sci. USA, 6: 5269-5273
http://dx.doi.org/10.1073/pnas.76.10.5269
Gossypium species, Am. Nat., 74: 285–286
Riaz A., G. Li, Z. Quresh, M.S. Swati, and C.F. Quiros, 2001,
http://dx.doi.org/10.1086/280895
single-cross
Genetic diversity of oilseed Brassica napusinbred lines
performance and molecular marker heterozygosity, Theor.
based on sequence-related amplified polymorphism and its
Appl. Genet., 83(5): 628-634
relation to hybrid performance, Plant Breeding, 120:
http://dx.doi.org/10.1007/BF00226908
411-415
Bernardo
R.,
1992,
Relationship
between
Genomics and Applied Biology
Davis D.D., 1978, Hybrid cotton: Specific problems and
potentials, Adv. Agron., 30:129-157
http://dx.doi.org/10.1016/S0065-2113(08)60705-1
http://dx.doi.org/10.1046/j.1439-0523.2001.00636.x
Rolf F.J., ed., 2001, NTSYS-PC Numerical Taxonomy and
Multivariate Analysis System, Exeter Publ, Setauket
Davis D.D., and Palomo A., eds., 1980, Yield stability of
Roupakias D.G., E. Gouli-Vavdinoudi, M. Koutsika-Sotiriou, S.
Interspecific Hybrids NX-1, Proc. Belt. Cott. Prod. Res.
Galanopoulou-Sendouca, and A.S. Mavromatis, 1998,
Conf., National Council of America, Memphis, TN
Heterosis in cotton, Biotechnology in agricultural and
Diers B.W., P.B.E. McVetty, and T.C. Osborn, 1996,
forestry, In: Y. P. S. Bajaj (ed), Cotton, Springer- Verlag,
Relationship between heterosis and genetic distance based
Berlin, pp.140-172
on RFLP markers in oilseed rape (Brassica napus L.),
http://dx.doi.org/10.1007/978-3-642-80373-4_9
Crop Sci., 36(1): 79-83
Saghaii-Maroof M.A., Soliman K.M., Jorgensen R.A., and
http://dx.doi.org/10.2135/cropsci1996.0011183X00360001
Allard R.W., 1984, Ribosomal DNA spacer length
0014x
polymorphism
in
barley:
Mendelian
inheritance,
Relationship SSR-Based Molecular Marker Cotton F1 Inter Specific Hybrids Performance Seed Cotton Yield
chromosomal
location
and
population
dynamics,
Proceedings of National Academy of Sciences, USA, 81:
8014-8018
http://dx.doi.org/10.1073/pnas.81.24.8014
Sheng J.X., G.Y. Lu, T.D. Fu, and G.S. Yang, 2002,
Relationships between genetic diversity and hybrid
performance in Oilseed rape (Brassica napus), Acta Agron.
Sin., 28: 622-627
30
http://dx.doi.org/10.2135/cropsci1996.0011183X00360001
0033x
Wu Y.T., T.Z. Zhang, X.F. Zhu, and G.M. Wang, 2002,
Relationship between F1, F2 hybrid yield, heterosis and
genetic distance measured by molecular markers and
parent performance in cotton, Sci. Agric. Sin., 1: 498-507
Zhang Q., Saghai M.A., Yang G.P., Liu K.D., Zhou Z.Q.,
Gravois K.A., C.G. Xu, and Gao Y.G., 1995, Correlations
Smith O.S., Smith J.S.C., Bowen S.L., Tenborg R.A., and Wall
between molecular marker polymorphism and hybrid
S.J., 1990, Similarities among a group of elite maize
performance in rice, Plant Genome IV Conference, San
inbreeds as measured by pedigree, F1 grain yield, grain
Diego, CA, pp.307
yield, heterosis and RFLPs, Theor. Appl. Genet., 80:
Zhang X.Q., and X.D. Wang, 2005, Preliminary study on
833-840
heterosis of interspecific hybrid cotton (Gossypiumhirsutum ×
http://dx.doi.org/10.1007/BF00224201
G. barbadense) based on cytoplasmic male sterility system,
Tanksley S.D., 1983, Molecular markers in plant breeding,
Plant Mol. Biol. Rep., 1: 3-8
http://dx.doi.org/10.1007/BF02680255
ActaGossypii Sin., 17: 79-83
Zhang X.Q., Wang X.D., Jiang P.D., Hua S.J., Zhang H.P. and
Dutt Y., 2007, Relationship between molecular marker
Tatineni V., Cantrell R.G., and Davis D.D., 1996, Genetic
heterozygosity and hybrid performance in intra- and inter
diversity in elite cotton germplasm determined by
specific hybrids of cotton, Journal of Plant Breeding, 126:
morphological characteristics and RAPDs, Crop Sci., 36:
385-391
186-192
http://dx.doi.org/10.1111/j.1439-0523.2007.01384.x
Genomics and Applied Biology
Genomics and Applied Biology 2013, Vol.4, No.4, 22-34
http://gab.sophiapublisher.com
Table 2 Similarity coefficients for the 32 parents computed from SSR molecular marker data
L1
L2
L3
L4
L5
L6
L7
L8
L9
L10
L11
L12
L13
L14
L15
L16
L17
L18
L19
L20
L1
L2
1
0.88 0.90 0.78 0.87 0.82 0.77 0.80 0.82 0.84 0.84 0.93 0.77 0.78 0.64 0.85 0.82 0.78 0.79 0.76 0.82 0.77 0.82 0.78 0.75 0.82 0.82 0.88 0.63 0.79 0.74 0.68
1
L3
L4
L5
L6
L7
L8
L9
L10 L11
L12 L13 L14 L15 L16 L17 L18 L19 L20 L21 L22 L23 L24 L25 L26 L27 L28 T1
T2
T3
T4
0.90 0.84 0.84 0.85 0.79 0.77 0.79 0.81 0.84 0.90 0.82 0.81 0.68 0.88 0.82 0.75 0.82 0.82 0.82 0.74 0.85 0.78 0.78 0.85 0.85 0.85 0.63 0.79 0.77 0.68
1
0.87 0.91 0.90 0.85 0.80 0.85 0.80 0.86 0.89 0.82 0.83 0.68 0.93 0.85 0.81 0.84 0.87 0.90 0.82 0.84 0.84 0.81 0.87 0.90 0.87 0.73 0.87 0.82 0.74
1
0.84 0.85 0.79 0.80 0.77 0.78 0.84 0.87 0.82 0.81 0.68 0.88 0.82 0.75 0.79 0.79 0.82 0.74 0.85 0.81 0.78 0.82 0.88 0.88 0.70 0.85 0.77 0.80
1
0.93 0.90 0.85 0.85 0.83 0.92 0.86 0.87 0.86 0.68 0.90 0.79 0.81 0.87 0.87 0.90 0.82 0.87 0.84 0.81 0.87 0.85 0.85 0.73 0.87 0.82 0.71
1
0.86 0.89 0.83 0.90 0.90 0.88 0.86 0.87 0.67 0.89 0.81 0.85 0.85 0.89 0.92 0.84 0.89 0.85 0.85 0.92 0.89 0.86 0.72 0.85 0.81 0.73
1
0.87 0.83 0.79 0.88 0.82 0.86 0.85 0.77 0.86 0.75 0.80 0.85 0.83 0.86 0.81 0.83 0.79 0.79 0.83 0.81 0.81 0.75 0.83 0.81 0.67
1
0.84 0.90 0.91 0.88 0.84 0.82 0.61 0.81 0.84 0.88 0.88 0.81 0.87 0.82 0.86 0.83 0.89 0.87 0.87 0.89 0.67 0.83 0.78 0.76
1
0.85 0.88 0.88 0.81 0.87 0.67 0.83 0.89 0.88 0.91 0.89 0.89 0.87 0.86 0.85 0.85 0.89 0.86 0.86 0.72 0.83 0.81 0.73
1
0.92 0.89 0.79 0.83 0.64 0.82 0.82 0.86 0.84 0.81 0.87 0.82 0.84 0.84 0.84 0.90 0.85 0.87 0.60 0.81 0.79 0.74
1
0.92 0.88 0.83 0.69 0.88 0.85 0.87 0.92 0.85 0.88 0.86 0.87 0.84 0.87 0.88 0.85 0.90 0.68 0.87 0.85 0.77
1
0.85 0.83 0.66 0.90 0.90 0.87 0.87 0.82 0.88 0.83 0.90 0.84 0.84 0.88 0.90 0.96 0.68 0.84 0.80 0.77
1
0.87 0.77 0.89 0.81 0.85 0.91 0.86 0.83 0.81 0.89 0.79 0.77 0.83 0.81 0.81 0.79 0.85 0.78 0.75
1
0.75 0.90 0.79 0.86 0.84 0.93 0.90 0.85 0.84 0.84 0.78 0.87 0.85 0.82 0.73 0.84 0.79 0.74
1
0.73 0.60 0.66 0.67 0.69 0.67 0.67 0.69 0.68 0.57 0.67 0.60 0.60 0.78 0.70 0.67 0.63
1
0.86 0.85 0.85 0.91 0.89 0.87 0.86 0.82 0.79 0.86 0.89 0.89 0.75 0.88 0.83 0.78
1
0.88 0.88 0.83 0.83 0.84 0.86 0.82 0.88 0.86 0.92 0.92 0.72 0.83 0.78 0.81
1
0.90 0.90 0.88 0.91 0.82 0.84 0.87 0.90 0.88 0.85 0.74 0.82 0.77 0.80
1
0.88 0.85 0.86 0.85 0.79 0.85 0.85 0.83 0.85 0.72 0.87 0.85 0.75
1
0.91 0.93 0.82 0.88 0.85 0.91 0.89 0.80 0.78 0.85 0.83 0.75
Genomics and Applied Biology 2013, Vol.4, No.4, 22-34
http://gab.sophiapublisher.com
Continuing table 2
L1
L2
L3
L4
L5
L6
L7
L8
L9
L10 L11
L12 L13 L14 L15 L16 L17 L18 L19 L20 L21 L22 L23 L24 L25 L26 L27 L28 T1
L21
1
L22
T4
0.78 0.83 0.89 0.87 0.84 0.84 0.76 0.83 0.81 0.73
1
L24
T3
0.90 0.89 0.91 0.88 0.94 0.92 0.89 0.72 0.85 0.81 0.73
1
L23
T2
0.88 0.82 0.89 0.89 0.89 0.75 0.80 0.74 0.72
1
L25
0.84 0.91 0.91 0.82 0.77 0.82 0.77 0.77
1
L26
0.88 0.88 0.88 0.70 0.79 0.74 0.71
1
L27
0.94 0.86 0.72 0.83 0.78 0.75
1
L28
0.92 0.72 0.83 0.78 0.81
1
T1
0.66 0.83 0.78 0.78
1
T2
0.75 0.66 0.69
1
T3
0.91 0.86
1
T4
0.84
1
Table 3 Genetic distance for the 32 parents computed from SSR molecular marker data
L1
L2
L3
L4
L5
L1
L2
1
0.13 0.10 0.22 0.13 0.18 0.24 0.20 0.18 0.16 0.16 0.07 0.24 0.22 0.36 0.15 0.18 0.22 0.21 0.24 0.18 0.23 0.18 0.22 0.25 0.18 0.18 0.12 0.37 0.21 0.27 0.32
1
L3
L4
L5
L6
L7
L8
L9
L10 L11 L12 L13
L14 L15 L16 L17 L18 L19
L20 L21 L22 L23 L24
L25 L26 L27 L28 T1
T2
T3
T4
0.10 0.16 0.16 0.15 0.21 0.23 0.21 0.19 0.16 0.10 0.18 0.19 0.32 0.12 0.18 0.25 0.18 0.18 0.18 0.26 0.15 0.22 0.22 0.15 0.15 0.15 0.37 0.21 0.24 0.32
1
0.13 0.09 0.10 0.16 0.21 0.16 0.20 0.14 0.11 0.18 0.17 0.32 0.07 0.16 0.19 0.16 0.13 0.10 0.18 0.16 0.16 0.19 0.13 0.10 0.13 0.27 0.14 0.18 0.27
1
0.16 0.15 0.21 0.20 0.24 0.22 0.16 0.13 0.18 0.19 0.32 0.12 0.18 0.25 0.21 0.21 0.18 0.26 0.15 0.19 0.22 0.18 0.12 0.12 0.30 0.16 0.24 0.20
1
0.07 0.10 0.15 0.16 0.17 0.08 0.14 0.13 0.14 0.32 0.10 0.21 0.19 0.14 0.13 0.10 0.18 0.13 0.16 0.19 0.13 0.16 0.16 0.27 0.14 0.18 0.29
Genomics and Applied Biology 2013, Vol.4, No.4, 22-34
http://gab.sophiapublisher.com
Continuing table 3
L1
L6
L7
L8
L9
L10
L11
L12
L13
L14
L15
L16
L17
L18
L19
L20
L21
L22
L23
L24
L2
L3
L4
L5
L6
L7
1
0.14 0.11 0.17 0.10 0.10 0.12 0.14 0.13 0.33 0.11 0.19 0.15 0.15 0.11 0.08 0.16 0.11 0.15 0.15 0.08 0.11 0.14 0.28 0.15 0.19 0.28
1
L8
L9
L10 L11 L12 L13
L14 L15 L16 L17 L18 L19
L20 L21 L22 L23 L24
L25 L26 L27 L28 T1
T2
T3
T4
0.14 0.17 0.21 0.12 0.18 0.14 0.16 0.23 0.14 0.25 0.21 0.15 0.17 0.14 0.19 0.17 0.21 0.21 0.17 0.19 0.19 0.25 0.17 0.19 0.33
1
0.16 0.10 0.09 0.12 0.16 0.18 0.39 0.19 0.16 0.12 0.12 0.19 0.14 0.18 0.14 0.17 0.11 0.14 0.14 0.11 0.33 0.17 0.22 0.24
1
0.16 0.12 0.12 0.19 0.13 0.33 0.17 0.11 0.12 0.09 0.11 0.11 0.13 0.14 0.15 0.15 0.11 0.14 0.14 0.28 0.17 0.19 0.28
1
0.08 0.11 0.21 0.17 0.36 0.18 0.18 0.14 0.16 0.19 0.13 0.18 0.16 0.16 0.16 0.10 0.16 0.13 0.40 0.19 0.21 0.27
1
0.08 0.12 0.17 0.31 0.12 0.15 0.14 0.08 0.16 0.12 0.14 0.13 0.16 0.13 0.12 0.15 0.10 0.32 0.13 0.15 0.23
1
0.15 0.17 0.34 0.10 0.10 0.14 0.13 0.18 0.12 0.17 0.10 0.16 0.16 0.12 0.10 0.04 0.32 0.16 0.21 0.23
1
0.13 0.23 0.11 0.19 0.15 0.09 0.14 0.17 0.19 0.11 0.21 0.24 0.17 0.19 0.19 0.21 0.15 0.22 0.25
1
0.25 0.10 0.21 0.14 0.16 0.07 0.10 0.15 0.16 0.16 0.22 0.13 0.16 0.18 0.27 0.16 0.21 0.27
1
0.27 0.40 0.34 0.33 0.31 0.33 0.33 0.31 0.32 0.43 0.33 0.40 0.40 0.22 0.30 0.33 0.37
1
0.14 0.15 0.15 0.09 0.11 0.13 0.14 0.18 0.21 0.14 0.11 0.11 0.25 0.12 0.17 0.22
1
0.12 0.12 0.17 0.17 0.16 0.14 0.18 0.12 0.14 0.08 0.08 0.28 0.17 0.22 0.19
1
0.11 0.10 0.12 0.09 0.18 0.16 0.13 0.10 0.12 0.15 0.26 0.18 0.23 0.20
1
0.12 0.15 0.14 0.15 0.21 0.16 0.15 0.17 0.15 0.28 0.13 0.15 0.25
1
0.09 0.08 0.18 0.12 0.15 0.09 0.11 0.20 0.22 0.15 0.17 0.25
1
0.10 0.11 0.09 0.12 0.06 0.08 0.11 0.28 0.15 0.19 0.28
1
0.22 0.17 0.11 0.13 0.16 0.16 0.24 0.17 0.19 0.27
1
0.12 0.18 0.11 0.11 0.11 0.25 0.21 0.26 0.28
1
0.16 0.09 0.09 0.18 0.23 0.18 0.24 0.23
Genomics and Applied Biology 2013, Vol.4, No.4, 22-34
http://gab.sophiapublisher.com
Continuing table 3
L1
L25
L26
L27
L28
T1
T2
T3
T4
L2
L3
L4
L5
L6
L7
L8
L9
L10 L11 L12 L13
L14 L15 L16 L17 L18 L19
L20 L21 L22 L23 L24
L25 L26 L27 L28 T1
1
T2
T3
T4
0.12 0.12 0.12 0.30 0.21 0.27 0.29
1
0.06 0.14 0.28 0.17 0.22 0.25
1
0.08 0.28 0.17 0.22 0.19
1
0.34 0.17 0.22 0.22
1
0.25 0.34 0.31
1
0.09 0.14
1
0.16
1

© Copyright 2026