
Insight Key Australian Office Transactions February 2015
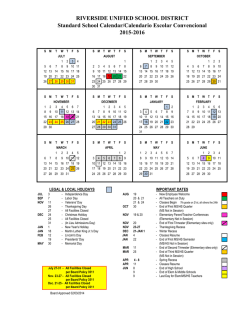
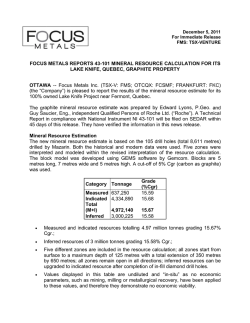
Key Australian Office Transactions Savills Research February 2015 contents 03 Overview 04 Australian Office Property 05 Office Investment Market 06 Adelaide 08 A delaide Key Office Transactions 2014 10 Brisbane 12 B risbane Key Office Transactions 2014 14 Melbourne savills research team Our highly regarded research division is dedicated to understanding and giving in-depth insight into the office, industrial, retail, hotels and residential markets throughout Australia. 22 P erth Key Office Transactions 2014 Savills provides free research reports on all major property markets, and some example papers include: We also provide in-depth consultancy services, ranging from tenant representation to property site selection for multinational businesses. Office Markets Retail Markets Residential Trends Industrial Markets International Markets Our research teams are highly qualified real estate professionals with comprehensive knowledge of property markets across Australia. The Savills Research & Consultancy team has years of experience, and is supported by our extensive agency, 16 M elbourne Key Office Transactions 2014 21 Perth property management and valuation professionals, who are highly regarded and respected along with Savills Research teams across the globe. Savills Research Western Australia Spotlight Perth Industrial October 2014 Highlights A total of 143,877 square metres of industrial space was reported leased in the 12 months to September 2014 Prime rents in Perth’s industrial core precinct range from $95 to $125 per square metre Approximately $435 million of industrial property was reported sold over the year Core land values range from $400 to $1,150 per square metre for assets up to 5,000 square metres A large amount of forecast new supply will likely lead to softening conditions in industrial capital and leasing markets over the next 12 to 18 months Prime rents in Perth’s core precinct range from $95 to $125 per square metre Savills Research For our latest reports, contact one of the team or visit savills.com.au/research Savills Research New South Wales Spotlight Sydney CBD Office October 2014 Highlights The latest numbers from PCA indicate that overall vacancy has decreased to 8.4%, down from 9% six months earlier Supply remains severely constrained over the shortterm, with less than 50,000 square metres of net supply due to complete in the second half of 2014 Full floor availability as at August 2014 is currently sitting at 13.8%, with nine available options for tenants >10,000 square metres Savills Research South Australia Spotlight Adelaide CBD Retail October 2014 Highlights Net absorption of 57,272 square metres was recorded in the 12 months to June 2014 Sales activity in the 12 months to September 2014 totalled $3.7 billion, up 42 % on the amount recorded in the prior 12 month period Indicative A Grade yields currently range from 6.25% to 7.00%, a decrease of 25 basis points at both ends of the range in the last 12 months Retail vacancy rates have risen in Rundle Mall to 3.5 percent, together with an increase to 5.7 percent in Rundle Street as at September 2014 Retail turnover in South Australia has risen by 3.0 percent (seasonally adjusted) in the year to July 2014 The Rundle Mall masterplan is expected to draw consumers back into the CBD once complete Clothing, footwear & personal accessory is the dominant tenant Savills Research Queensland Savills Research Victoria Spotlight Melbourne Industrial October 2014 Spotlight Brisbane CBD Office October 2014 Highlights group in Rundle Mall, with 55 percent of the tenant mix Economic benefits of the mining and defence industries are being offset by a lack of population growth and consumer spending in the State Recent reductions to interest rates are anticipated to further boost retail spending Retail turnover in South Australia has risen by 3 percent Savills Research Melbourne’s infrastructure continues to give it a competitive advantage A total of 681,5520 square metres A total of $1.45 billion of industrial property was sold in the year to September 2014 was reported leased in the year to September 2014 Land values range from $100 to $200 a for 216,858 square metres of reported leasing Investment yields for prime industrial Pre-commitment activity accounted Industrial rents generally range from $65 to $95 a square metre for prime industrial space square metre for land between 1 and 5 hectares property in a range of 7.00% to 8.00% Signs of a recovery in tenant demand are underway with significant increase in recent levels of leasing Institutions & Privates help provide investor demand not seen since the onset of the GFC Savills Research Highlights According to the Property Council Savills recorded approximately Savills recorded 79,185 square Leasing demand is significantly the vacancy rate in the Brisbane CBD was 14.7% at July 2014 metres of leasing activity for the 12 months to September 2014 Negative absorption of 44,129 square metres in the 12 months to June 2014 $1.030 billion of transactions in the 12 months to September 2014 down on historic averages The CBD property market continues to experience a high level of interest from investors of all categories 25 Sydney 26 S ydney Key Office Transactions 2014 Download the Savills App for insights at your fingertips This information is general information only and is subject to change without notice. No representations or warranties of any nature whatsoever are given, intended or implied. Savills will not be liable for any omissions or errors. Savills will not be liable, including for negligence, for any direct, indirect, special, incidental or consequential losses or damages arising out of our in any way connected with use of any of this information. This information does not form part of or constitute an offer or contract. You should rely on your own enquiries about the accuracy of any information or materials. All images are only for illustrative purposes. This information must not be copied, reproduced or distributed without the prior written consent of Savills. 3 overview The calendar year 2014 marked a continuation of strong performance in investment markets with property sales turnover at record levels and strong gains made on local and global sharemarkets. Interest rates have stayed low, the search for yield and security remained strong however there has been more capital allocated for higher risk property including development. The S&P500 index rose 12 percent to a record high reflecting cheap capital and a sense of economic recovery in the United States. This was further emphasised by the official end of quantitative easing. The Australian ASX AREIT Index rose 21 percent and the Australian dollar fell 9 percent against the US dollar. Nationally, over $24 billion of commercial property has been transacted and over 3.6 million square metres of industrial and office space has been reported leased which gives us confidence that the markets are operating normally. Commercial property yields in particular continue to look attractive. The Australian economy is being rebalanced as growth in mining investment softens. This means housing and retail should continue to lift with positive knock-on effects to industrial and office markets. As consumer confidence continues to rise, so should business confidence. As profit margins are restored, business decision making should gain momentum. Some State Governments will move into election mode and could be expected to provide some stimulus to parts of the economy providing further momentum to investment markets. China (even at a lower level of growth) and the United States are forecast to contribute positively to Australia’s economic outlook whilst Europe remains a drag. 4 australian office property The office cycle is behaving exactly as we would expect and there is nothing out of the ordinary going on. Australia’s CBD office markets have weathered the twin effects of the GFC and the mining investment boom over the past seven years to register over a million square metres of net absorption. This has occurred in an environment where business confidence has been low (apparently) and consumers have been in their shells. The fact that we have added nearly 2 million square metres of space to our CBD office markets in the same seven year period says a number of things: Rents are at a level where construction can occur, they cannot, by definition, grow much beyond that Businesses are in a position to commit to a new building, confident, forward looking, managing their business affairs well. This is an important point. Financial services, government and corporations have used the GFC as an opportunity to work their accommodation harder by upgrading, consolidating and reconfiguring their office space. There are countless examples around the country and there is more to come over the next six years Banks, developers and funds are ready and available to ensure buildings are constructed. Debt and equity markets and an appetite for risk are all working in harmony These are not the signs of a market collapse or markets in dire straits, quite the contrary, as the office markets are behaving as they are supposed to. Interestingly, Sydney, a market which bore the brunt of the GFC, has seen its occupied stock remain unchanged over the past seven years. The rest of the country has seen occupied stock increase by over a million square metres. As to incentives, they are mostly paid for by higher face rents. In Sydney, where the incentive has risen from 20 percent to over 30 percent, face rents have grown by more than the value of the incentive, this is also the case in Melbourne, Perth and Adelaide. The only exception is Brisbane. On average, in the Australian CBDs incentives have doubled, but rents have grown by more than the value of the incentive. So where do we go from here? Savills Research forecasts another million square metres of construction over the next five years – reinforcing the three previous bulleted points. Savills Research also forecasts a commensurate increase in the amount of occupied space. So, does this leave us in the same place? No. Withdrawals are expected to be in the order of 700,000 square metres. This is on top of the 500,000 square metres we have withdrawn over the past seven years. This will lead to a tightening in the vacancy rate in some CBDs, especially for prime buildings as upgrade activity accelerates. What is interesting about the forecasts produced by Savills Research is the balance of growth and change in market fortunes. Sydney and Melbourne in particular are expected to outperform Perth and Brisbane. This is in part because the economic cycle is shifting the balance of growth in the economy and in part because the location of new supply is changing with Perth and Brisbane upgrading the quality of their stock. Savills Research forecasts a fall in incentives in Melbourne and Sydney and no change in Brisbane and Perth. What is important to note in these forecasts is that the growth in the face rent is forecast to cover the change in incentives. 5 office investment market Savills has recorded approximately $13.9 billion worth of office transactions in the 12 months to December 2014 nationally. This is commensurate with the $14.3 billion in the previous year, and up on the five year average of $9.8 billion. During the same period 265 properties were sold, up from the previous year of 221, and up on the five year average of 221. The 'Fund' purchaser category was again the most active in the national office investment market for the 12 months to December 2014, purchasing 33 percent of the stock sold (or $4.6 billion worth of office transactions). However, the 'Private Investor' category made the most purchases (81). Having been sidelined for several years due to issues surrounding their balance sheet and their units trading at a discount to NTA, the Trusts are back and buying again. Funds are increasingly active as flows to superannuation continue unabated. Foreign investors continue to be attracted to CBD office buildings in Melbourne and Sydney. If the RBA is successful in stimulating stronger growth in the non-resources side of the economy, then the office markets in both Melbourne and Sydney should be the beneficiaries of stronger tenant demand. Signs of this were seen in the last six months of 2014 and Savills Research expects this trend to continue in 2015. Australian Office Office Property Sales by Price Range ($m) December 2004 to December 2014 $16,000 $14,000 $12,000 $10,000 $8,000 $6,000 $4,000 $2,000 $0 Dec 04 Dec 05 Dec 06 Dec 07 Dec 08 Dec 09 Dec 10 Dec 11 Dec 12 Dec 13 <$24m $25m-$49m $50m-$75m >$75m Dec 14 Source: Savills Research Australian Office Office Property Buyer Profile (%) 12 Months to December 2014 1% 13% Undisclosed Trust 2% 33% Owner Occupier Fund 1% Syndicate 31% 13% Foreign Investor Private Investor 6% Developer Source: Savills Research 6 adelaide Savills has recorded approximately $440 million worth of office transactions in the 12 months to December 2014 in the Adelaide Metro area. This is up 10 percent from $399 million in the previous year, and up on the five year average of $388 million. During the same period 44 properties were sold, up from the previous year of 41, and down on the five year average of 47. The 'Fund' purchaser category was the most active in the investment market for the year ended December 2014, purchasing 63 percent of the stock sold (or $279 million worth of office transactions). However the Private Investor category had the most transactions (12). Sales activity has increased over the last 12 months with a number of office assets changing hands and funds returning as the dominant buyer group. Interest from larger buyer groups has remained in the Adelaide market on the back of reduced financing costs and attractive yields. Sales volumes of assets in the sub $25 million range are expected to remain as the dominant sector in the short term, and as such private investors and owner occupiers are anticipated to remain the prevailing buyer group. Owners of secondary grade buildings will be faced with the need to refurbish existing stock as disparities between Adelaide’s older and newer office stock become more apparent. Market yields in the Adelaide CBD as at December 2014 are estimated to range between 8.00 percent and 8.50 percent for A Grade buildings, and between 8.75 percent and 9.75 percent for secondary grade buildings. The average yield for A Grade office buildings in the quarter to December 2014 is 8.25 percent, a 25 basis point firming over the year. Capital values in the Adelaide CBD as at December 2014 are estimated to range from $3,765 to $5,063 per square metre for A Grade buildings, and between $2,154 and $4,000 per square metre for secondary grade buildings. Average capital values for A Grade properties are $4,414 per square metre, a 19.5 percent increase over the year. Adelaide Office Metropolitan Office Sales by Price Range ($m) (>$1m) December 2004 to December 2014 $700 $600 $500 $400 $300 $200 $100 $0 Dec 04 Dec 05 Dec 06 Dec 07 Dec 08 Dec 09 Dec 10 Dec 11 Dec 12 Dec 13 $1m-$24m $25m-$49m $50m-$75m >$75m Dec 14 Source: Savills Research 7 8 adelaide key office transactions 2014 [2] Santos Building, 60 Flinders Street, Adelaide [3] P eople’s Choice Credit Union Building, 60 Light Square, Adelaide Price: $80.00 million Price: $22.00 million Date: September 2014 Date: September 2014 Initial Yield: 8.34% Initial Yield: 11.87% Market Yield: 8.34% Market Yield: 9.42% Rate per sq m of NLA: $5,085 [1] [1] 2 2 King William Street, Adelaide Price: $41.80 million Date: June 2014 Initial Yield: 8.38% Market Yield: 9.01% Rate per sq m of NLA: $4,347 Vendor: MWQ Properties Purchaser: Local Syndicate Comment: The property comprises a 14 level B Grade commercial office building completed circa 1970. The property was refurbished in 1987 and underwent a major refurbishment in 2010 including but not limited to new air conditioning units, passenger lifts and refurbished common areas. Rate per sq m of NLA: $3,163 Vendor: SachsenFonds Vendor: SachsenFonds Purchaser: APPF Commercial Purchaser: Primewest Comment: The property sold as part of a portfolio including the IAG Building at 80 Flinders Street, the People’s Choice Credit Union Building at 60 Light Square and the Flinders Link Car Park at 61-67 Wyatt Street. The combined sale price of the portfolio was $175.20 million. Santos recently pre-committed to lease approximately 7,000 square metres of office space in an adjoining development at 45 Pirie Street, with the lease structured such that the initial lease term expires simultaneously with the final option period in 60 Flinders Street. This indicates an intention by Santos to exercise both option periods within the subject property. Comment: The property was contracted by Lend Lease as part of a portfolio sale including the Santos Building at 60 Flinders Street, the IAG Building at 80 Flinders Street and the Flinders Link Car Park at 61-67 Wyatt Street. The combined sale price of the portfolio was $175.20 million. Prior to settlement of the portfolio Lend Lease negotiated the sale of 60 Light Square to Primewest. [4] IAG Building, 80 Flinders Street, Adelaide Price: $50.00 million Date: September 2014 Initial Yield: 8.30% Market Yield: 8.60% Rate per sq m of NLA: $4,002 Vendor: SachsenFonds Purchaser: APPF Commercial 9 [6] [3] Comment: The property sold as part of a portfolio including the Santos Building at 60 Flinders Street, the People’s Choice Credit Union Building at 60 Light Square and the Flinders Link Car Park at 61-67 Wyatt Street. The combined sale price of the portfolio was $175.20 million. Approximately 4,290 square metres of the building is sub-leased, with Bupa occupying levels 2 and 4, Fyfe occupying level 3 and Santos occupying level 5. [5] F linders Link Car Park, 61-67 Wyatt Street, Adelaide Price: $23.20 million Date: September 2014 Initial Yield: 7.43% Market Yield: 7.43% Rate per parking bay: $32,955 Vendor: SachsenFonds Purchaser: APPF Commercial Comment: The property sold as part of a portfolio including the Santos Building at 60 Flinders Street, the IAG Building at 80 Flinders Street and the People’s Choice Credit Union Building at 60 Light Square. The combined sale price of the portfolio was $175.20 million. The car park has licences to Santos for a minimum of 162 spaces (with a right to another 40 spaces) and IAG for 19 spaces, with both licence expiries aligned to the respective lease terms in the adjoining buildings. [7] [6] 151 Pirie Street, Adelaide [7] 100 Pirie Street, Adelaide Price: $72.00 million Price: $28.63 million Date: September 2014 Date: August 2014 Initial Yield: 7.17% Initial Yield: 6.90% Market Yield: Market Yield: 9.13% 7.26% Rate per sq m of NLA: $5,727 Rate per sq m of NLA: $3,174 Vendor: Vendor: Melis Developments (Receivers Appointed) Real I.S. Purchaser: Local Private Investor Comment: The improvements comprise a modern (circa 2006) A Grade commercial office building with a 5.5 Star NABERS Energy Rating constructed over eight levels with basement parking. The building offers modern presentation with a glass curtain wall facade providing ample natural light. The building has secure parking for 51 cars accessed via Naylor Street. Purchaser: Local Syndicate Comment: Improvements comprise a 10 level B Grade commercial office building completed in 1989, with various individual tenancies being refurbished throughout the building since completion. The property is leased to a mix of State and Federal Government departments, as well as a number of private tenants. 10 brisbane Savills has recorded approximately $1,375 million worth of office transactions in the 12 months to December 2014 in the Brisbane Metro area. This is more than half of the $3,110 million in the previous year, and down on the five year average of $1,811 million. During the same period 35 properties were sold, commensurate with the previous year of 34, but down on the five year average of 41. The 'Fund' purchaser category was the most active in the investment market for the 12 months to December 2014, purchasing 68 percent of the stock sold (or $936 million worth of office transactions). Similarly the 'Fund' category had the most transactions (12). Market yields in the Brisbane CBD as at December 2014 are estimated to range between 6.75 percent and 8.00 percent for A Grade buildings, and between 8.50 percent and 9.75 percent for secondary grade buildings. The average yield for A Grade office buildings in the quarter to December 2014 is 7.38 percent, a 13 basis point firming over the last 12 months. Capital values in the Brisbane CBD as at December 2014 are estimated to range from $5,750 to $8,074 per square metre for A Grade buildings, and between $3,744 and $5,118 per square metre for secondary grade buildings. Average capital values for A Grade properties are $6,814 per square metre, a 1.7 percent increase over the last 12 months. Brisbane Office Metropolitan Office Sales by Price Range ($m) (>$2m) December 2004 to December 2014 $3,500 $3,000 $2,500 $2,000 $1,500 $1,000 $500 $0 Dec 04 Dec 05 Dec 06 Dec 07 Dec 08 Dec 09 Dec 10 Dec 11 Dec 12 Dec 13 $2m-$24m $25m-$49m $50m-$75m >$75m Dec 14 Source: Savills Research 11 “Another $14 billion transacted with strong institutional and foreign investor appetite.” Tony Crabb, Savills Research 12 brisbane key office transactions 2014 [1] 7 0 Eagle Street, Brisbane Price: $122.70 million Date: April 2014 Initial Yield: 6.35% Market Yield: 6.32% Rate per sq m of NLA: $10,692 Vendor: APPF Commercial Purchaser: Pembroke Real Estate Comment: Central Plaza 3, 70 Eagle Street comprises 13 levels of office accommodation, ground level retail and three basement levels of car parking for 64 vehicles which is accessed via the adjacent building, Central Plaza 2. The building was completed in 2009 and has attained a 5.0 Star NABERS Energy Rating. The property is located within the Financial Precinct of the Brisbane CBD with a prominent frontage to Eagle Street and forms part of the sought after ‘Golden Triangle’ location. The building provides a good standard of internal accommodation with typical floor plates of approximately 855 square metres and good natural light to all tenancy areas, considered consistent with an ‘A Grade’ standard under PCA guidelines. [1] 13 [2] [2] 5 0 Ann Street, Brisbane [3] [3] 4 43 Queen Street, Brisbane [4] [4] 3 00 Adelaide Street, Brisbane Price: $128.94 million Price: $49.00 million Price: $47.50 million Date: July 2014 Date: July 2014 Date: November 2014 Initial Yield: 7.14% Initial Yield: 6.63% Initial Yield: 7.80% Market Yield: 6.90% Market Yield: 6.27% Market Yield: 6.27% Rate per sq m of NLA: $5,053 Rate per sq m of NLA: $8,791 Rate per sq m of NLA: $3,615 Vendor: Harburg Vendor: Brice Family Vendor: Charter Hall Purchaser: CIMB Purchaser: CBUS Property Purchaser: Offshore Company Comment: 50 Ann Street is a 25 storey commercial office building constructed circa 1975, with a significant refurbishment completed in 2007. In addition to the 25,382 square metres of office space, the building features 137 square metres of retail on the ground floor. Car parking is available for a total of 119 vehicles, located in a secure basement level. The building has a 4.5 Star NABERS energy rating and typical floor plates of 1,000 square metres considered consistent with a ‘B Grade’ standard under PCA guidelines. Comment: 443 Queen Street comprises six storeys of office accommodation and two levels of basement car parking for 43 vehicles. The building was completed circa 1983 and is located at the northern end of Queen Street, adjacent to Customs House. The property was recently refurbished and provides a good standard of internal accommodation with an average floor plate size of 929 square metres. The building provides river views from all levels and appears consistent with an ‘A Grade’ standard under PCA guidelines. The property was purchased in an off-market transaction. Market yield has been assessed on the basis of a rental guarantee on the vacant ground floor (445 square metres) expiring August 2016 at the rate of $650 per square metre. Comment: Sale of a 22 storey office building, once the Commonwealth Courts Building, completed in 1975. The building comprises a single level basement, ground floor, two levels of above ground parking for 36 vehicles and 19 upper floors offering a total 13,134 square metres of net lettable area. Individual floors are typically 651 square metres and the standard of accommodation is consistent with a ‘B Grade’ classification under PCA guidelines. 14 melbourne Savills has recorded approximately $4,036 million worth of office transactions in the 12 months to December 2014 in the Melbourne Metro area. This is up 40 percent from $2,890 million in the previous year, and up on the five year average of $2,476 million. During the same period 106 properties were sold, up from the previous year of 86, and up on the five year average of 79. The 'Fund' purchaser category was the most active in the investment market for the year ended December 2014, purchasing 37 percent of the stock sold (or $1,662 million worth of office transactions). However the Private Investor category had the most transactions (45). The 'Fund' vendor category was the most active in the investment market for the year ended December 2014, selling 54 percent of the stock sold (or $2,405 million worth of office transactions). However the Private Investor category had the most transactions (68). Market yields in the Melbourne CBD as at December 2014 are estimated to range between 6.50 percent and 7.25 percent for A Grade buildings, and between 7.75 percent and 9 percent for secondary grade buildings. The average yield for A Grade office buildings in the quarter to December 2014 is 6.88 percent, a 38 basis point firming over the year. Capital values in the Melbourne CBD as at December 2014 are estimated to range from $5,700 to $8,300 per square metre for A Grade buildings, and between $3,400 and $4,900 per square metre for secondary grade buildings. Average capital values for A Grade properties are $6,900 per square metre, a 11.3 percent increase over the year. Melbourne Office Metropolitan Office Sales by Price Range ($m) (>$2m) December 2004 to December 2014 $5,000 $4,500 $4,000 $3,500 $3,000 $2,500 $2,000 $1,500 $1,000 $500 $0 Dec 04 Dec 05 Dec 06 Dec 07 Dec 08 Dec 09 Dec 10 Dec 11 Dec 12 Dec 13 $2m-$24m $25m-$49m $50m-$75m >$75m Dec 14 Source: Savills Research 15 16 melbourne key office transactions 2014 [1] C BW, 550 Bourke & 181 William Streets, Melbourne Price: $608.10 million Date: September 2014 Initial Yield: 5.91% Market Yield: 6.50% Rate per sq m of NLA: $7,470 Vendor: Cbus Property Purchaser: GPT Group and GPT Wholesale Office Fund [1] Comment: CBW comprises two office buildings and a retail plaza. 550 Bourke Street is a 19 level office building providing 26,256 square metres of NLA whilst 181 William Street is a 26 level office building providing 49,833 square metres of NLA. The building is substantially leased to Insurance Australia Limited and Deloitte providing a WALE of 5.22 years. 17 [2] [3] [2] NAB, 700 Bourke Street, Melbourne [3] 7 50 Collins Street, Melbourne [4] O rigin Energy Building, 321 Exhibition Street, Melbourne Price: $433.50 million Price: $249.50 million Price: $208.00 million Date: September 2014 Date: April 2014 Date: July 2014 Initial Yield: 5.75% Initial Yield: 7.52% Initial Yield: 6.80% Market Yield: N/A Market Yield: 7.50% Market Yield: Rate per sq m of NLA: $6,765 Vendor: Cbus Property Purchaser: AMP Capital Wholesale Office Fund Comment: Modern office building constructed over 14 office levels, two levels of car parking and extensive end of trip facilities. The building, excluding the ground floor retail, is fully leased to National Australia Bank, who occupies 99.2 percent of the building by NLA until 30 June 2028 with two further option terms of five years. The property provides a significant WALE of 13.63 years. 6.78% Rate per sq m of NLA: $6,125 Rate per sq m of NLA: $6,887 Vendor: Commonwealth Property Office Fund Vendor: Cromwell Diversified Property Trust Purchaser: GPT Wholesale Office Fund Purchaser: Invesco Real Estate Ltd Comment: This follows the completion of the Dexus Property and Canada Pension Plan Investment Board takeover of the Commonwealth Property Office Fund (CPA), as part of which GPT entered into a binding memorandum of understanding in relation to the acquisition of the four properties, three in Victoria. Under the deal, properties were bought by the GPT Wholesale Office Fund. They are: 750 Collins Street; half of 2 Southbank Boulevard, Melbourne; half of 10 Shelley Street, Sydney; and all of 655 Collins Street, Melbourne. 750 Collins Street is a campus style office building located in the Docklands precinct of the Melbourne CBD. The building is substantially leased to AMP providing a WALE of 5.2 years. Comment: A 21 level building leased to Origin Energy until 2021 with two further option periods of five years with fixed annual increases of 4 percent. The property underwent a significant $32 million refurbishment in 2011. The property provides a WALE of 7.14 years. 18 melbourne key office transactions 2014 (cont.) [5] F reshwater Place, 2 Southbank Boulevard, Southbank (50%) Price: $196.70 million Date: April 2014 Initial Yield: 7.15% Market Yield: 6.48% Rate per sq m of NLA: $7,163 Vendor: Commonwealth Property Office Fund Purchaser: GPT Wholesale Office Fund Comment: This follows the completion of the Dexus Property and Canada Pension Plan Investment Board takeover of the Commonwealth Property Office Fund (CPA), as part of which GPT entered into a binding memorandum of understanding in relation to the acquisition of the four properties, three in Victoria. Under the deal, properties were bought by the GPT Wholesale Office Fund. They are: 750 Collins Street; half of 2 Southbank Boulevard, Melbourne; half of 10 Shelley Street, Sydney; and all of 655 Collins Street, Melbourne. 2 Southbank Boulevard comprises a 38 level office building constructed in 2005. The building is substantially leased to PricewaterhouseCoopers and provides a WALE of 2.88 years. [6] Ericsson Building, 818 Bourke Street, Docklands [8] Media House, 655 Collins Street, Melbourne Price: $152.50 million Price: $102.20 million Date: November 2014 Date: April 2014 Initial Yield: 6.97% Initial Yield: 6.89% Market Yield: 6.86% Market Yield: 6.84% Rate per sq m of NLA: $6,539 Vendor: GPT Group Purchaser: Hines Global REIT Comment: This eight level building in the Docklands precinct is home to Ericsson Australia. Built in 2007, the building provides 174 car bays and ground floor retail. Sold with one floor vacant. It has been predominantly leased to Ericsson Australia, Infosys Technologies Australia and AMP Services creating a WALE of 3.73 years. [7] K TS House, 350 Queen Street, Melbourne Price: $135.00 million Date: October 2014 Initial Yield: N/A Market Yield: N/A Rate per sq m of NLA: $6,109 Vendor: Kinetics Properties Purchaser: Private Foreign Investor Comment: Built in 1990, the 21 storey building was sold with significant vacancy. Rate per sq m of NLA: $6,149 Vendor: Commonwealth Property Office Fund Purchaser: GPT Wholesale Office Fund Comment: This follows the completion of the Dexus Property and Canada Pension Plan Investment Board takeover of the Commonwealth Property Office Fund (CPA), as part of which GPT entered into a binding memorandum of understanding in relation to the acquisition of the four properties, three in Victoria. Under the deal, properties were bought by the GPT Wholesale Office Fund. They are: 750 Collins Street; half of 2 Southbank Boulevard, Melbourne; half of 10 Shelley Street, Sydney; and all of 655 Collins Street, Melbourne. Completed in 2009, Media House is a seven level building in the Docklands precinct directly opposite Southern Cross station. Leased to Fairfax for 20 years with two five year options the building sold with a WALE of 15.67 years. The building is partly constructed on a deck above railway lines. 19 [11] [9] 2 Riverside Quay, Southbank (50%) Price: $106.00 million Date: November 2014 Initial Yield: N/A Market Yield: N/A Rate per sq m of NLA: $10,107 Vendor: Mirvac Group Purchaser: ISPT Comment: New office building under construction. The proposal consists of a 12 level building containing 20,975 square metres of office space constructed above the existing car park at a cost estimated to be $200 million. [10] 4 84 St Kilda Road, Melbourne Price: $94.00 million Date: May 2014 Initial Yield: 7.67% Market Yield: 7.70% Rate per sq m of NLA: $4,613 Vendor: Abacus Purchaser: UBS Grocon Real Estate Comment: A 16 storey office building completed in 1983 providing two levels of basement parking and ground floor retail. The property is leased to a variety of tenants generating a WALE of 3.71 years. Annual reviews range from 3.75 percent to 4 percent on lease terms of between 3 and 10 years. [11] 4 59 Little Collins Street, Melbourne Price: $45.50 million Date: September 2014 Initial Yield: 7.45% Market Yield: 6.92% Rate per sq m of NLA: $4,576 Vendor: Uniting Church (NSW) Trust Purchaser: Enwerd Pty Ltd Comment: A 16 level office building completed in 1969 which has undergone periodic refurbishment, especially between 2011 and 2013. Purchaser owns an adjoining building. Several major tenants occupy the building with nine of the 15 floors leased to whole floor tenants. The property sold with a WALE of 2.34 years. 20 21 perth Savills has recorded approximately $325 million worth of office transactions in the 12 months to December 2014 in the Perth Metro area. This is down 81 percent from $1,702 million in the previous year, and down on the five year average of $1,045 million. During the same period 16 properties were sold, down from the previous year of 28, and down on the five year average of 35. The 'Foreign Investor' purchaser category was the most active in the investment market for the year ended December 2014, purchasing 66 percent of the stock sold (or $213 million worth of office transactions). However the Undisclosed category had the most transactions (5). Perth office stock has traditionally been purchased by domestic investors, yet is rapidly growing in esteem with offshore buyers as demonstrated by the two major transactions in of 2014. Offshore capital continues to look for opportunities in Perth due to its counter-cyclical nature with the eastern states allowing a level of diversification; Perth assets also tend to be higheryielding than those on the eastern seaboard. As a result of these factors, both domestic and foreign capital should continue to seek Perth assets with solid lease-expiry profiles, however transactional activity is limited by a dearth of stock being presented for sale. Market yields in the Perth CBD as at December 2014 are estimated to range between 7.50 percent and 8.75 percent for A Grade buildings, and between 8.75 percent and 10.25 percent for secondary grade buildings. The average yield for A Grade office buildings in the quarter to December 2014 is 8.13 percent, no change over the year. Capital values in the Perth CBD as at December 2014 are estimated to range from $6,571 to $10,000 per square metre for A Grade buildings, and between $3,854 and $6,000 per square metre for secondary grade buildings. Average capital values for A Grade properties are $8,154 per square metre, no change over the year. Perth Office Metropolitan Office Sales by Price Range ($m) (>$1m) December 2004 to December 2014 $1,800 $1,600 $1,400 $1,200 $1,000 $800 $600 $400 $200 $0 Dec 04 Dec 05 Dec 06 Dec 07 Dec 08 Dec 09 Dec 10 Dec 11 Dec 12 Dec 13 $1m-$24m $25m-$49m $50m-$75m >$75m Dec 14 Source: Savills Research 22 perth key office transactions 2014 [1] 130 Stirling Street, Perth Price: $90.00 million Date: February 2014 Initial Yield: 8.21% Market Yield: 8.24% Rate per sq m of NLA: $7,288 Vendor: Charter Hall Purchaser: Hiap Hoe Limited Comment: The property comprises a modern eight level commercial office building with floor plates ranging between approximately 2,700 square metres and 3,075 square metres and providing approximately 485 tenantable car bays, 236 of which are for the use by the subject property whilst the remaining bays are for the use of the adjoining ‘Hatch’ building. The four uppermost levels comprise office uses, whilst the remaining floors comprise predominantly parking bays. [1] 23 [2] Septimus Roe Square, 256 Adelaide Terrace, Perth [4] 2 20 St Georges Terrace, Perth Price: $35.00 million Price: $80.00 million Date: November 2014 Date: April 2014 Initial Yield: N/A Initial Yield: 10.72% Market Yield: N/A Market Yield: 9.22% Rate per sq m of NLA: $3,806 Gucce Holdings Rate per sq m of NLA: $5,136 Vendor: Vendor: Aspen Group Purchaser: Far East Organisation Purchaser: Kay and Nicola Giorgetta Comment: Septimus Roe Square, originally CAGA Centre, is an 18 level office building constructed in 1976 with a retail terrace at ground level. The building comprises a net lettable area of approximately 17,719 square metres with typical office floor plates of approximately 1,046 square metres. Parking is available for 123 vehicles with some 83 bays in the basement and a further 40 open bays. The ground floor and upper levels are serviced by six lifts separated into two banks of three. [3] [3] R SM Bird Cameron Building, 8 St Georges Terrace, Perth Comment: This 10 storey building was completed in 1984 and provides parking for 46 cars. It was sold with over 70 percent of the building available for lease. Price: $26.00 million Date: March 2014 [5] M arketforce Building, 1314 Hay Street, West Perth Initial Yield: 10.53% Price: $9.05 million Market Yield: N/A Date: June 2014 Initial Yield: 7.22% 9.22% Rate per sq m of NLA: $5,709 Vendor: Blackstone Group Market Yield: Purchaser: GE Real Estate Rate per sq m of NLA: $4,783 Comment: The building was completed in 1989. Predominantly occupied by RSM Bird Cameron with a lease expiring in 2018. Other tenants in the building sub-lease. There is parking at the rear of the property for 17 cars. Vendor: Millgate Nominees Pty Ltd Purchaser: Ascot Capital Comment: A three level modern office building consolidated in 1982. The building provides parking for 40 cars. An upgrade of some facilities was undertaken in 2004. 24 25 sydney Savills has recorded approximately $6,665 million worth of office transactions in the 12 months to December 2014 in the Sydney Metro area. This is up 21 percent from $5,527 million in the previous year, and up on the five year average of $3,941 million. During the same period 107 properties were sold, up from the previous year of 90, and up on the five year average of 72. The 'Foreign Investor' purchaser category was the most active in the investment market for the 12 months to December 2014, purchasing 44 percent of the stock sold (or $2,885 million worth of office transactions). Similarly the 'Foreign Investor' category had the most transactions (37). ‘Institutional Investors’ have been ‘net sellers’ of Sydney CBD office buildings since 2008, divesting just over $8.7 billion of office assets and purchasing $5.4 billion. Indeed, in the 12 months to December 2014 these types of investors were net sellers of $926 million, purchasing $1,635 million and divesting $2,561 million. Market yields in the Sydney CBD as at December 2014 are estimated to range between 6.25 percent and 7.00 percent for A Grade buildings, and between 7.00 percent and 8.50 percent for secondary grade buildings. The average yield for A Grade office buildings in the quarter to December 2014 is 6.63 percent, a 13 basis point firming over the last 12 months. Capital values in the Sydney CBD as at December 2014 are estimated to range from $8,571 to $13,600 per square metre for A Grade buildings, and between $5,294 and $8,357 per square metre for secondary grade buildings. Average capital values for A Grade properties are $10,943 per square metre, a 1.9 percent increase over the last 12 months. Sydney Office Metropolitan Office Sales by Price Range ($m) (>$5m) December 2004 to December 2014 $7,000 $6,000 $5,000 $4,000 $3,000 $2,000 $1,000 $0 Dec 04 Dec 05 Dec 06 Dec 07 Dec 08 Dec 09 Dec 10 Dec 11 Dec 12 Dec 13 $5m-$24m $25m-$49m $50m-$75m >$75m Dec 14 Source: Savills Research 26 sydney key office transactions 2014 [1] 5 2 Martin Place, Sydney Price: $555.00 million Date: July 2014 Initial Yield: 5.17% Market Yield: 5.51% Rate per sq m of NLA: $14,122 Vendor: Queensland Investment Corporation Purchaser: REST Industry Super Comment: Comprises a refurbished 36 level A Grade office building together with three levels of retail space, a former banking chamber atrium and 128 car spaces. The largest single asset office transaction in Australia for the last five years. [1] 27 [2] [3] [2] 275 Kent Street, Sydney (50%) [3] 1 33 Castlereagh Street, Sydney (50%) [4] 5 70 George Street, Sydney Price: $435.00 million Price: $194.25 million Price: $151.80 million Date: April 2014 Date: February 2014 Date: March 2014 Initial Yield: 6.67% Initial Yield: 6.99% Initial Yield: 5.68% Market Yield: 6.88% Market Yield: 7.06% Market Yield: 5.42% Rate per sq m of NLA: $11,280 Rate per sq m of NLA: $11,968 Rate per sq m of NLA: $7,887 Vendor: Vendor: Stockland Property Group Vendor: Energy Australia Purchaser: Far East Organisation Mirvac Group Purchaser: Blackstone Real Estate Asia Comment: Westpac Place comprises a 33 level Premium Grade office (74,593 square metres) building together with retailing (2,532 square metres including the child care centre) and 214 basement car spaces located in the heart of the Western Corridor. Purchaser: Investa Property Group Comment: Piccadilly Tower, a 31-storey office tower completed in 1991. There are two lobbies, the main Castlereagh entrance and a smaller northern entrance to floors used by Wesley Mission. Comment: Property was sold following an international expressions of interest campaign. The property is considered as a residential development option, assuming vacant possession achieved after June 2016. 28 sydney key office transactions 2014 (cont.) [6] [5] [5] 6 6 Goulburn Street, Sydney [7] [6] 6-10 O'Connell Street, Sydney [7] 10 Shelley Street, Sydney (50%) Price: $136.00 million Price: $134.95 million Price: $130.60 million Date: June 2014 Date: June 2014 Date: April 2014 Initial Yield: 9.10% Initial Yield: 6.94% Initial Yield: 9.52% Market Yield: 7.47% Market Yield: 7.49% Market Yield: 6.37% Rate per sq m of NLA: $5,868 Rate per sq m of NLA: $8,263 Rate per sq m of NLA: $9,285 Vendor: Australand Property Trust & Mirvac PFA Diversified Property Trust Vendor: Blackrock Investment Management Vendor: Dexus/CPPIB Purchaser: GDI Property Group Comment: Comprises a 25 level A Grade office tower completed in 2004 and located to the southern edge of the Midtown precinct. The tower comprises basement level parking (for 54 single bays), ground floor foyer and retail space, together with 24 upper levels of office accommodation. Purchaser: Investa Property Group Comment: The sale represents an uplift of approximately 27 percent on the previous sale in October 2012 with similar occupancy, indicating both a lift in market rents and a firming of investment parameters. Purchaser: Brookfield Asset Management Comment: The property formed part of a four asset portfolio that DEXUS/CPPIB agreed to sell to GWOF as part of the CPA transaction. The agreed price for the 50 percent interest was $130.6 million and subsequently the co-owner exercised their pre-emptive acquisition rights. Brookfield Office Properties now owns 100 percent of the property. 29 [9] [8] 5 0 & 54-58 Park Street, Sydney [9] 255 George Street, Sydney (25%) [10] 59 Goulburn Street, Sydney Price: $126.80 million Price: $116.00 million Price: $90.20 million Date: February 2014 Date: February 2014 Date: April 2014 Initial Yield: 5.02% Initial Yield: 6.30% Initial Yield: 6.98% Market Yield: 5.20% Market Yield: 6.62% Market Yield: 8.32% Rate per sq m of NLA: $6,011 Rate per sq m of NLA: $11,606 Rate per sq m of NLA: $4,621 Vendor: Kyko Group Vendor: Purchaser: Far East Organisation Vendor: Brookfield Asset Management Comment: 54–58 Park Street is the consolidation of three separate buildings and provides basement, ground floor loading dock/delivery area, two external retail tenancies and 12 upper office floors. Mooted for residential conversion over the medium-term. Purchaser: AMP Capital Comment: NAB House comprises a 30 level A Grade office building occupying a prominent location in the Core precinct. The property was completed in 1985 and underwent a $42 million refurbishment in 2011 including foyer, NAB office accommodation and building services. harter Hall Office C Trust Purchaser: Roxy Pacific Holdings Ltd Comment: The property comprises a 28 level B Grade commercial office building completed in 1973 and substantially redeveloped in 2000, located in the Southern precinct. It comprises three levels of parking (124 spaces), lower ground and ground floor office/retail space. savills key contacts Australian Capital Territory New South Wales Queensland Research Simon Hemphill +61 (0) 2 8215 8892 [email protected] Research Simon Hemphill +61 (0) 2 8215 8892 [email protected] Research Paul Day +61 (0) 7 3002 8860 [email protected] Valuations Phil Harding +61 (0) 2 6221 8293 [email protected] Valuations Lester Alvis +61 (0) 2 8215 8857 [email protected] Valuations Lawrence Devine +61 (0) 7 3002 8822 [email protected] Sales & Leasing Theo Dimarhos +61 (0) 2 6221 8275 [email protected] Capital Transactions Ian Hetherington +61 (0) 2 8215 8925 [email protected] Capital Transactions Anthony Ott +61 (0) 7 3002 8904 [email protected] Project Management Mitchell Thomas +61 (0) 2 6221 8294 [email protected] International Investments Ben Azar +61 (0) 2 8215 8824 [email protected] Office Leasing John McDonald +61 (0) 7 3002 8847 [email protected] Office Leasing Rob Dickins +61 (0) 2 8215 8833 [email protected] Asset Management Chris Ainsworth +61 (0) 7 3002 8831 [email protected] Asset Management Howard Chapman +61 (0) 2 8215 8870 [email protected] Project Management Gary Finnegan +61 (0) 7 3018 6703 [email protected] Project Management David Nicholas +61 (0) 2 8913 4813 [email protected] Sunshine Coast Dustin Welch +61 (0) 7 5313 7519 [email protected] Gold Coast Kevin Carmody +61 (0) 7 5509 1700 [email protected] South Australia Victoria Western Australia Research Tony Crabb +61 (0) 422 221 604 [email protected] Research - National Tony Crabb +61 (0) 422 221 604 [email protected] Research Tony Crabb +61 (0) 422 221 604 [email protected] Valuations Alastair Johnston +61 (0) 8 8237 5041 [email protected] Research - VIC Glenn Lampard +61 (0) 3 8686 8034 [email protected] Valuations Mark Foster-Key +61 (0) 8 9488 4145 [email protected] Capital Transactions Peter Isaksson +61 (0) 8 8237 5020 [email protected] Valuations Francis Lynch +61 (0) 3 8686 8024 [email protected] Capital Transactions Paul Craig +61 (0) 8 9488 4156 [email protected] City & Metropolitan Sales Steve Bobridge +61 (0) 8 8237 5015 [email protected] Capital Transactions Dominic Long +61 (0) 3 8686 8031 [email protected] Sales & Investment Miles Rowe +61 (0) 8 9488 4116 [email protected] Office Leasing Adam Hartley +61 (0) 8 8237 5043 [email protected] City & Metropolitan Sales Clinton Baxter +61 (0) 3 8686 8021 [email protected] Office Leasing Graham Postma +61 (0) 8 9488 4153 [email protected] Asset Management Jeffrey Klaebe +61 (0) 8 8237 5018 [email protected] Office Leasing Mark Rasmussen +61 (0) 3 8686 8010 [email protected] Asset Management Jason Ridge +61 (0) 8 9488 4118 [email protected] Project Management Steve Christodoulou +61 (0) 8 8237 5004 [email protected] Asset Management Sarah Coster +61 (0) 3 8686 8025 [email protected] Project Management Graham Nash +61 (0) 8 6271 0306 [email protected] Project Management Chris Adam +61 (0) 3 9445 6841 [email protected] With a rich heritage and a reputation for excellence that dates back to 1855, Savills is a leading global real estate provider listed on the London Stock Exchange. Savills advises corporate, institutional and private clients, seeking to acquire, lease, develop or realise the value of prime residential and commercial property across the world’s key markets. Savills is expert in delivering results across all key commercial, retail, industrial and residential sectors in the following areas: Savills is a company that leads rather than follows with over 600 offices and associates throughout the UK, Europe, Americas, Asia Pacific, Africa and the Middle East. With over 27,000 staff, we seek out people who possess that rare mix of entrepreneurial flair and rock solid integrity, and are focused on delivering clients with advice and expertise of the highest calibre. Sales A powerful combination of global connections and deep local knowledge provides Savills with an almost unparalleled ability to connect people and property. Savills extensive Asia Pacific network spans 50 offices throughout Australia, New Zealand, China, Hong Kong, India, Indonesia, Japan, Korea, Macao, Malaysia, Myanmar, Philippines, Singapore, Taiwan, Thailand and Vietnam. In Australia, we offer the full spectrum of services from providing strategic advice to managing assets and projects and transacting deals. With a firmly embedded corporate culture that values initiative, innovation and integrity, clients receive outstanding service and can be assured of the utmost professionalism. Adelaide +61 (0) 8 8237 5000 Brisbane +61 (0) 7 3221 8355 Canberra +61 (0) 2 6221 8200 Gold Coast +61 (0) 7 5509 1700 Melbourne +61 (0) 3 8686 8000 Notting Hill +61 (0) 3 9947 5100 Parramatta +61 (0) 2 9761 1333 Perth +61 (0) 8 9488 4111 Sunshine Coast +61 (0) 7 5313 7500 Sydney +61 (0) 2 8215 8888 savills.com.au Leasing Valuations Asset Management Project Management Strategic Corporate Real Estate Services Property Accounting Facilities Management Luxury Residential Sales Residential Projects Research For Advice that gives Advantage, contact Savills.
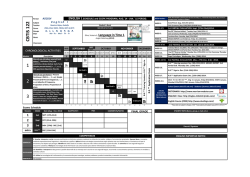
© Copyright 2026