
classifying planetary surfaces with results from texturecam
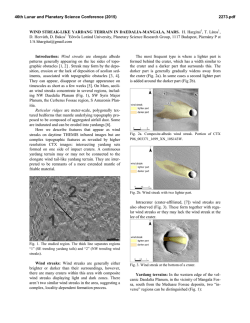
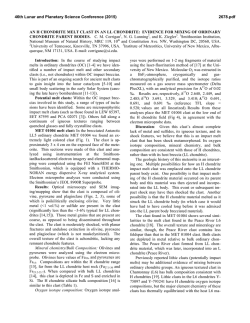
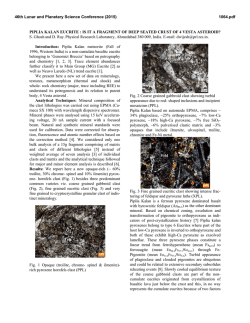
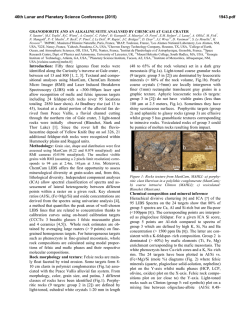
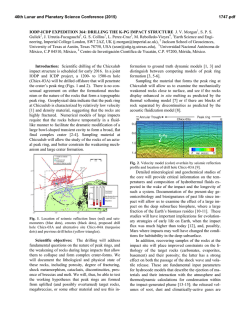
46th Lunar and Planetary Science Conference (2015)
2239.pdf
CLASSIFYING PLANETARY SURFACES WITH RESULTS FROM TEXTURECAM PROCESSING
WITH THE MOJAVE VOLATILES PROSPECTOR (MVP) ROVER MISSION.
N. E. Button1, J. R. Skok1, J. L. Heldmann2, D. Thompson3, K. Ortega3, R. Francis4, M. Deans2, D. Lees5, G. Garcia2, S. Karunatillake1
1
Louisiana State University, Department of Geology and Geophysics, Baton Rouge, LA 70803 ([email protected]);
2
NASA Ames Research Center, Mountain View, CA 94035; 3Jet Propulsion Laboratory, California Institute of
Technology, Pasadena, CA 91109; 4Centre for Planetary Science and Exploration, University of Western Ontario,
London, Canada; 5Carnegie Mellon University, Silicon Valley Campus, NASA Research Park, Moffett Field, CA
Introduction: The Mojave Volatiles Prospector
(MVP) rover mission was a mission simulation for a
real-time lunar polar Resource Prospector (RP) rover
mission as well as an opportunity to study the Mojave
Desert to understand the H2O emplacement, retention,
and distribution, which expands on the work of Wood
et al. [1, 2]. The mission simulation took place on October 20-24, 2014 with the rover located in the Mojave
Desert and the science team located at NASA Ames to
best simulate the reliance on rover imagery during an
extraterrestrial mission. The rover instrument suite
included a downward-pointing visible camera
(Groundcam), Hazard Cameras, Near Infrared and Visible Spectrometer Subsystem (NIRVSS), and Neutron
Spectrometer Subsystem (NSS).
Because the science team was located remotely, the
cameras provided the only real time visual observation
of the field site for use during operation, guidance,
hazard avoidance, and target selection. Groundcam
recorded observations perpendicular to the ground,
providing a 1m x 1m image. Understanding the surface
terrain is critical for understanding the subsurface distribution of H2O eolian processes, and weathering processes. Given the large number of images (4 per minute), we used an automatic pixel classification method, known as TextureCam, to categorize the surface
terrain in each of the images collected by the
Groundcam [3]. The underlying TextureCam algorithm
served as the primary automation tool, employing a
version of random forest classification described in
prior work [4].
Data and Methods: We use TextureCam to identify the surface terrain in each of the Groundcam images, which ultimately leads to terrain classification of
the field site traversed by the rover. The first step in
TextureCam processing is to manually color-code a
subset of images (typically fewer than 5) using a drawing program such as the GNU Image Manipulation
Program (GIMP), as shown in Figure 1. We identify
each terrain category by a different color. The types of
terrain were determined by visual, qualitative inspection of the Groundcam imagery at the beginning of the
mission session. We initially identified four terrain
types as: 1. Low albedo desert pavement, rocks, >65%
areal clast cover, and flat terrain; 2. High albedo wash
deposits with few rocks and small clast sizes; 3. Rocky
with larger rocks, scattered rocks within washes; 4.
High albedo patch with similar rock distributions as
Terrain 1, embedded within Terrain 1.
After color-coding representative images of each
terrain type, we train the pattern recognition system to
recognize these classes, storing the resulting model
with a “random forest file” [3]. The random forest file
can then be applied to any Groundcam image to produce an automatically color-coded result, as shown in
Figure 1c. This corresponds to the original color classification during the manual calibration stage. In order to
facilitate a synoptic understanding of the terrain across
the field site, the mission operations system summarized these images in an overhead map; it colored each
location by the areally dominant terrain type in Google
Earth using GPS data associated with the Groundcam
image.
The terrain classification was refined during the
mission session to a clast size classification. The three
clast size classifications are soil and fine pebbles, small
gravel, and cobbles. However, with this classification
system, terrain types are not identified because some
types of terrain may have a combination of clast sizes.
This classification could be used to develop a terrain
classification and may even produce a similar terrain
classification to the initial classification developed at
the start of the mission session.
Lastly, samples were collected from the field site to
groundtruth the mission data. Ther terrain types were
manually mapped and were developed with more detailed descriptions of the initial terrain classification. In
addition, we collected samples for cumulative areal
clast size distributions with the intent of applying advanced segmentation developed by [5]. The fieldwork
allowed us to understand the limitations of relying
solely on rover imagery data. Given the physical inaccessibility of field sites in future extraterrestrial missions, it is imperative to understand the limitations of
the imagery data, in order to ensure correct identification of surface terrain using TextureCam.
Results and Discussion: As this was the first attempt to use real time TextureCam processing to guide
other science results, we encountered several difficulties with producing a random forest file that would
correctly identify all the surface terrains traversed. One
complication was highly variable illumination, in
which portions of the terrain were directly sunlit, indirectly illuminated, or fully shadowed.
46th Lunar and Planetary Science Conference (2015)
Figure 1a) Groundcam
image (GroundCam01414009795.234124_gr
aylzw.tiff) representing
Terrain Type 1 (low
albedo desert pavement,
rocks, >65% clast cover, flat terrain). b) Manual
coloring
of
Groundcam
image
(GroundCam01414009795.234124_gr
aylzw.tiff). The color
blue is used to represent
Terrain Type 1. c) Automated coloring of
Groundcam
image
(GroundCam01414009795.234124_gr
aylzw.tiff)
produced
from TextureCam. The
majority of Terrain
Type 1 was correctly
identified (as represented by the blue) through TextureCam processing, but some areas were misidentified
as Terrain Types 2 and 3 (red and green, respectively).
Figure 2. Manual coloring of Terrain Type 2 (high
albedo wash deposits, few rocks, small particle sizes),
as represented by red (left) and Terrain Type 3 (rocky,
larger rocks, scattered rocks within washes), as represented by green (right).
These differences dramatically affected focus and apparent texture with a signal that was far larger than the
geologic distinctions we aimed to retrieve. The illumination changed slowly over time as the rover traversed
and changed directions, but these changes were often
independent of geologic content creating a strong confounding effect. This could be partially remedied
through standard preprocessing techniques and heuristic filtering. Nevertheless, uniform illumination will be
an important consideration for future attempts to derive
geologic content automatically from downwardpointing images. Color or spectral information could
also be incorporated in the classification, and might be
more robust than apparent texture to variability in the
magnitude and directionality of illumination.
2239.pdf
Visual observation of the Groundcam images to
identify each new traversed was used as verification
for the TextureCam processing. However, live processing will be essential for future extraterrestrial missions. We are able to use the collected data to conduct
post-processing to develop a working TextureCam
process. With successful post-processing, we will be
able to use TextureCam in future missions, specifically
the Resource Prospector (RP), a future lunar mission.
The fieldwork following the mission session also
demonstrated limitations with a terrain classification
developed solely from rover images. Although an extraterrestrial mission would have the same constraints
as MVP, we now have an understanding as to these
limitations and how TextureCam processing is subsequently affected.
During this fieldwork, we further identified the terrain types as: I. Desert pavement, dark toned, all size
variations, typically on broad rises, smooth, >90%
clast cover; II. Light toned pavement within Terrain I,
similar in texture to Terrain I; III. Continuous, small,
<4 cm, light toned, naturally >90% clast cover, easily
display underlying soils when disturbed, typically associated with ashes, observed in continuous lenses
from high to low and fills up local lows; IV. All clast
sizes, dominated >10 cm, typically adjacent to Terrain
III, associated with washes, forms local highs.
Through the MVP mission and follow-up fieldwork, we are able to show the benefits of TextureCam,
an automated process to identify surface terrains. Future work entails developing a quantified terrain type
classification combining clast size and areal extent, as
used both in terrestrial and Martian applications [6, 7,
8]. Furthermore, we will advance live, quantified, terrain classification with semi-automated sedimentological analyses [5, 9]. The computationally intensive nature of the latter – using morphological components,
entropy thresholds, and watershed algorithms -- would
best support post-traverse analyses.
References: [1] Wood, Y. A. et al. (2002) Journal
of Arid Environments 52 (3): 305-317 [2] Wood, Y. A.
et al. (2005) Catena, 59 (2): 205-230 [3] Wagstaff et
al. (2013) Geophys. Res. Letters, 40. [4] Bekkar et al.
(2014) Astrobiology, 14 (6): 486-501. [5]
Karunatillake, S. et al. (2014a) Icarus, 229: 400-407
[6] McGlynn, I. O. et al. (2011) Journal of Geophys.
Res., 116 (E7) [7] McGlynn, I. O. et al. (2012) Journal
of Geophys. Res.: Planets, 117 (E1) [8] Karunatillake,
S. et al. (2010) Journal of Geophys. Res.: Planets, 115
(E7) [9] Karunatillake, S. et al. (2014b) Icarus, 229:
408-417
A portion of this research was conducted at the Jet
Propulsion Laboratory, Pasadena, CA, under NASA
grant NNH10ZDA001N-ASTID. Louisiana Space
Grant also supported a portion of this research.


© Copyright 2026