
arXiv:1501.07406v1 [astro
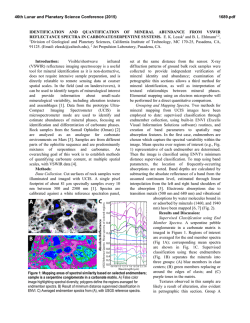
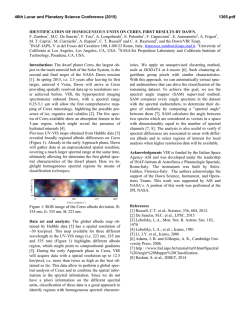
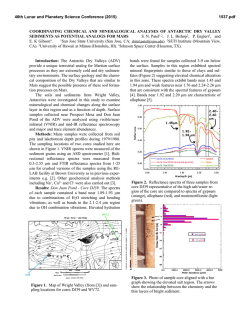
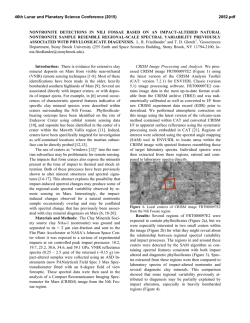
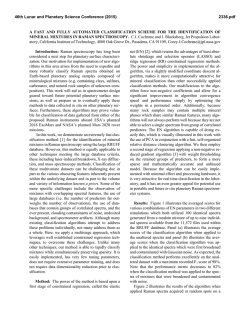
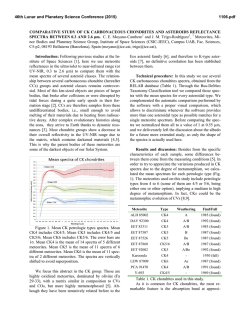
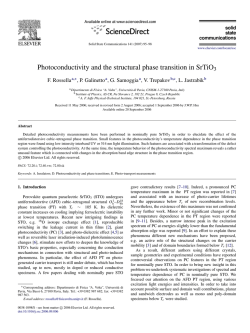
Astron. Nachr. / AN 999, No. 88, 789 – 799 (2006) / DOI please set DOI!
The power of low-resolution spectroscopy: On the spectral classification
of planet candidates in the ground-based CoRoT follow-up
M. Ammler-von Eiff1,2,⋆ , D. Sebastian1 , E.W. Guenther1,3 , B. Stecklum1 , and J. Cabrera4
1
arXiv:1501.07406v1 [astro-ph.SR] 29 Jan 2015
2
3
4
Th¨uringer Landessternwarte, Sternwarte 5, 07778 Tautenburg, Germany
Max-Planck-Institut f¨ur Sonnensystemforschung, Justus-von-Liebig-Weg 3, 37077 G¨ottingen, Germany
¨
Osterreichische
Akademie der Wissenschaften, Institut f¨ur Weltraumforschung, IWF, Schmiedlstraße 6, 8042 Graz,
Austria
Institute of Planetary Research, German Aerospace Center, Rutherfordstrasse 2, D-12489 Berlin, Germany
Received 30 May 2005, accepted 11 Nov 2005
Published online later
Key words
stars: fundamental parameters — techniques: spectroscopic — Catalogs
Planetary transits detected by the CoRoT mission can be mimicked by a low-mass star in orbit around a giant star. Spectral
classification helps to identify the giant stars and also early-type stars which are often excluded from further follow-up.
We study the potential and the limitations of low-resolution spectroscopy to improve the photometric spectral types of
CoRoT candidates. In particular, we want to study the influence of the signal-to-noise ratio (SNR) of the target spectrum
in a quantitative way. We built an own template library and investigate whether a template library from the literature is
able to reproduce the classifications. Including previous photometric estimates, we show how the additional spectroscopic
information improves the constraints on spectral type. Low-resolution spectroscopy (R ≈1000) of 42 CoRoT targets covering a wide range in SNR (1-437) and of 149 templates was obtained in 2012-2013 with the Nasmyth spectrograph at
the Tautenburg 2m telescope. Spectral types have been derived automatically by comparing with the observed template
spectra. The classification has been repeated with the external CFLIB library. The spectral class obtained with the external
library agrees within a few sub-classes when the target spectrum has a SNR of about 100 at least. While the photometric
spectral type can deviate by an entire spectral class, the photometric luminosity classification is as close as a spectroscopic
classification with the external library. A low SNR of the target spectrum limits the attainable accuracy of classification
more strongly than the use of external templates or photometry. Furthermore we found that low-resolution reconnaissance
spectroscopy ensures that good planet candidates are kept that would otherwise be discarded based on photometric spectral
type alone.
c 2006 WILEY-VCH Verlag GmbH & Co. KGaA, Weinheim
1 Introduction
The CoRoT1 mission has been the first space mission dedicated to the search for transiting planets
(Baglin et al. 2007). Overviews of the mission were
given by Baglin et al. (2009), Deleuil et al. (2011), and
Moutou et al. (2013). Statistics on candidates and planet
detections have been reported for several fields monitored by CoRoT (Cabrera et al. 2009; Carone et al. 2012;
Carpano et al. 2009; Cavarroc et al. 2012; Erikson et al.
2012; Moutou et al. 2009).
The goals of ground-based follow-up are manifold
(Carone et al. 2012; Carpano et al. 2009), among others the
precise derivation of the parameters of a detected planet.
While the CoRoT light curve constrains the radius of a
planet, ground-based radial-velocity (RV) measurements
are needed to derive its mass (Moutou et al. 2009). Only
the relative radius and mass of the planet are constrained.
⋆ Corresponding author: e-mail: [email protected]
1
Convection, Rotation & planetary Transits
Therefore, the absolute mass and the radius of the host star
have to be known very accurately.
False positives play an important role and lowresolution spectroscopy is a step towards their identification. In the case of a false positive, a planetary transit is
mimicked by other configurations (Brown 2003). The case
of a background eclipsing binary close to the actual target can be resolved by photometry (Almenara et al. 2009;
Guenther et al. 2013). The present work aims at another
kind of false positive. A planetary transit can be mimicked
by a low-mass star orbiting a giant star (see Cavarroc et al.
2012). The identification of giant stars relies on the availability of accurate spectral types.
A first clue about the spectral type of CoRoT targets is given by the CoRoT input catalogue (ExoDat2 ;
Deleuil et al. 2009) which is based on a massive UV Br′ i′
photometric survey carried out during the mission preparatory phase and has been updated continuously since then.
However, in regions of inhomogeneous extinction, it is difficult to obtain spectral class, luminosity class, and extinction
simultaneously. Although the photometric classification is
2
http://cesam.oamp.fr/exodat/
c 2006 WILEY-VCH Verlag GmbH & Co. KGaA, Weinheim
790
correct on average, it can be deviant for individual stars
(Sebastian et al. 2012). Therefore, spectroscopic information is needed to better assess stellar parameters of individual targets (cf. Carone et al. 2012; Gazzano et al. 2010).
Precise information is contained in atmospheric parameters like effective temperature and surface gravity. Those are
obtained most accurately from high-resolution spectroscopy
(e.g. Gazzano et al. 2013, for CoRoT). As the necessary
signal-to-noise ratio (SNR) can be hardly attained at high
spectral resoluton for faint stars, one needs to resort to lowresolution spectroscopy. Then, a precise measurement of atmospheric parameters is out of reach but spectral classification is still possible.
In practice, spectral classification is done by comparing stellar spectra to template spectra of well-known
stars, in particular MK standards. There are different approaches of how to obtain template spectra and to compare them to the target spectra. Computer-based classification has proven efficient. Sebastian et al. (2012) classified
more than 10,000 stars in the fields of CoRoT automatically and showed that an accuracy of one to two sub-classes
can be achieved. While templates are commonly taken from
libraries taken with other instruments (e.g. Gandolfi et al.
2008; Sebastian et al. 2012), the classification is considered
most accurate when the templates are taken from an internal library, i.e. have been observed with the same instrument and setup as the target spectra (Gray & Corbally 2009;
Wu et al. 2011a). Then, the full spectral range is available
for comparison and no convolution is needed to match the
spectral resolution.
A low-resolution spectrograph attached to an
intermediate-size telescope, like the Nasmyth spectrograph (R ≈ 1, 000) at the Tautenburg 2m telescope, offers
a sufficient dynamical range to observe the faint CoRoT
targets (V < 16 mag) as well as bright nearby template
stars. The Nasmyth spectrograph provides a wide spectral
range 360 − 935 nm covering a wealth of stellar features
which can be used for classification.
In the present study, we follow the initial work of
Guenther et al. (2012) and Sebastian et al. (2012). Based on
spectra taken with the Nasmyth spectrograph, we explore
the capabilities of low-resolution spectroscopy to derive the
spectral types of CoRoT targets. Of course, the accuracy of
spectral classification will depend on the signal-to-noise ratio (SNR) of the target spectra. In the course of the followup of planet candidates, a large number of stars has to be
classified efficiently and to the accuracy required. Since
telescope time is limited and the exposure time scales with
the square of the SNR, we are interested in a good knowledge of the required SNR.
The CoRoT targets were selected from various internal and public lists, in particular from Deleuil et al. (in
preparation) 3 . Most of the CoRoT objects are FGK stars
3 The present work includes a statistical study on the type and quality
of information available from spectral classification. Therefore, additional
follow-up information on particular planet candidates is not included here
c 2006 WILEY-VCH Verlag GmbH & Co. KGaA, Weinheim
Ammler-von Eiff et al.: Classification of CoRoT candidates
(Guenther et al. 2012) and these are the most interesting
planet host stars. How well does spectral classification distinguish giant stars and dwarf stars, especially at spectral
types F, G, and K?
We followed a two-fold approach. Firstly, we followed the canonical approach of spectral classification
(Gray & Corbally 2009) and built an internal library of
spectral templates with the same spectrograph and setup
used to observe the CoRoT targets. Secondly, a classification was done using templates from the Indo-US Coud´efeed library (CFLIB, Valdes et al. 2004), selected for its
good coverage of spectral types, luminosity classes, and
metallicity. We investigate whether this external library
gives similar results. Simultaneously, we analyse the impact
of the SNR of the target spectra on the results. In addition,
we compare the spectral types obtained to previous photometric classifications given by ExoDat. We identify the
merits of the inclusion of a spectroscopic classification over
a sole photometric classification.
Section 2 explains the selection of stars to build the internal template library. The observation of templates and
CoRoT targets is described in Sect. 3. Sect. 4 addresses the
data reduction and the coverage of the internal template catalogue is assessed in Sect. 5. We describe the steps of the
spectral classification in Sect. 6 and the results in Sect. 7.
The results are discussed in Sect. 8 before we conclude in
Sect. 9.
2 Selecting stars for a new library of
template spectra
The template stars need to fulfil a set of requirements. Of
course, the spectral types need to be known very well.
Having in mind quantitative spectral classification in future
work, we adopted as an additional criterion the availability
of accurate atmospheric parameters.
Although quantitative classification is beyond of the
scope of the present work, we point out here that it has many
advantages over the use of spectral types. There is no need
to use a conversion scale, e.g. from spectral type to effective temperature which is intrinsically prone to errors. Furthermore, it promises higher precision and flexibility than
the classification by spectral type which is limited by the
discreteness of the classification scheme. An extension of
the traditional grid of spectral types to include metallicity
or even abundance patterns would be too demanding. Instead, atmospheric parameters can be used defining a continuous grid which can be sampled by templates according to the requirements of the classification task. For previous work and reviews, see Bailer-Jones (2002); Cayrel et al.
(1991); Gray & Johanson (1991); Malyuto et al. (2001);
Singh et al. (2002); Stock & Stock (1999).
As another criterion, the template stars should be bright
so that spectra can be taken quickly with a high SNR. The
and a discussion of the status of individual candidates is beyond the scope
of the present work (but see Deleuil et al.).
www.an-journal.org
Astron. Nachr. / AN (2006)
templates should cover the range of spectral types of interest. In order to be able to classify most CoRoT targets, we
selected templates for early-type and Sun-like stars of different luminosity class from the CFLIB. Wu et al. (2011b)
obtained stellar parameters and chemical abundance homogeneously for the CFLIB library.
FGK dwarfs are the best targets to look for planets with
CoRoT. To fill the grid with templates, we selected wellstudied FGK stars from Fuhrmann (1998-2011). Several
of those are MK standards according to Gray & Corbally
(2009).
The work of Fuhrmann is restricted to solar-type mainsequence and sub-giant stars. However, in the distant
CoRoT fields, the fraction of early-type stars and giants is
relatively high. CoRoT covers these luminous stars more
completely but there is a lack of cooler main-sequence stars.
While early-type stars are covered by the CFLIB, we supplement the set of stellar templates with K giants compiled
by Doellinger (2008) who derived the stellar parameters and
iron abundance of 62 K giants.
3 Observations
All spectra were taken with the low-resolution long-slit
spectrograph mounted at the Nasmyth focus of the 2m Alfred Jensch telescope in Tautenburg (Germany). A slit width
of 1′′ was used to ensure a resolution of ≈ 1, 000. The
V200 grism was chosen as dispersing element, thus covering the visual wavelength range from 360 to 935 nm. It
is a BK7 grism with 300 lines per millimeter and a dispersion of 225 Åmm−1 . The detector is a SITe#T4 CCD with
2048x800 pixels and a pixel size of 15 µm. We used channel A with a gain of 1.11 µV per electron.
CoRoT monitors several stellar fields consecutively for
up to 40 days (short runs) or for up to 150 days (long runs).
These fields are selected in two opposite directions in the
sky where the galactic plane crosses the equatorial plane.
These are the so-called galactic centre and anti-centre-eyes
of CoRoT. Seasonal observations of the CoRoT fields are
possible in winter (galactic anti-centre) and summer (galactic centre) despite the high latitude of the observing site of
51◦ N. The CoRoT fields can be observed at an air mass of
approx. 1.5. A total of 42 CoRoT targets covering a brightness range of R = 11.0 − 15.5 was observed in February and
July 2012/2013 when the visibility of the CoRoT eyes was
best. Table 1 presents the journal of observations.
In addition, we have observed a set of 149 template stars
(Table 2). They are bright so that the SNR is high. Exposure
times range from a few seconds for the brightest template
stars to 30 min for the faintest CoRoT targets. In general, at
least two spectra were taken per target in order to remove
cosmics. While the usually faint CoRoT targets are observable only under good conditions for a few hours per night,
the bright template stars are distributed over the whole sky.
They perfectly fill the observing time when CoRoT targets
are not visible or when conditions are bad.
www.an-journal.org
791
Table 1
Journal of observations sorted by the SNR
achieved. The first two columns give the CoRoT and Win
identifiers. The Win identifier is composed of the CoRoT
run (LR=long run, SR=short run, IR=initial run; a=galactic
anti-centre, c=galactic centre; plus a consecutive number),
the CCD identifier (E1/E2), and a consecutive number. The
run ID identifies the spectroscopic runs carried out in February and July 2012/2013. The R band magnitude is followed
by the number of spectra taken per object. The last column
gives the SNR of the co-added spectra.
CoRoT ID
102634864
102627709
102580137
102698887
616759073
310153107
221699621
310155742
678658629
655228061
631424752
659668516
655049038
659714254
102901032
679896622
632089337
738282899
659676254
102770212
103970832
315219144
104833752
680074530
310170040
633100731
659718186
633496006
659473289
631423929
652180991
21160782
659714295
678656772
652345526
632279463
652312572
105314448
631900113
631423419
104992379
104992379
Win ID
LRa01 E1
LRa01 E2
LRa01 E2
LRa01 E1
SRa05 E2
LRc03 E2
SRa02 E1
LRc03 E2
LRc09 E2
LRc09 E2
LRc07 E2
LRc08 E2
LRc09 E2
LRc07 E2
LRa02 E1
LRc09 E2
LRc10 E2
LRa07 E2
LRc08 E2
LRa06 E2
LRc04 E2
SRa03 E2
LRc05 E2
LRc09 E2
LRc03 E2
LRc10 E2
LRc10 E2
LRc10 E2
LRc09 E2
LRc07 E2
LRc08 E2
SRc01 E1
LRc07 E2
LRc09 E2
LRc07 E2
LRc07 E2
LRc07 E2
LRc06 E2
LRc07 E2
LRc07 E2
LRc05 E2
LRc05 E2
3221
1578
4519
2240
3522
5079
1011
5451
3403
2479
2968
4203
0892
4203
4967
3338
3956
3354
4520
5287
5713
1073
3718
0548
0935
5093
0740
1984
0308
0158
0275
0346
0534
0131
0307
0146
0182
0119
0482
0187
0168
0168
run ID
Feb12
Feb12
Feb12
Feb12
Feb12
Jul13
Feb12
Jul13
Jul13
Jul13
Jul13
Jul12
Jul13
Jul13
Feb13
Jul13
Jul13
Feb13
Jul13
Feb13
Jul13
Feb13
Jul12
Jul12
Jul13
Jul13
Jul13
Jul13
Jul12
Jul12
Jul12
Jul13
Jul12
Jul12
Jul12
Jul12
Jul12
Jul12
Jul12
Jul13
Jul12
Jul13
R
15.2
13.3
15.4
14.2
13.9
14.0
14.0
14.6
14.7
14.5
13.7
14.6
13.9
14.9
15.5
15.2
13.9
15.3
14.6
15.5
15.5
14.5
14.7
13.6
13.8
13.8
13.1
14.5
11.0
12.2
13.3
12.7
12.4
12.3
13.0
12.6
12.0
12.8
12.8
12.3
12.0
12.0
#
3
1
3
3
3
1
2
3
3
2
2
2
1
3
4
4
2
4
3
4
6
3
5
2
3
4
2
1
1
2
4
1
2
2
4
2
2
4
4
2
2
2
SNR
1
8
16
22
37
40
60
71
71
73
78
80
82
83
89
89
101
103
105
107
109
125
126
126
130
132
134
141
141
179
179
187
196
219
226
240
248
265
277
293
322
437
c 2006 WILEY-VCH Verlag GmbH & Co. KGaA, Weinheim
792
Ammler-von Eiff et al.: Classification of CoRoT candidates
Table 2 Stellar templates observed with the Nasmyth spectrograph and their spectral type. The second column gives the
run ID which identifies the spectroscopic runs carried out in February and July 2012/2013.
HD number
run ID
spectral type
400
2628
6397
6920
10362
10476
10697
12303
12846
12953
15318
30614
34578
35296
37394
38114
39866
41117
41692
43247
43384
47839
47914
48682
50420
51530
52711
55575
58855
59747
59881
61295
62301
63433
65583
67228
72946
74280
75732
76151
82443
82621
84737
85235
86728
88983
89269
89744
90277
91752
Jul12
Feb12
Jul12
Jul12
Feb12
Jul12
Jul12
Feb12
Jul12
Feb12
Feb12
Feb12
Feb12
Feb12
Feb12
Feb12
Feb12
Feb12
Feb12
Feb12
Feb12
Feb12
Jul13
Feb12
Feb12
Feb12
Feb12
Feb12
Feb12
Feb12
Feb12
Feb12
Feb12
Feb12
Feb12
Feb12
Feb12
Feb12
Feb12
Feb12
Feb12
Feb12
Feb12
Feb12
Feb12
Feb12
Feb12
Feb12
Feb12
Feb12
F8IV
A7III
F4II-III
F8V
B7II
K1V
G5IV
B8III
G2V
A1Iae
B9III
O9.5Iae
A5II
F8V
K1V
G5
A2II
B2Iaevar
B5IV
B9II-III
B3Ib
O7Ve
K5III
G0V
A9III
F7V
G4V
G0V
F6V
G5V
F0III
F6II
F8V
G5IV
G8V
G1IV
G5V
B3V
G8V
G3V
K0V
A2V
G0.5Va
A3IV
G3Va
A8III
G5
F7V
F0V
F3V
c 2006 WILEY-VCH Verlag GmbH & Co. KGaA, Weinheim
HD number
run ID
spectral type
94028
94084
95128
96064
96833
97989
98281
99491
100563
101501
102328
102870
103095
104985
105546
105631
110897
117043
117176
120136
121560
122408
127334
128167
130948
132142
132254
136202
136729
139323
142373
151862
152614
153653
154431
154445
155514
157214
157681
158148
158633
160290
161797
162570
164136
164922
165401
167042
168009
168092
Feb12
Feb12
Feb12
Feb12
Jul13
Feb12
Feb12
Feb12
Feb12
Feb12
Feb12
Feb12
Feb12
Feb12
Feb12
Feb12
Jul12
Feb12
Feb12
Jul12
Feb12
Feb12
Feb12
Feb12
Feb12
Jul12
Feb12
Feb12
Feb12
Feb12
Jul12
Feb12
Feb12
Feb12
Feb12
Feb12
Feb12
Jul12
Jul13
Feb12
Jul12
Jul13
Jul13
Feb12
Feb12
Jul12
Jul13
Jul13
Jul13
Feb12
F4V
K2III
G1V
G8V
K1III
K0III
G8V
K0IV
F5V
G8V
K3III
F9V
G8Vp
G9III
G2IIIw
K0V
G0V
G6V
G5V
F6IV
F6V
A3V
G5V
F2V
G1V
F7V
F7V
F8III-IV
A4V
K3V
F8Ve
A1V
B8V
A7V
A5V
B1V
A8V
G0V
K5III
B5V
K0V
K1III
G5IV
A9V
F2II
K0V
G0V
K1III
G2V
F1V
HD number
run ID
spectral type
168151
168723
170693
172340
173667
173936
175823
176377
176524
178187
180554
180610
182488
182572
183144
184385
184499
185144
185269
186307
186408
186427
186815
187013
187691
187923
187961
188510
188512
189944
190228
191243
192699
193322
195810
196504
205139
206827
207970
208947
210839
210855
212978
215648
216385
218470
221830
222794
223385
Jul13
Jul13
Jul13
Jul13
Feb12
Feb12
Jul13
Jul13
Jul13
Feb12
Feb12
Jul13
Jul13
Jul13
Feb12
Jul13
Jul12
Jul13
Jul12
Feb12
Jul13
Jul13
Jul13
Jul12
Jul13
Jul13
Jul12
Jul12
Jul12
Feb12
Jul12
Feb12
Jul12
Feb12
Feb12
Feb12
Feb12
Jul12
Jul12
Feb12
Feb12
Jul12
Feb12
Jul12
Jul12
Jul12
Jul12
Jul12
Feb12
F5V
K0III-IV
K1.5III
K4III
F6V
B6V
K5III
G0
K0III
A4III
B4IV
K2III
G8V
G8IV
B4III
G8V
G0V
G9V
G0IV
A6V
G1.5V
G3V
K2III
F7V
F8V
G0V
B7V
G5Vw
G9.5IV
B4V
G5IV
B5Ib
G5
O9V
B6III
B9V
B1II
G2V
F6IV Vwvar
B2V
O6Iab
F8V
B2V
F7V
F7IV
F5V
F9V
G2V
A3Iae
www.an-journal.org
Astron. Nachr. / AN (2006)
4 Data reduction
The long-slit spectra have been reduced using the data reduction and analysis system IRAF5 (Tody 1986, 1993). This
procedure comprises bias subtraction, an automatic removal
of cosmic rays, and removal of pixel-to-pixel variations by
flat-field correction.
All spectra have been wavelength-calibrated using He
and Kr spectra. Using IRAF tasks, the wavelengths of
prominent lines have been identified and used to derive a
wavelength solution which has been applied to all stellar
spectra. The spectrograph is mounted at the fork of the telescope so that instrument flexure causes shifts depending on
the exact orientation of the telescope. Therefore, sky emission lines have been employed to apply corrections. For
each frame with a long exposure time of 20 minutes at least,
the sky lines are bright enough to use them as calibration
source (Osterbrock et al. 1996). They have been used to derive offsets to correct the wavelength scale. The corrections
were small and of the order of the resolution limit.
4 The full well was scaled to the saturation level obtained at setting ’50’
and then rescaled to setting ’20’.
5 IRAF is distributed by the National Optical Astronomy Observatories, which are operated by the Association of Universities for Research in
Astronomy, Inc., under cooperative agreement with the National Science
Foundation.
www.an-journal.org
OH(7−3)Q
OH(6−2)Q
OH(9−4)R
OH(8−3)R
OH(7−2)R
Na I 6154−61
[O I] 6300
[O I] 6364
Hg I 5461
[O I] 5577
Na I 5683−8
Hg I 5770−91
Na I D
1.5
Na I 4983
2.0
Hg I 4358
2.5
relative flux
In order to estimate the bias level and the read-out noise,
dark frames were taken with closed shutter and zero exposure time. In order to assess the pixel-to-pixel variation of
sensitivity, the wavelength-dependent transmission of the
spectrograph, and bad or hot pixels, flat-field frames were
taken pointing the telescope to a flat-field screen which is installed in the dome and illumated by an incandescent lamp.
In principle, the wavelength calibration can be done using sky emission lines in the long-slit spectra. However, the
sparseness of sky emission lines in the blue part of the spectra does not permit a precise calibration in this region. It is
the blue part of the spectrum which displays a wealth of features and is very valuable for spectral classification. Therefore, spectra of gas discharge lamps (He and Kr) were used
for wavelength calibration. At least one set of gas discharge
exposures was taken per observing run. A wavelength precision of a few Å is achieved this way and is sufficient for
the purpose of spectral classification.
To estimate the signal-to-noise ratio (SNR), we assumed
pure photon noise accounting for read-out noise. The total
system gain used depends on the amplifier setting chosen. In
the present case (setting ’20’), we estimated a total system
gain of 3.2 electrons per data unit using the full well at the
noise roll-over specified by the manufacturer (84,000 electrons)4 . The readout-noise amounts to 7.8 electrons. This estimate of the SNR is fully sufficient to compare the spectra
since all spectra were taken with the same instrument and
identical settings. The median is used to distinguish good
spectra with high signal and bad spectra with a high noise
level.
793
1.0
0.5
0.0
−0.5
4000
5000
6000
7000
wavelength [Å]
8000
9000
Fig. 1 The black line shows a Nasmyth spectrum of the
G0V star HD 157214. For comparison, a library spectrum
with medium resolution (Valdes et al. 2004) is shown (light
grey). To match the SED, the template spectrum was used to
adjust the flux of the Nasmyth spectrum. Both spectra were
normalised to unity at 5550 Å. In addition, the subtracted
night sky spectrum of the site is shown (grey) and is offset w.r.t. the stellar spectra for clarity. The most important
spectral features are indicated.
The sky background could be subtracted easily from
the long-slit spectra. For this purpose, long exposures provide an excellent source to analyse the night-sky emission
in Tautenburg. Figure 1 shows the Nasmyth spectrum of a
Sun-like star together with the subtracted sky-background.
The most prominent features in the night-sky spectrum
are the O I, Hg I, and Na I atomic lines, the broad continuum centred at 5890Å, and the OH bands in the red
part (Osterbrock & Martel 1992; Slanger et al. 2003). These
lines originate from the night glow as well as from artificial
sources. The broad continuum centered at 5890 Å is characteristic of the presence of artificial light and in this case originates from high-pressure sodium lamps used in the nearby
city of Jena, Germany.
The flux calibration of the spectra of CoRoT targets was
not possible because of the spectrograph design and the
high airmass of CoRoT targets. The orientation of the spectrograph slit cannot be adjusted and the slit-rotation of the
spectrograph depends on the hour angle of the object. This
leads to a dependency of the detected flux level on atmospheric refraction. In addition, the star is slightly moving on
the slit and the exact location on the slit cannot be reproduced. Therefore, the stellar continuum could not be recovered and used for classification. Instead, one has to rely on
spectral lines only and the continuum has to be adjusted to
match the continuum of the template (Fig. 2). Hence, the
comparison is restricted to the strength and the profile of
selected absorption lines.
5 The coverage of the new template library
The CFLIB and the new internal template library have many
stars in common. 54 CFLIB stars have been included in the
c 2006 WILEY-VCH Verlag GmbH & Co. KGaA, Weinheim
794
sample chosen from Fuhrmann (1998-2011). The Fuhrmann
sample does not cover all spectral types. Therefore, 55 stars
have been chosen from the CFLIB catalogue and reobserved
for the new library. In total, 109 CFLIB stars have been reobserved.
Within the present work, 149 template spectra of bright
stars have been taken. MK spectral types have been adopted
from Valdes et al. (2004) when available and from the SIMBAD database otherwise.
Table 3 shows the coverage in spectral type. The catalogue is being filled continuously but a good coverage has
already been achieved for dwarf stars. Particularly, FGK
dwarfs are densely covered. A finely graduated classification becomes feasible in the FGK regime.
6 Computer-based classification
The spectral types of the CoRoT targets have been obtained using a computer-based classification. The software
applied (described in Sebastian et al. 2012) compares all
target spectra to a library of template spectra. Each target
spectrum is matched to template spectra adjusting the radial velocity shift, the level of the continuum, and the slope
of the continuum. We selected spectral chunks that contain
sensitive lines for spectral classification thus removing parts
that are not useful for classification (see Fig. 2). Afterwards the χ2 is calculated and compared for each template
spectrum. The five best-matching templates are validated by
visual inspection. This validation rules out false classifications due to low S/N or stellar activity. The spectral type of
the best-matching validated template is adopted for the target spectrum. Guenther et al. (2012) found that the error bar
of this classification method depends on the spectral type
and the template library used. They analysed the accuracy
of the method on a sample of more than 3000 stars and
found that the accuracy of this method for low resolution
spectra is on average two subclasses. It is slightly better for
early-type stars (1.3 subclasses) and less accurate for solartype stars (2-3 subclasses). The classification is not affected
by rotational broadening since the spectral resolution of the
Nasmyth spectrograph is too low.
Firstly, we used the internal template library taken with
the Nasmyth spectrograph. In the second approach, we used
a set of 281 template spectra provided by CFLIB (Valdes
et al. 2004)6. To compare the CoRoT target spectra directly
with the CFLIB templates, we have to ensure that the resolution, the wavelength range, and the continuum flux level
are roughly the same. Since the Nasmyth spectra have been
taken with a resolution of ∼ 5 Å FWHM (at 5500 Å), we
convolved the CFLIB templates (∼ 1 Å FWHM) with a
Gaussian kernel.
For the comparison with internal templates, the full
wavelength range from 3600 to 9350 Å can be used in
Ammler-von Eiff et al.: Classification of CoRoT candidates
Table 3
The coverage of the new template library in
spectral type. At each spectral type, the number of templates
is given.
spectral
class
O6
O7
O9
O9.5
B1
B2
B3
B4
B5
B6
B7
B8
B9
A1
A2
A3
A4
A5
A6
A7
A8
A9
F0
F1
F2
F3
F4
F5
F6
F7
F8
F9
G0
G0.5
G1
G1.5
G2
G3
G4
G5
G6
G8
G9
G9.5
K0
K1
K1.5
K2
K3
K4
K5
I
1
II
luminosity class
II-III III III-IV
IV
V
1
1
1
1
1
1
1
1
1
1
1
1
1
1
1
1
1
1
1
1
1
1
1
1
1
1
1
1
1
2
1
1
1
1
1
4
1
1
2
3
1
3
1
1
3
1
1
1
1
2
1
1
1
1
1
1
1
1
1
1
1
1
1
1
1
1
1
1
1
1
1
3
3
6
6
2
8
1
2
1
4
3
1
8
1
8
1
4
2
1
6 These CFLIB templates have a high SNR of 100 at least and cover
almost the full range of spectral types.
c 2006 WILEY-VCH Verlag GmbH & Co. KGaA, Weinheim
www.an-journal.org
Astron. Nachr. / AN (2006)
7 Results
The results of the classification are listed in Table 4. First of
all, there are some interesting qualitative findings. In neither
case, the best-matching external template originates from
the same star as the best-matching internal template, in spite
www.an-journal.org
1.2
template
faint star
1
relative intensity
principle since the target spectra have been obtained with
the same spectrograph. However, especially the red part
of the covered wavelength region contains telluric bands.
The strength of these bands is variable. Although a correction of telluric bands is possible in principle, the scarcity
of useful features does not justify this effort. The strongest
telluric oxygen bands appear at 6884 Å (Catanzaro 1997).
Therefore, the wavelength region applied here starts in the
blue at 3950 Å where we get sufficient signal and ends at
6800 Å at the blue edge of the oxygen bands. In the extreme
red, there is a very short range of ≈ 400 Å not strongly
affected by telluric absorption. This region contains three
prominent CaII lines (8498, 8542, and 8662 Å) at almost all
spectral types which can be used for spectral classification
(Gray & Corbally 2009). For early-type stars, some HI lines
of the Paschen series were included in addition. In spite of
some night-sky emission lines that could affect the spectra
(see Fig. 1), we chose the region from 8400 to 8880 Å in
addition to the blue part (4200 − 6800 Å) for comparison
(Fig. 2). For spectra with low SNR, we had to set the blue
edge to 4800 Å to skip the blue part with very low signal.
When using the external CFLIB templates, the wavelength range is limited to the overlapping region of the
CoRoT target spectra and the CFLIB templates. In particular, the very red part with the Ca II triplet and the Paschen
series cannot be used. Moreover, parts with strong telluric
absorption had to be excluded again and once more, the
wavelength range had to be reduced to 4800 − 6850 Å in
the case of noisy spectra.
The design of the spectrograph does not allow one to
reproduce the continuum flux (Sect. 4) so that the continuum flux could not be used for classification. Therefore, the
CoRoT spectra and the Nasmyth templates were normalised
and seven chunks (five in the case of low SNR, resp.) were
compared separately (Fig. 2). This way, the influence of the
unknown absolute flux level and the extinction was optimally removed. This method ensures that the spurious continuum flux levels of both spectra do not distort the results
of the classification.
The CFLIB templates are not flux-calibrated either but
Valdes et al. (2004) recovered the SED of the CFLIB spectra from spectrophotometric templates. In order to compare
the Nasmyth spectra and the CFLIB templates, they were
normalised again in an appropriate way and compared in
different chunks.
Figure 2 shows the comparison of a CoRoT target to
its best-matching Nasmyth template. In this case, the target spectrum matches the spectrum of HD 121560 perfectly
(spectral type F6V).
795
0.8
0.6
0.4
0.2
0
4000
5000
6000
7000
8000
9000
wavelength (Å)
Fig. 2 Comparison of a target spectrum (grey line) with
the best-matching template (black line). The vertical lines
mark the borders of chunks which are compared separately
and used to adjust the continuum level of the spectra.
of a high number of stars common to both libraries. Also
it occurs that an external template spectrum matches another CoRoT object. The CFLIB spectrum of HD 120136
matches LRc05 E2 3718 while the Nasmyth spectrum of
HD 120136 matches the spectrum of LRc07 E2 0182. Apparently, the CFLIB spectrum of HD 120136 is as different
from the Nasmyth spectrum as is the difference between the
spectra of LRc07 E2 0182 and LRc05 E2 3718. Although
both stars are late-F or early-G type stars, we note, that
the SNR of the spectrum of LRc05 E2 3718 is only half
of that of LRc07 E2 0182. Interestingly, the Nasmyth spectrum of HD 84737 matched Nasmyth spectra of as many as
five CoRoT objects. Again, the SNR is obviously important
since all the five target spectra suffer from low signal!
The qualitative discussion above shows that the SNR
plays a role. A more quantitative presentation of the data
confirms that the agreement depends on the noise level of
the CoRoT target spectra (Fig. 3(a)). Fig. 4 presents another view on the data by projecting along the noise axis and
showing the distribution of the residuals separately for the
good and bad spectra. The spread tends to increase with decreasing signal, i.e. the strongest discrepancies are usually
encountered for spectra of least quality. At highest signal,
the discrepancies tend to vanish.
The mean difference in spectral type is as low as 2 subclasses when considering the good spectra only. Remarkably, hardly any systematic offsets or trends are seen in our
sample.
The distribution of residuals appears far from normal in
the case of the bad spectra. In the case of the good spectra, however, an identification of outliers seems possible.
There are two outliers in spectral type, LRc09 E2 0308 and
LRc05 E2 3718. The deviation cannot be readily explained
since the SNR is reasonably good.
The spectroscopic classifications were compared with
photometric classifications taken from the online version of
ExoDat as of May 16th , 2014. We note that the scatter is increased for bad spectra (Figs. 3(b), 3(c)). But even for good
spectra, the scatter is dramatically larger and we note that
photometry tends to assign earlier spectral types. The level
c 2006 WILEY-VCH Verlag GmbH & Co. KGaA, Weinheim
796
Ammler-von Eiff et al.: Classification of CoRoT candidates
Table 4
Results of spectral classification (sorted by SNR). The table contrasts the classification obtained via two different sets of templates – the internal library obtained by us with the Nasmyth spectrograph and the template library of
Valdes et al. (2004) (CFLIB). LRc10 E2 1984 is an M star for which no template was taken with the Nasmyth spectrograph.
Win ID
LRa01
LRa01
LRa01
LRa01
SRa05
LRc03
SRa02
LRc03
LRc09
LRc09
LRc07
LRc08
LRc09
LRc07
LRa02
LRc09
LRc10
LRa07
LRc08
LRa06
LRc04
SRa03
LRc05
LRc09
LRc03
LRc10
LRc10
LRc10
LRc09
LRc07
LRc08
SRc01
LRc07
LRc09
LRc07
LRc07
LRc07
LRc06
LRc07
LRc07
LRc05
LRc05
E1 3221
E2 1578
E2 4519
E1 2240
E2 3522
E2 5079
E1 1011
E2 5451
E2 3403
E2 2479
E2 2968
E2 4203
E2 0892
E2 4203
E1 4967
E2 3338
E2 3956
E2 3354
E2 4520
E2 5287
E2 5713
E2 1073
E2 3718
E2 0548
E2 0935
E2 5093
E2 0740
E2 1984
E2 0308
E2 0158
E2 0275
E1 0346
E2 0534
E2 0131
E2 0307
E2 0146
E2 0182
E2 0119
E2 0482
E2 0187
E2 0168
E2 0168
templates taken with
the Nasmyth spectrograph
SNR spec. type templ.
spec.
type
(Exodat)
1 A5V
HD139323 K3V
8 A5V
HD210855 F8V
16 A5IV
HD136729 A4V
22 A5V
HD61295 F6II
37 O5V
HD136729 A4V
40 G5II
HD47914 K5 III
60 F8IV
HD102870 F9V
71 K3I
HD99491 K0IV
71 G8V
HD84737 G0.5Va
73 K0III
HD47914 K5 III
78 G5III
HD184385 G8V
80 A0V
HD2628
A7III
82 K5III
HD160290 K1III
83 G0IV
HD84737 G0.5Va
89 A5IV
HD128167 F2V
89 A0V
HD136729 A4V
101 K2III
HD84737 G0.5Va
103 A2V
HD39866 A2II
105 A5IV
HD84737 G0.5Va
107 G0IV
HD168151 F5V
109 A5IV
HD165401 G0V
125 F8V
HD91752 F3V
126 F8IV
HD84737 G0.5Va
126 F8IV
HD10697 G5IV
130 G0V
HD215648 F7V
132 K0III
HD170693 K1.5III
134 K3III
HD157681 K5III
141 —
—
—
141 B1V
HD157214 G0V
179 F8IV
HD216385 F7IV
179 G8V
HD192699 G5
187 A0V
HD41692 B5IV
196 G5III
HD180610 K2III
219 G0V
HD168723 K0III-IV
226 F5IV
HD173667 F6V
240 F0V
HD210855 F8V
248 A5V
HD120136 F6IV
265 F8IV
HD187013 F7V
277 A5IV
HD215648 F7V
293 F8IV
HD215648 F7V
322 F8IV
HD176377 G0
437 F8IV
HD176377 G0
of agreement is the same whatever the choice of the template library - internal or external.
Sebastian et al. (2012) showed that for solar-type stars
the computer-based spectral classification cannot distinguish between main-sequence stars and sub-giants but
between main-sequence stars and giants or super-giants.
Therefore, we distinguish giant-like (I, II, III, III-IV) and
dwarf-like luminosity classes (IV, V); also because of the
low numbers in the present work. The luminosity classification based on the two different sets of templates is compared in a statistical sense (Table 5). Each field contains
the number of CoRoT targets with corresponding classifications. Again, good and bad spectra are distinguished. The
total number of good(bad) spectra is 21(20). 15(10) stars
c 2006 WILEY-VCH Verlag GmbH & Co. KGaA, Weinheim
templates taken from
Valdes et al. (2004)
templ.
spec.
type
HD190390 F1III
HD158352 A8V
HD173495 A1V+
HD150453 F3V
HD177724 A0Vn
HD232078 K3IIp
HD16673 F6V
HD34255 K4Iab:
HD177249 G5.5IIb
HD178717 K3.5III:
HD5286
K1 IV
HD186377 A5III
HD175306 G9 IIIb
HD39833 G0 III
HD204363 F7V
HD177724 A0 Vn
HD191615 G8 IV
HD168270 B9V
HD128987 G6V
HD150453 F3V
HD130948 G1 V
HD56986 F0IV
HD120136 F6IV
HD128987 G6V
HD204363 F7 V
HD5286
K1 IV
HD34255 K4Iab:
HD126327 M7.5 III
HD115617 G5V
HD136064 F9IV
HD76813 G9III
HD168199 B5 V
HD112127 K2.5III
HD149661 K2V
HD150012 F5IV
HD136064 F9IV
HD61064 F6III
HD59380 F8V
HD62301 F8V
HD59380 F8 V
HD39587 G0V
HD39587 G0V
are dwarf-like according to either set of templates while
there is agreement on a giant-like luminosity class for 2(4)
stars. Still, there is substantial disagreement for 4(6) stars.
Two(four) dwarf-like stars are given giant-like classifications when using the CFLIB templates and 2(2) giant-like
stars are assigned dwarf-like classifications. In summary,
only 19 % of the classifications of good spectra are not reproduced by the external library compared to 30 % of the
classifications of the bad spectra.
The contingency tables are reproduced for the comparisons with the photometric classification from ExoDat (Tables 6, 7). When comparing the internal library with ExoDat, there are 1(6) off-diagonal elements. Comparing the
CFLIB to ExoDat, there are 3(6) off-diagonal elements.
www.an-journal.org
Astron. Nachr. / AN (2006)
797
Table 5 Contingency table showing the agreement of luminosity classifications obtained with the external CFLIB
template library and the internal Nasmyth library. The number of classifications based on good spectra is shown and
succeeded in brackets by the number of classifications based
on bad spectra. Good and bad spectra are distinguished using the median of the SNR (cf. Fig. 3). The solid lines in the
table divide giant-like classes and dwarf-like classes.
CFLIB templates
I
II
III
III-IV
IV
V
I
Nasmyth templates
II
III III-IV IV
1
(1)
(1)
1(3)
1
1
(2)
V
(1)
1(2)
1
2
1
4(2)
8(8)
Table 6
Contingency table showing the agreement of
spectroscopic and photometric luminosity classifications:
internal Nasmyth catalogue vs. photometric Exodat classification. The layout follows Table 5.
Exodat
I
II
III
III-IV
IV
V
I
II
(2)
Nasmyth templates
III III-IV IV
(1)
(1)
3(2)
(2)
2
2
8(6)
5(5)
(1)
1
V
Table 7
Contingency table showing the agreement of
spectroscopic and photometric luminosity classifications:
CFLIB catalogue vs. photometric Exodat classification. The
layout follows Table 5.
Exodat
I
II
III
III-IV
IV
V
I
(1)
II
CFLIB templates
III III-IV
IV
V
(1)
1
(1)
1(2)
1(2)
(1)
2(2)
3
2
7(5)
4(5)
For an update of the status of CoRoT candidates with
a spectroscopic classification, we recommend a rather conservative approach in order to not discard planet candidates
prematurely. For the present sample and for the discussion
below, we adopt a giant-like luminosity class only in the
case that both template libraries yield a giant-like classification. Five out of these 6 stars were classified giants by photometry, too. Furthermore, we identified seven early-type
stars (F3 or earlier), six out of these also early-type according to ExoDat.
However, there is disagreement in several cases. Intriguingly, seven stars are early-type according to photometry but
late-type according to spectroscopy, affecting almost half of
www.an-journal.org
the photometric early-type targets. Furthermore, 2 out of 9
giants are actually dwarf stars. There is no single late-type
star which turned out early-type. Only one early-type dwarf
turned out a giant.
8 Discussion
We obtained target and template spectra with the same instrument in order to avoid any systematic effects which
might be introduced by the use of another instrument. This
involves a major effort since a large number of spectral types
has to be covered. As many as 149 template stars have been
observed to cover different luminosity classes and chemical
abundance patterns. Although the coverage is not yet complete, it is very dense.
One of the main goals was to find out whether an external template catalogue, here the CFLIB, can be used
to reproduce the results of a classification with an internal library. The best-matching template stars found in the
present work show that the outcome mainly depends on
the SNR of the target spectra. At sufficiently high SNR
(≥ 100), the mean difference in spectral type is still within
the internal uncertainties of the method of a few sub-classes
(Guenther et al. 2012; Sebastian et al. 2012). Also a discrepancy of the luminosity classification occurred more often in the case of bad target spectra. Although this assessment is based on small numbers, too, it ascribes at least part
of the discrepancy to noise.
The agreement in spectral class for good target spectra
gives high confidence in the use of external templates. In
contrast, the photometric classification deviates by up to an
entire spectral class. Nevertheless, as the scatter w.r.t. photometry increases for spectra with bad SNR, we conclude
- as is expected - that the spectral classification is not able
to provide accurate spectral types if the signal is too low.
The photometric ExoDat classification of luminosity performs as well as a spectral classifiation employing the external library. In this respect, the present work extends the
work of Sebastian et al. (2012) who derived spectral types
from AAO spectra using templates from CFLIB and who
compared the results to ExoDat classifications.
The comparison of the spectroscopic and photometric classifications shows that photometry favours early-type
classifications (cf. Fig. 3). Half of them turned out latetype stars which is roughly in line with the findings of
Sebastian et al. (2012) who showed that 30 % of the photometric A and B stars are actually late-type stars. Planet
search campaigns often remove early-type targets from the
list of candidates since the radial velocity follow-up of such
objects can be challenging. Moreover, the low-resolution
spectroscopy was able to identify 2 dwarf stars among 9
photometric giants. Giant stars are excluded from followup since the transit signature would be due to a low-mass
star rather than a planet. This way, low-resolution spectroscopy can recover good candidates among early-type targets (50 %) and giant stars (25 %) discarded otherwise. For
c 2006 WILEY-VCH Verlag GmbH & Co. KGaA, Weinheim
798
the present work, we studied 17 late-type dwarf stars which
are particularly interesting for follow-up. None of these
turned out a giant so that photometry performs much better in this case.
9 Summary and Conclusions
Within the ground-based follow-up of CoRoT targets we
took low-resolution spectra of 42 objects with the lowresolution Nasmyth spectrograph in Tautenburg.
The spectra of the CoRoT targets were classified using two different sets of templates, an internal template library taken with the same instrument as the target spectra
and the external CFLIB library. Although the internal library comprises spectra of 149 stars, the coverage is not
fully complete and will be complemented in upcoming observing runs. The use of the new set of templates to refine
preliminary classifications is intriguing. The new template
grid is densest in the regime of F and G dwarfs which is
most promising for planet detections with CoRoT.
We found that the use of external library spectra yields
similar results when the signal-to-noise ratio of the target
spectrum is sufficiently high (≥ 100). However, the luminosity classification with an external library does not perform better than a photometric classification. Therefore, it
seems feasible to resort to a less costly photometric luminosity classification when an internal template library is not
available.
As an aside, we know the atmospheric parameters of the
matching templates. Therefore, a quantitative classification
by atmospheric parameters becomes feasible, including effective temperature and surface gravity along with chemical abundances. This might disentangle the well-known degeneracy in spectral classification due to unknown metallicity that may certainly affect the present work. Also, the
follow-up of transit-planet candidates would benefit a lot
from quantitative classification. However, there are major
uncertainties. At first, systematic tests will be needed to assess the accuracy of the quantitative spectral classification,
e.g. by reproducing the atmospheric parameters of stars selected from the template library.
The present work highlights the importance of spectroscopic follow-up of CoRoT candidates when only a photometric classification has been available before. With modern multi-object spectrographs at hand (e.g. AAO, LAMOST), low-resolution spectroscopic characterisation should
become an indispensable part of any effort to follow-up on
planet candidates identified in wide-field surveys.
Acknowledgements. The selection of CoRoT targets is based on
contributions by P. Bord´e, F. Bouchy, R. Diaz, S. Grziwa, G. Montagnier, and B. Samuel within the detection and ground-based
follow-up of CoRoT candidates. M.A. was supported by DLR
(Deutsches Zentrum f¨ur Luft-und Raumfahrt) under the project 50
OW 0204. We would like to thank the workshops and the night assistants at the observatory in Tautenburg, Germany. This research
has made use of the ExoDat Database, operated at LAM-OAMP,
c 2006 WILEY-VCH Verlag GmbH & Co. KGaA, Weinheim
Ammler-von Eiff et al.: Classification of CoRoT candidates
Marseille, France, on behalf of the CoRoT/Exoplanet program.
This research has made use of the SIMBAD database, operated
at the CDS, Strasbourg, France, and NASAs Astrophysics Data
System Bibliographic Services.
References
Almenara, J. M., Deeg, H. J., Aigrain, S., et al.: 2009, A&A 506,
337
Baglin, A., Auvergne, M., Barge, P., et al.: 2009, in IAU Symposium, Vol. 253, IAU Symposium, ed. F. Pont, D. Sasselov, &
M. J. Holman, 71–81
Baglin, A., Auvergne, M., Barge, P., et al.: 2007, in American
Institute of Physics Conference Series, Vol. 895, Fifty Years
of Romanian Astrophysics, ed. C. Dumitrache, N. A. Popescu,
M. D. Suran, & V. Mioc, 201–209
Bailer-Jones, C. A. L.: 2002, in Automated Data Analysis in Astronomy, ed. R. Gupta, H. P. Singh, & C. A. L. Bailer-Jones,
83
Brown, T. M.: 2003, ApJ 593, L125
Cabrera, J., Fridlund, M., Ollivier, M., et al.: 2009, A&A 506, 501
Carone, L., Gandolfi, D., Cabrera, J., et al.: 2012, A&A 538, A112
Carpano, S., Cabrera, J., Alonso, R., et al.: 2009, A&A 506, 491
Catanzaro, G.: 1997, Ap&SS 257, 161
Cavarroc, C., Moutou, C., Gandolfi, D., et al.: 2012, Ap&SS 337,
511
Cayrel, R., Perrin, M.-N., Barbuy, B., & Buser, R.: 1991,
A&A 247, 108
Deleuil, M., Meunier, J. C., Moutou, C., et al.: 2009, AJ 138, 649
Deleuil, M., Moutou, C., & Bord´e, P.: 2011, Detection and Dynamics of Transiting Exoplanets, St. Michel l’Observatoire, France,
Edited by F. Bouchy; R. D´ıaz; C. Moutou; EPJ Web of Conferences, Volume 11, id.01001, 11, 1001
Doellinger, M.: 2008, PhD thesis, LMU M¨unchen: Fakult¨at f¨ur
Physik
Erikson, A., Santerne, A., Renner, S., et al.: 2012, A&A 539, A14
Fuhrmann, K.: 1998, A&A 338, 161
Fuhrmann, K.: 2000, http://www.usm.uni-muenchen.de/people/gehren/topics/pap 100.pd
www.ing.iac.es/ klaus/pap 100.ps
Fuhrmann, K.: 2004, AN 325, 3
Fuhrmann, K.: 2008, MNRAS 384, 173
Fuhrmann, K.: 2011, MNRAS 414, 2893
Gandolfi, D., Alcal´a, J. M., Leccia, S., et al.: 2008, ApJ 687, 1303
Gazzano, J.-C., de Laverny, P., Deleuil, M., et al.: 2010, A&A 523,
A91
Gazzano, J.-C., Kordopatis, G., Deleuil, M., et al.: 2013,
A&A 550, A125
Gray, D. F. & Johanson, H. L.: 1991, PASP 103, 439
Gray, R. O. & Corbally, J., C.: 2009, Stellar Spectral Classification
(Princeton University Press)
Guenther, E. W., Fridlund, M., Alonso, R., et al.: 2013, A&A 556,
A75
Guenther, E. W., Gandolfi, D., Sebastian, D., et al.: 2012,
A&A 543, A125
Malyuto, V., Lazauskaite, R., & Shvelidze, T.: 2001, NewA 6, 381
Moutou, C., Deleuil, M., Guillot, T., et al.: 2013, Icarus 226, 1625
Moutou, C., Pont, F., Bouchy, F., et al.: 2009, A&A 506, 321
Osterbrock, D. E., Fulbright, J. P., Martel, A. R., et al.: 1996,
PASP 108, 277
Osterbrock, D. E. & Martel, A.: 1992, PASP 104, 76
www.an-journal.org
Astron. Nachr. / AN (2006)
10
LRc09_E2_0308
residuals [sub−class]
Sebastian, D., Guenther, E. W., Schaffenroth, V., et al.: 2012,
A&A 541, A34
Sheen, Y.-K. & Byun, Y.-I.: 2004, JKAS 37, 87
Singh, H. P., Bailer-Jones, C. A. L., & Gupta, R.: 2002, in Automated Data Analysis in Astronomy, ed. R. Gupta, H. P. Singh,
& C. A. L. Bailer-Jones, 69
Slanger, T. G., Cosby, P. C., Osterbrock, D. E., Stone, R. P. S., &
Misch, A. A.: 2003, PASP 115, 869
Stock, J. & Stock, J. M.: 1999, RMxAA 35, 143
Tody, D.: 1986, in Society of Photo-Optical Instrumentation Engineers (SPIE) Conference Series, Vol. 627, Society of PhotoOptical Instrumentation Engineers (SPIE) Conference Series,
ed. D. L. Crawford, 733–+
Tody, D.: 1993, in Astronomical Society of the Pacific Conference
Series, Vol. 52, Astronomical Data Analysis Software and Systems II, ed. R. J. Hanisch, R. J. V. Brissenden, & J. Barnes, 173
Valdes, F., Gupta, R., Rose, J. A., Singh, H. P., & Bell, D. J.: 2004,
ApJS 152, 251
Wu, Y., Luo, A.-L., Li, H.-N., et al.: 2011a, RAA 11, 924
Wu, Y., Singh, H. P., Prugniel, P., Gupta, R., & Koleva, M.: 2011b,
A&A 525, A71+
799
0
LRc05_E2_3718
−10
−20
−30
0
100
200
300
400
500
SNR
(a) external templates (CFLIB) - internal templates
20
residuals [sub−class]
10
0
−10
−20
LRc09_E2_0308
−30
0
100
200
300
400
500
SNR
(b) photometric classification (ExoDat) - internal templates
10
residuals [sub−class]
0
−10
−20
−30
LRc09_E2_0308
−40
0
100
200
300
400
500
SNR
(c) photometric classification (ExoDat) - external templates
(CFLIB)
Fig. 3
Residuals of classifications when using external
templates and photometric classifications. The difference of
spectral types (in sub-classes) is displayed vs. the SNR. The
vertical line shows the median SNR found in Sect. 3, and is
used to distinguish good and bad spectra. The 2σ outliers
among the good spectra are highlighted by filled circles and
discussed in the text.
www.an-journal.org
c 2006 WILEY-VCH Verlag GmbH & Co. KGaA, Weinheim
800
Ammler-von Eiff et al.: Classification of CoRoT candidates
10
number
8
6
4
2
0
−30
−20
−10
residuals [sub−class]
0
10
Fig. 4
Histogram of residuals of classifications when using the CFLIB library (corresponding to Fig. 3(a)). The
difference of spectral types is shown in units of sub-class.
The filled style distinguishes spectra with good (grey) and
bad signal (hatched) according to the division line shown in
Fig. 3.
c 2006 WILEY-VCH Verlag GmbH & Co. KGaA, Weinheim
www.an-journal.org
© Copyright 2026