
Comparative analysis of the human saliva microbiome from different
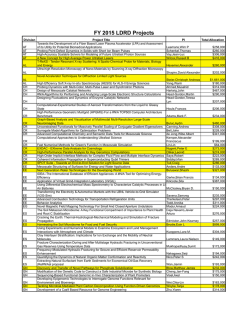
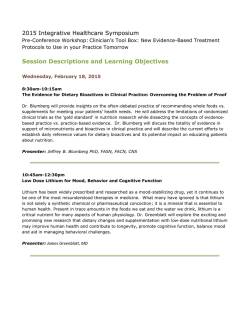
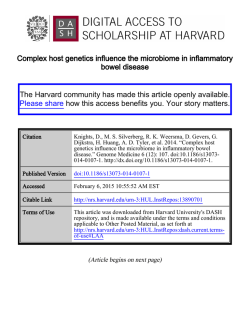
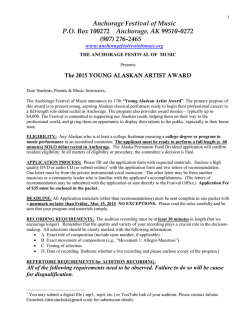
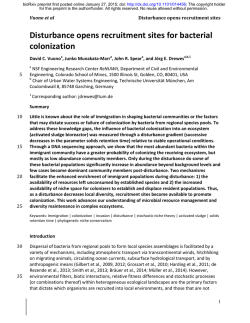
Li et al. BMC Microbiology 2014, 14:316
http://www.biomedcentral.com/1471-2180/14/316
RESEARCH ARTICLE
Open Access
Comparative analysis of the human saliva
microbiome from different climate zones: Alaska,
Germany, and Africa
Jing Li1,2*, Dominique Quinque1,7, Hans-Peter Horz3, Mingkun Li1, Margarita Rzhetskaya4, Jennifer A Raff4,8,
M Geoffrey Hayes4,5,6 and Mark Stoneking1
Abstract
Background: Although the importance of the human oral microbiome for health and disease is increasingly
recognized, variation in the composition of the oral microbiome across different climates and geographic regions is
largely unexplored.
Results: Here we analyze the saliva microbiome from native Alaskans (76 individuals from 4 populations), Germans (10
individuals from 1 population), and Africans (66 individuals from 3 populations) based on next-generation sequencing
of partial 16S rRNA gene sequences. After quality filtering, a total of 67,916 analyzed sequences resulted in 5,592 OTUs
(defined at ≥97% identity) and 123 genera. The three human groups differed significantly by the degree of diversity
between and within individuals (e.g. beta diversity: Africans > Alaskans > Germans; alpha diversity: Germans >
Alaskans > Africans). UniFrac, network, ANOSIM, and correlation analyses all indicated more similarities in the
saliva microbiome of native Alaskans and Germans than between either group and Africans. The native Alaskans
and Germans also had the highest number of shared bacterial interactions. At the level of shared OTUs, only
limited support for a core microbiome shared across all three continental regions was provided, although partial
correlation analysis did highlight interactions involving several pairs of genera as conserved across all human
groups. Subsampling strategies for compensating for the unequal number of individuals per group or unequal
sequence reads confirmed the above observations.
Conclusion: Overall, this study illustrates the distinctiveness of the saliva microbiome of human groups living
under very different climatic conditions.
Keywords: Saliva, Microbial community, Humans
Background
The human body hosts about 100 trillion bacterial cells,
around 10 times more than the number of human cells.
Bacteria have been shown to play an important role in human health, affecting weight, immune response, nutrient
absorption, and other aspects [1,2]. More than 1000 bacterial species have been found in and on the human body,
* Correspondence: [email protected]
1
Max Planck Institute for Evolutionary Anthropology, Deutscher Platz 6,
D-04103 Leipzig, Germany
2
Max Planck Independent Research Group on Population Genomics, Chinese
Academy of Sciences and Max Planck Society (CAS-MPG) Partner Institute for
Computational Biology, Shanghai Institutes for Biological Sciences, Chinese
Academy of Sciences, 320 Yueyang Road, Shanghai 200031, China
Full list of author information is available at the end of the article
some of which promote health while others contribute to
illness [3,4]. However, recent studies have shown that
instead of distinct microbial species being either beneficial
or harmful for human health, perturbations in the global
balance of the microbiome might play a more important
role [5,6]. Therefore, it is important to understand what
constitutes a “normal” bacterial community in the healthy
human body [7-9], and how this might vary across
populations.
The oral cavity is a major gateway to the human body,
and microorganisms colonizing the oral cavity have the
possibility to spread to neighboring sites and influence
the gastrointestinal microbiome[10]. In addition, while
mostly harmless in their primary (oral) habitat, oral
© 2014 Li et al.; licensee BioMed Central Ltd. This is an Open Access article distributed under the terms of the Creative
Commons Attribution License (http://creativecommons.org/licenses/by/4.0), which permits unrestricted use, distribution, and
reproduction in any medium, provided the original work is properly credited. The Creative Commons Public Domain
Dedication waiver (http://creativecommons.org/publicdomain/zero/1.0/) applies to the data made available in this article,
unless otherwise stated.
Li et al. BMC Microbiology 2014, 14:316
http://www.biomedcentral.com/1471-2180/14/316
Page 2 of 13
bacteria have been linked with systemic, life-threatening
disorders, e.g. cardiovascular disease, stroke, preterm
birth, and pneumonia [11-16]. Hence the oral microbiome significantly affects human health. Moreover, the
oral ecological system is influenced by external factors,
such as food, drink, living temperature and humidity,
and oral hygiene measures [17-19] and previous studies
have shown a high degree of inter-individual variation in
the oral microbiome [20,21]. While the overall oral
health/disease status is a principal determinant of the
oral microbial community compositions [20,22], comparatively little is known about how the structure and
diversity of the oral microbiome varies across healthy
human hosts of different ethnic or environmental origin.
We previously analyzed the saliva microbiome, via sequencing of a part of the16S ribosomal RNA (rRNA)
gene, from 120 healthy individuals (10 individuals from
each of 12 worldwide locations) and found a significant
association between variation in the saliva microbiome
and the distance of each location from the equator [21].
Furthermore, we found that the saliva microbiome of
Batwa Pygmies, a former hunter-gatherer group from
Africa, is much more diverse than the saliva microbiome
of two agricultural African groups, most likely because
of their different lifestyle and diet [23]. Other studies
have found signatures of ethnicity in the oral microbiome
[24]. Hence, both environment and geography may play a
role in defining a “healthy” human oral microbiome. Here,
we present a comparative analysis of the salivary microbiome diversity of three different human groups living
under different climatic conditions. We obtained new data
from 76 native Alaskans from four different geographic locations, all sampled from the northern extremity of the
North American continent, as well as from ten individuals
from Germany. For comparison, we also analyzed previously published data from 66 individuals from three different African populations located near the equator
[23]. In this study, we are able to compare the salivary
microbiome composition of different human populations living under very different climatic conditions and
geographic locations.
Results
Saliva microbiome diversity at the genus level
After removing sequence reads less than 200 bp, quality
filtering and chimeric checking via the AmpliconNoise
pipeline [25], a total of 20909 sequences from the native
Alaskans (Additional file 1: Figure S1) and 4618 sequences from the Germans remained for analysis. For
the native Alaskan group 96.2% of the sequences could
be assigned to a specific genus, while 3.8% were assigned
as unknown by the Classifier in the RDP website [26];
for the German group, 96.9% of the sequences were
assigned to specific genera while 3.1% of the sequences
were assigned as unknown (Table 1).
The number of different bacterial genera detected in
each native Alaskan group ranged from 41 to 62, compared to 58 genera in the Germans and 41 to 100 genera
in the African groups. We next carried out an analysis of
molecular variance (AMOVA) at the genus level in order
to investigate how much of the total variation in the saliva microbiome is due to differences within vs. among
individuals from each group. The results (Table 1) indicate that the Barrow, Nuiqsut and Wainwright groups
have similar apportionments of variation (variance between individual: 6.75 - 10.21% and variance within individuals: 89.79 - 93.25%), while the group from Atqasuk
Table 1 Statistics for the microbiome diversity in native Alaskans (Atqasuk, Barrow, Nuiqsut, and Wainwright),
Germans, and Africans (BP [Batwa Pygmies from Uganda], DRC [Democratic Republic of the Congo], and SL [Sierra
Leone])
Group
Number of
Individuals
Number of
Sequences
Number of
OTUs
Unknown (%) Number of
Genera
Variance between
individuals (%)
Variance within
individuals (%)
Atqasuk
14
2661
807
4.5
45
13.43
86.57
Barrow
40
10937
2015
3.6
62
10.21
89.79
Nuiqsut
13
2972
853
3.7
41
7.60
92.40
Wainwright 9
2905
862
4.0
47
6.75
93.25
Germans
10
4388
887
3.1
58
2.32
97.68
BP
38
22948
3115
11.0
100
13.81
86.19
DRC
15
4503
703
9.9
41
43.75
56.25
SL
13
16602
1888
11.2
57
35.17
64.83
Africans
66
44053
4145
11.0
108
25.97
74.03
Alaskans
76
19475
2886
3.8
73
9.69
90.31
Germans
10
4388
887
3.1
58
2.21
97.79
Total
152
67916
5592
8.4
123
22.03
77.97
Li et al. BMC Microbiology 2014, 14:316
http://www.biomedcentral.com/1471-2180/14/316
has slightly more differentiation between individuals
(13.43%) and correspondingly less variance within individuals (86.57%). Thus, the group from Atqasuk is characterized by a higher heterogeneity of the salivary
microbiome among individuals, compared to the other
three native Alaskan groups. By contrast, the German
group was characterized by very little variance among
individuals (only 2.32%), while the African groups were
characterized by much more variance among individuals
(13.81 – 43.75%). When introducing an additional hierarchical level into the AMOVA by grouping individuals
from the same population, the variance component
among the four native Alaskan groups (−0.17%) was not
significantly different from zero, indicating that the saliva microbiomes of the native Alaskan groups have similar compositions. By contrast, a variance component of
4.06% was observed among the three African groups,
which is significantly different from zero. Thus, the composition of the saliva microbiome does differ significantly
among the African groups. Overall, when grouped together
according to climatic region (Table 1), the German group
showed the smallest variance among individuals (2.21%),
followed by native Alaskans (9.69%), and then Africans
with the highest variance among individuals (25.97%).
In an attempt to further elucidate differences in diversity
at the genus level, we calculated the within individual diversity (also called alpha diversity) using the ShannonWeaver index [27], and inter-individuals’ diversity (or beta
diversity) using the Sørensen index [28] (Additional file 2:
Figure S2). Germans showed the highest alpha diversity
and the lowest beta diversity. The four Alaskan groups
had intermediate values for both the alpha diversity and
the beta diversity. By contrast, the two agricultural African
groups (Democratic republic of Congo [DRC] and Sierra
Leone [SL]) showed the lowest alpha diversity values but
comparatively high beta diversity values, while the huntergatherer Batwa Pygmies from Uganda [BP] group showed
a significantly higher alpha diversity and also significantly
lower beta diversity. Overall, these results are consistent
with the AMOVA results.
To further investigate similarities and differences in the
saliva microbiome among the eight populations, we used
the ANOSIM analysis, based on permutation tests of the
Sørensen index matrix for all individuals. This analysis
indicated no significant differences among the four native
Alaskan groups (ANOSIM statistic: R = −0.0935, P value =
0.7386, 10000 permutations) or between native Alaskans
and Germans (P value = 0.7324) but there were significant differences between native Alaskans and Africans
(P value = 0.0001) as well as between Germans and Africans
(P value = 0.0001). These results indicate that native
Alaskans and Germans are more similar to each other
than to Africans in their saliva microbiome composition
at the genus level.
Page 3 of 13
Abundance distribution of the saliva microbiome
A heat plot of the abundance distribution of the genera
(Additional file 3: Figure S3) shows that the native
Alaskan group and the German group shared a higher
number of genera than either group with the African
group. The phylogenetic distribution of those genera
with more than 0.5% abundance in at least one group
are displayed in Figure 1, while the exact values and
pairwise significance values are given in Additional file
4: Table S1. The most common phyla are Actinobacteria
(A), Bacteroidetes (B), Firmicutes (F), Fusobacteria (Fu),
Proteobacteria (P) and TM7 (T), with an abundance
rank order F > B > P > A > Fu > T for native Alaskans and
Germans, and P > F > B > Fu > A > T for Africans. At the
genus level, there were 13 genera (covering all six phyla)
out of the 28 common genera with comparable abundance in both native Alaskans and Germans. Conversely,
native Alaskans and Africans shared only six genera
(Neisseria, Campylobacter, Granulicatella, Megasphaera,
Selenomonas, Actinomyces) with comparable abundance
while Germans and Africans shared only three genera
(Actinobacillus, Aggregatibacter, Capnocytophaga,), see
Additional file 4: Table S1.Three genera (Streptococcus,
Fusobacterium, and Leptotrichia) were of similar abundance in all three groups, and seven genera (Enterobacter,
Escherichia, Citrobacter, Gemella, Klebsiella, Rothia, and
Veillonella) were of different abundances in all three
groups.
Correlation analysis based on abundance distribution
To further investigate similarities and differences among
the groups in the composition of the saliva microbiome,
we calculated correlation coefficients for the distribution
of genera detected between each pair of individuals, both
within and between groups (Additional file 5: Figure S4).
The average correlation coefficient among the four native
Alaskan groups was 0.64, and none of the pairwise comparisons of the distribution of correlation coefficients between groups were significantly different (Mann–Whitney
U tests, all p-values >0.05). The average correlation among
Germans was 0.73, and between native Alaskans and
Germans was 0.64, which was not significantly different
(p = 0.2) from the average correlations within native
Alaskans or Germans. However, the average correlation
between native Alaskan groups and African groups was
0.49, and between Germans and the African groups was
0.49, both of which are significantly lower than the correlations within groups (p = 0.0007 and 0.0001, respectively).
Phylogenetic analysis
We used the UniFrac metric to calculate a distance
between each pair of individuals, based on their shared
proportion of the sequence phylogeny. The result of principal coordinates analysis (PCoA) based on unweighted
Li et al. BMC Microbiology 2014, 14:316
http://www.biomedcentral.com/1471-2180/14/316
Page 4 of 13
Figure 1 Relative abundance of predominant genera (>0.5%) among native Alaskans, Germans and Africans. The phylogenetic tree was
calculated with representative full-length sequences, and the scale bar represents evolutionary distance (10 substitutions per 100 nucleotides).
Bacterial phyla are indicated by different colors; the vertical bars on the right of each plot indicate the relative abundance of each phylum, as
designated by the colors.
UniFrac distances is shown in Figure 2A. Although the two
principal coordinates only account for 18% of the variance,
the Africans are nonetheless largely (but not completely)
separated from the native Alaskans and Germans, while
the Germans are intermingled with the native Alaskans,
with some tendency toward separation in PC2.
We also constructed an unweighted pair-group method
with arithmetic means (UPGMA) tree based on the unweighted UniFrac distances (Figure 2B). With just a few
exceptions, the Africans are clustered separately from the
other groups, while the Germans cluster within the native Alaskans. Moreover, while there is some tendency
for the Batwa Pygmies to cluster separately from the other
African groups in both the PCoA and the UPGMA tree,
the four native Alaskan groups do not show any differences from one another in either analysis. Overall, these
results indicate that native Alaskans and Germans are
quite similar to one another in saliva microbiome
composition, but both differ significantly from the saliva microbiome of Africans.
Bacterial interaction based on partial correlation analysis
In addition to investigating the inter-subject and intergroup variability of oral microorganisms in human populations from very diverse geographical regions, we also
investigated the possible existence of stable bacterial
interactions, as these would additionally aid in understanding community structure and ecological interactions.
We constructed partial correlation networks to visualize
the direct or indirect relationships among bacteria for
Alaskans, Germans, and Africans separately. Significant
correlations were found for 147 pairs of bacterial genera
of which the majority (i.e. 107) were uniquely present in
only one human group: 48 in the Alaskan group, 37 in the
German group, and 22 in the African group. Of the
remaining 40 pairs (see Figure 3), 12 were shared between
Li et al. BMC Microbiology 2014, 14:316
http://www.biomedcentral.com/1471-2180/14/316
Page 5 of 13
Figure 2 Analyses based on the UniFrac distances: (A) principal coordinates analysis, and (B) UPGMA tree. Each colored letter is an
individual; colors represent regions (Blue, native Alaskans; red, Germans; green, Africans) and letters designate individual groups (A: Atqasuk; B: Barrow;
N: Nuiqsut; W: Wainwright; G: Germans; D: DRC; S: SL; P: Batwa Pygmies).
the Alaskan and the African group, 20 between the Alaskan
and German group, and 4 between the German and African
group. Four pairs of bacterial genera were shared between
all three human populations, namely Actinomyces-Veillonella, Gemella-Granulicatella, Haemophilus-Veillonella, and
Capnocytophaga-TM7_genera_incertae_sedis. Despite the
high number of unique interactions at the genus level, the
assignment of correlating genera to the phylum level
showed a fairly consistent proportion of either phylum in
the case of positive interactions (Additional file 6: Table S2).
However, the number of negative interactions was much
lower in the African group compared to the Alaskan and
German group (Additional file 6: Table S2, Additional file 7:
Figure S5).
Saliva microbiome diversity at OTU level
We also compared the salivary microbiome diversity
among the different groups at the OTU (operational
taxonomic unit) level, with OTUs defined by collapsing
all sequences that were more than 97% identical to account for potential sequencing errors. Network analysis
based on OTUs supported a clear clustering of the native Alaskan group distinct from the African group,
with the German group in between but closer to the
native Alaskans (Figure 4). Hence, as seen previously
with analyses at the genus level, the OTU network confirmed a closer relationship between the salivary microbiomes of native Alaskans and Germans compared to
the Africans.
To further compare the similarity of the salivary
microbiome at the OTU level, we calculated the correlation coefficient based on OTU abundance among all
individuals (Additional file 8: Figure S6). The average
correlation coefficient within the four native Alaskan
groups is 0.17. Conversely, the average correlation coefficient within three African groups is 0.09, and that within
the German group is 0.33. The correlation coefficient
between native Alaskans and the German group is 0.18,
that between Alaskans and Africans is 0.07, and that between Germans and Africans is 0.10. Consistent with the
previous analyses, the correlations at the OTU level further document more similarity between the salivary
microbiomes of native Alaskans and Germans than between either group and Africans.
We also calculated the alpha and beta diversity at the
OTU level (Figure 5). All populations showed higher
alpha diversity values (average Shannon index = 4.02)
than at the genus level (average Shannon index = 1.85),
and similarly much higher beta diversity values (average
Sorenson index = 0.88) than at the genus level (average
Sorenson index = 0.60). However, the overall patterns of
alpha vs. beta diversity values for each population are
similar at the genus and OTU levels (Additional file 2:
Figure S2 and Figure 5). The ANOSIM analysis based on
OTUs confirmed the results based on genera (i.e. no significant differences among the four native Alaskan groups
(P value = 0.2131) but significant differences between the
native Alaskan group and both the Germans and the
African group (P = 0.0131 and 0.0001, respectively).
Core microbiome
In addition to analyzing the diversity of the human saliva
microbiome, we also investigated the existence of a core
microbiome in human saliva, i.e. a set of common OTUs
Li et al. BMC Microbiology 2014, 14:316
http://www.biomedcentral.com/1471-2180/14/316
Page 6 of 13
Figure 3 Partial correlation network constructed by the frequency abundance of 28 common genera (frequency >0.5% in at least one
regional groups) in 152 individuals from Alaska, Germany, and Africa. In this figure, the solid lines represent positive correlations, and the
dashed lines represent negative correlations. The line color indicates the shared correlation between different groups; green: correlation shared
between Alaskans and Africans, blue:correlation shared between Alaskans and Germans, red: correlation shared between Germans and Africans,
black: correlations shared among all three groups.
shared across individuals from different environments.
Figure 6 shows the distribution of shared OTUs across
different percentages of the total number of individuals,
and the corresponding percentage of the total sequences
distributed in those shared OTUs. No OTUs are shared
by more than 90% of the individuals; only 14 OTUs
(0.23% of the total OTUs) were present in 50% of the individuals, and only 102 OTUs (1.64% of the total OTUs)
were present in 20% of the individuals. However, the
total number of sequences is significantly enriched in
the shared OTUs: 9341 sequences (12.88% of the total
sequences) were found in the OTUs shared by 50% of
the individuals, and 28411 sequences (39.16% of the total
sequences) were found in the OTUs shared by 20% of
the individuals.
To determine if particular OTUs may be associated
with particular environments, we investigated in more
detail the patterns of shared and unique OTUs. Here, an
OTU is considered to be exclusively shared if it is found
in at least one member of each population within the
continental groups compared. An OTU was considered
unique, when it was exclusively present in one continental group but shared among all populations within this
group. There are very few OTUs (0.16% - 0.22%) shared
exclusively by two regional groups (Table 2), and the
percentage of sequences distributed in the shared OTUs
is also quite low (0.20% -0.66%). Conversely, there are 56
OTUs shared by all three continental groups (1.00%),
with 20.92% of the total sequences distributed in those
OTUs. These 56 OTUs were distributed over all major
phyla except for TM7, and included the genera Actinomyces, Fusobacterium, Lactobacillus, Haemophilus, Leptotrichia, Neisseria, Porphyromonas, Prevotella, Rothia,
Streptococcus, and Veillonella (abundance distribution
see Additional file 9: Table S3). Additionally, we compared the taxa assignments of these 56 common OTUs
with the results from the salivary core-microbiome identified from the Human Microbiome project (HMP)
[29,30]. At the genus level, 10 of 11 assigned genera, except Haemophilus, from these 56 common OTUs were
also detected in the HMP salivary core-microbiome
(Additional file 9: Table S3). In contrast to the common
Li et al. BMC Microbiology 2014, 14:316
http://www.biomedcentral.com/1471-2180/14/316
Page 7 of 13
Figure 4 Network relating individuals and OTUs. Each colored letter is an individual; colors represent regions (Blue, native Alaskans; red,
Germans; green, Africans) and letters designate individual groups (A: Atqasuk; B: Barrow; N: Nuiqsut; W: Wainwright; G: Germans; D: DRC; S: SL; P:
Batwa Pygmies).
OTUs, there are also very few OTUs that are unique to
either Alaskans (0.23% OTUs with 0.71% sequences) or
Germans (1.65% OTUs with 0.18% sequences), but many
more OTUs unique to Africans (2.1% OTUs with 9.25%
sequences), Table 2.
Influence of uneven sampling
The above results could potentially be biased because of
the unequal number of sequence reads from each individual and unequal number of individuals from each population. Thus, to evaluate the effect of uneven sequencing
and sampling, we re-performed all calculations based on
randomly subsampling ~2500 reads from ~12 individuals
from each population. As expected, the absolute number
of observed genera and OTUs are decreased due to the reduced sampling reads (Additional file 10: Table S4). However, the major results from the comparisons among
populations or groups did not change, e.g. the AMOVA
analysis (Additional file 10: Table S4), rarefaction analysis
(Additional file 11: Figure S7), UniFrac analysis (Additional
file 12: Figure S8), and diversity analysis (Additional file 13:
Figure S9). In another approach we separately subsampled
10 individuals from Alaskans, Germans, and Africans while
also correcting for the unequal number of reads, i.e. we
sampled ~2500 reads from each group. The corresponding results were similar to those based on the original
number of individuals as can be seen in the AMOVA
analysis (Additional file 10: Table S4), rarefaction analysis (Additional file 14: Figure S10), and diversity analysis (Additional file 15: Figure S11).
Discussion
We have analyzed the salivary microbiome of human
populations living in different geographic and climatic
environments, including native Alaskans, Germans, and
Africans. Although we lacked information to test for associations between variation in the salivary microbiome
and demographic variables such as age or gender of the
individuals, in a previous study of the saliva microbiome
that encompassed a much larger geographic sampling, it
was found that neither age nor gender of the individual
influenced the variation in the saliva microbiome [21].
In addition, detailed examination of the oral health status
or history of the donors was not carried out, nor was information available concerning dental hygiene practices of
the donor; however, all donors were healthy and no donors were suffering from obvious oral lesions or diseases.
Moreover, we do not detect consistent differences among
groups in bacterial genera that have been previously
shown to be associated with variation in dental hygiene
(Figure 2), such as Fusobacterium, Porphyromonas and
Prevotella [31]. Thus, the differences discussed below are
Li et al. BMC Microbiology 2014, 14:316
http://www.biomedcentral.com/1471-2180/14/316
Page 8 of 13
Figure 5 Diversity analysis for four Alaskan groups, three African groups, and among the three continental regions based on the
bacteria abundance distribution for each individual at OTU level. A. Alpha diversity measured by Shannon indices and B. Beta diversity
measured by Sørensen indices.
Figure 6 Distribution of common OTUs and the total number of sequence reads accounted for by each OTU across the total of 152
individuals. The dark bars represent the proportion of common OTUs among the total number of OTUs (6222 OTUs), and the light bars
represent the proportions of sequence reads distributed in those common OTUs among the total number of sequences (72551 sequences).
Li et al. BMC Microbiology 2014, 14:316
http://www.biomedcentral.com/1471-2180/14/316
Page 9 of 13
Table 2 Number and percentage of OTUs and the sequences distributed in those OTUs that are either shared by
different continental groups or unique to a single continental group
OTUs
Shared OTUs
Unique OTUs
Alaskan-German
Sequences in those OTUs
Number
Percentage (%)
Number
Percentage (%)
12
0.22
450
0.66
Alaskan-African
9
0.16
285
0.42
German-African
12
0.21
136
0.20
3 Groups
56
1.00
14211
20.92
Alaskan
13
0.23
481
0.71
German
92
1.65
121
0.18
African
118
2.1
6285
9.25
more likely to reflect differences in geography, climate,
and/or diet, rather than differences in oral health/hygiene
(although the latter cannot be ruled out completely).
Although the four Alaskan groups are located in different regions (i.e. Atqasuk and Nuiqsut are in the inland of
Alaska, while Barrow and Wainwright are located along
the coast of Alaska, covering an overall distance of about
350 km), no significant differences among these four
Alaskan groups were observed at both the genus and the
OTU level. Therefore, geographic location and potentially
different diets (the inland groups eat more caribou and
less marine mammals than the coastal groups) did not
play a crucial role in shaping the salivary microbiome
composition of the four Alaskan groups. Conversely, the
three African groups differed significantly, with the Batwa
Pygmies (hunter-gatherer lifestyle) showing significantly
higher saliva microbiome diversity compared to the other
two African groups (farmer lifestyle). Hence, lifestyle,
geography and/or diet also seem to play a role in shaping
the salivary microbiome in the African groups. For comparison, we also analyzed the salivary microbiome composition of a German group, representing an intermediate
geographic location with moderate climatic conditions.
Interestingly, the salivary microbiome of the German
group showed a high similarity with the Alaskan group at
the genus level, while at the OTU level distinct differences
could be observed. Overall, the salivary microbiome of the
human populations from the northern continents were of
comparable similarity, but differed strongly from the
African groups at both the genus and OTU level. This
finding corroborates our previous study, which showed an
association between UniFrac distances and the geographic
distance of analyzed individuals from the equator [21].
Further differences among the salivary microbiomes of
the three geographic regions are revealed when looking
at alpha and beta diversity. Differences were more pronounced at the OTU-level than at the genus-level. Alpha
diversity was highest for the German group and lowest
for the African group, while the opposite was true for
beta diversity (Additional file 2; Figure S2 and Figure 5),
which is in agreement with the AMOVA analysis (Table 1).
One potential explanation for the differences in alpha diversity could be the diversity of the diet. The diet of the
German individuals probably encompasses a wider variety
of substances (especially a multitude of different carbohydrates) than the diet of the native Alaskans or Africans,
and those nutrients have an affect on the ecology of the
mouth [32]. We therefore speculate that a rich buffet of
different foodstuffs may provide a more complex array
of substrates and thus ultimately allow a higher number of
bacterial species (including low-abundant members) to
thrive in the oral cavity, which would explain the differences in alpha-diversity observed in our study. Another
explanation could be population density, which is higher
in Germany than in the other regions, providing more opportunities for bacteria to be spread among individuals.
High beta diversity reflects the heterogeneity of the samples, which in turn might be the result of the size and diversity of the sampled area (e.g. the German individuals
reflect a more homogenous group coming from a fairly restricted area, while the Alaskan and African groups originated from far bigger geographic areas). Large areas are
environmentally more heterogeneous than small areas
and as a consequence the overall diversity of observed
bacteria might be higher. Hence, despite relatively low diversity within individuals, the overall number of bacterial
taxa may be higher in more geographically dispersed
groups, as was observed for the African group (Table 1).
Studies on bacterial interaction within human ecosystems are still in their infancy, however they address important and challenging open questions regarding the
human microbiome: namely, how is human health affected
by the trophic interdependencies and disturbances among
bacterial taxa? Here we used partial correlation analysis to
construct the interaction network for each regional group
(Alaskans, Germans, and Africans) based on genera. Interestingly, the resulting interactions were mostly unique to
one particular human group. Although currently largely
speculative in nature, these interactions may reflect the
versatility of microbial trophic webs within humans [33].
Li et al. BMC Microbiology 2014, 14:316
http://www.biomedcentral.com/1471-2180/14/316
As such these interactions might provide the basis for a
better distinction of different human populations, which
otherwise may not be distinguishable by the mere composition of their microbiota. Even at the phylum level a distinction was observed, since the African group showed a
lower number of negative interactions, while the proportion of positive interactions were largely consistent among
the human groups. Partial correlation analysis also showed
that the Alaskan group and the German group shared the
highest number of common interactions between genera,
corroborating the overall result of this study. The network
of 40-shared interactions (between at least two geographical regions) included also the recognized association of
early, middle and late oral colonizers (Porphyromonas,
Fusobacterium and Aggregatibacter, respectively [34].
Hence, the associations known from in-vitro experiments
seem to stably exist in oral ecological niches across different ethnic hosts and/or different geographic environments.
Furthermore four pairs of positive interactions were identified present in all human populations. Apparently, the involved genera (i.e. Actinomyces, Gemella, Granulicatella,
Veillonella, Haemophilus, Capnocytophaga and TM 7) are
not only permanently prevalent (though with different
abundances, as can be seen in Figure 1), but may reflect
fundamental bacterial relationships in the human oral cavity (regardless of ethnicity or geographic origin). As such
those genera may have a key role in human oral health or
disease. This assumption is further warranted by the recognized central position of early colonizing Veillonella that
emerges in saliva as a critical genus guiding the development of multispecies communities [34], and by the emerging key role of members of the phylum TM 7 in the
salivary microbiome [35].
A recent comprehensive study examined microbial cooccurrences or co-exclusion in different human body
sites [36]. However, comparisons with our study are not
straightforward, as saliva samples made up only 6% of
their samples and microbial relationships are presented
largely at the family or class level. There is only one reported positive association at the genus level in saliva,
namely between Aggregatibacter and Capnocytophaga,
which we also observe in the African individuals. Otherwise, it is notable that most bacterial interactions were
found in the oral cavity compared to other body sites
[35], which may explain the relatively high number of interactions we found in our study.
Despite the overall higher similarity between the Alaskan
and German salivary microbiome, they did not share
substantially more OTUs (i.e. 12), than the Alaskan and
African group or the German and African group (9, and
12, respectively). Hence, resemblance of salivary microbiomes between human populations rather occurs at
higher taxonomic ranks and in how the microbiomes
are structured (e.g. beta and alpha diversity). In addition,
Page 10 of 13
the relatively low number of OTUs shared among all continental groups (i.e. 56 OTUs accounting for 21% of all
reads) provides at best limited support for the concept of a
core human saliva microbiome at the 97% OTU level.
Clearly, a core human microbiome (if truly existing) can be
defined in more complex ways, depending on the ecological
questions addressed [37]. However, it can be concluded that
these 56 common OTUs probably represent key organisms
that are important for sustaining the salivary microbial ecosystems in at least some humans.
Interestingly the number of unique OTUs (i.e. those
found only in one continental group but shared among
all populations within this group) was highest in Africa,
although the African group had the highest heterogeneity (according to the results of the beta diversity and
AMOVA analyses). Most of these African specific OTUs
are enriched in Enterobacteriaceae (i.e. Enterobacter,
Klebsiella and Escherichia). In line with our previous observations [21,23], members of the family Enterobactericeae seem to be a consistent signature that distinguishes
the salivary microbiome of African populations from
other worldwide geographical regions. The reason for
the high prevalence and abundance of Enterobacteriaceae in African populations remains currently unknown;
knowledge of precise species would help elucidate the
source of enterobacterial colonization (e.g. uptake of
free-living species from plants vs. introduction through
consumption of fecal-contaminated food or water).
Besides diet or drinking water, we speculate that outdoor
temperature is a hitherto unrecognized contributing factors
that enhances/promotes the oral colonization of Enterobacteriaceae in Africans. First, members of Enterobacteriaceae
grow best at temperatures beyond 37 degrees Celsius (e.g.
the optimum growth rate of Escherichia coli and Enterobacter sakazakii is 40.85 and 39.4 degrees Celsius, respectively
[38,39]. Second, increased temperature by seasonal changes
has been shown to be associated with increased human
colonization by Enterobacteriaceae, as deduced from retrospective studies on Gram-negative bacterial bloodstream
infections [40,41]. Third, outdoor temperature affects the
oral temperature [42,43] and it is plausible to assume that
the oral temperature of African individuals is at least
slightly elevated compared to individuals from other climatic zones and therefore more amenable for enterobacterial growth. In addition to the temperature level itself, the
constancy of the oral temperature may influence bacterial
growth. It is conceivable that sudden drops or rise in oral
temperature occur within Alaskan and German individuals
(especially during wintertime) when leaving or entering
heated houses, which clearly is not the case for individuals
with close proximity to the equator.
We are aware that the unequal number of sequence
reads from each individual and unequal number of individuals from each population could bias some of our
Li et al. BMC Microbiology 2014, 14:316
http://www.biomedcentral.com/1471-2180/14/316
results based on absolute observations, such as unique/
shared taxa. However, after subsampling individuals and
sequence reads, our main conclusions based on analyses
of relative abundances (phylogenetic analysis, clustering
analysis, and diversity analysis) did not change substantially. Thus, the uneven sampling is not responsible for
the major results of the analyses.
Page 11 of 13
phylotypes detected [45]. We used the forward primer for
V1 and the reverse primer for V2 [45], which together amplify a ~350 bp PCR product containing V1 and V2. Here,
more detailed extraction protocols and PCR primers could
be found in the previous published work [45], and the same
extraction and PCR condition were used for all samples.
Sequencing on the genome sequencer FLX platform
Conclusions
In conclusion, we have shown that human populations
from different geographic and climatic areas exhibit differences in their salivary microbiome, the reasons of
which (e.g. differential lifestyles including diet and/or
host genetics and physiology including the immune system) remain to be elucidated. This knowledge is vital for a
proper definition of the global salivary microbiome in
health and disease. Further studies including other environments and geographic regions are therefore warranted.
The PCR products were processed for parallel-tagged sequencing on the Genome Sequencer FLX platform, as
described previously [21,46]. Sample-specific barcode sequences were ligated to the PCR products, and DNA concentrations were assessed on an Mx3005P™ (Stratagene).
Samples were then pooled in equimolar ratios to a total
DNA amount of 440 ng. The pooled library was subsequently amplified in PCR-mixture-in-oil emulsions and
sequenced on one lane of a 4-lane Pico Titer Plate on a
Genome Sequencer FLX/454 Life Sciences sequencer
(Branford CT), according to the manufacturer’s protocol.
Methods
Ethics statement
Data analysis
All participants provided written informed consent, and
this study was approved by the Northwestern University
Institutional Review Board and the Ethics Committee of
the University of Leipzig Medical Faculty.
The initial sequence reads were filtered to remove sequence reads containing two or more different tags, no
tags, primers in the middle of sequence reads, or without a primer sequence. These sequence reads have been
deposited in Genebank Sequence Read Archive (SRA)
SRP028342. The aligned sequences used in the analyses
are available from the authors upon request. Quality filtering of the raw sequence reads was performed with the
AmpliconNoise pipeline [25], and the chimeras were
identified by the Mallard [47] program by using a quantile value of 95% as the threshold for removing outliers.
The filtered sequences were assigned to different genera
by the Classifier approach [26] in the Ribosomal Database Project (RDP) database [48]. Diversity statistics and
apportionment of variation based on the frequency distribution of genera within and between individuals were
calculated with Arlequin 3.5 [49]. Spearman’s rank correlation coefficients were calculated with the R package.
Diversity (dissimilarity) analysis, Shannon-Weaver index
(alpha diversity), Sørensen index (beta diversity) were
calculated by the “vegan” package in R, and the significances of diversity distributions between groups were
implemented by the Mann–Whitney u test. The dissimilarity tests among groups (ANOSIM) were also implemented by the “vegan” package in R. Rarefaction analysis
was carried out using the Resampling Rarefaction 1.3
software (http://strata.uga.edu/software/). For the UniFrac analysis, the sequences were aligned with the Infernal
1.0 program [50] and a phylogenetic tree was constructed
under a generalized time reversible (GTR) model with the
FastTree software [51]. Fast UniFrac [52] was then used
to compare the microbial communities, compute the
distance matrix, and generate the cluster tree. The OTUs
Samples and DNA extraction
Saliva samples were collected from four native Alaskan
communities from Atqasuk (14 samples), Barrow (40
samples), Nuiqsut (13 samples) and Wainwright (9 samples) (Figure S1). Samples were also obtained from 10
individuals living in or nearby Leipzig, Germany. DNA
was extracted from the German samples as described
previously [44], and from the native Alaskan samples
with the Oragene kit, following the manufacturer’s directions. For comparison, we included published data [23],
generated with similar methods, for three groups from
Africa (Democratic republic of Congo [DRC, 15 samples], Sierra Leone [SL, 13 samples] and Batwa Pygmies
from Uganda [BP, 38 samples]). For sample collection,
volunteers spit up to 2 mL of saliva into tubes containing 2 mL lysis buffer [44]. While the oral health of donors at the time of sampling was not investigated in
detail, no human donor was suffering from obvious oral
lesions or severe dental decay, and to the best of our
knowledge no human was being treated with antibiotics
at the time of sampling. The age of the human donors
ranged from 20–40 years.
PCR amplification of the microbial 16S rRNA gene
We amplified a region of the microbial 16S rRNA gene
containing variable segments V1 and V2, which were
previously shown to be more informative than other regions of the 16S rRNA gene in terms of the number of
Li et al. BMC Microbiology 2014, 14:316
http://www.biomedcentral.com/1471-2180/14/316
networks were constructed from the sequences aligned with
Infernal 1.0 by using tools provided by the RDP website to
first cluster all sequences that were 97% or more similar
(based on a minimum overlap of 25 bases) into OTUs (to
account for sequencing errors). We then used the Cytoscape
2.8 software [53] to generate and visualize the networks.
Briefly, each individual is considered a Source node and each
OTU is a Target node. Target nodes were linked to Source
nodes in a bipartite network, with connections between
Sources and Targets modeled as springs; both Source and
Target nodes are placed in such a way as to minimize the
forces across the network. The partial correlation network
was constructed by “GeneNet” package in R [54]. The partial
correlation coefficients were calculated from the abundance
frequency of the 123 genera for the 152 individuals and the
significance of correlations was estimated by permutation.
We used an FDR (false discovery rate) of 0.01 as a cutoff to
choose the top-ranked correlations among genera to build
the connection network. For simplicity, we only displayed
the connections among the 28 most common genera (i.e.
those with a frequency >0.5% in either the Alaskan, German
or African group). Additionally, the phylogenetic tree in
Figure 1 was implemented in the ARB program package
[55] using the Jukes-Cantor correction.
Additional files
Additional file 1: Figure S1. Map of sampling locations and pie charts
showing the frequencies of the distribution of microbial genera detected
in 4 native Alaskan groups.
Additional file 2: Figure S2. Alpha and beta diversity analysis for four
Alaskan groups at the genus level. The stars between two groups
indicate significant differences, based on Mann–Whitney U tests.
Additional file 3: Figure S3. Heat plot of the abundance of each
bacterial genus in each individual. Each numbered column corresponds
to a genus, and each row is an individual saliva sample.
Additional file 4: Table S1. Frequency differences in genera
abundance.
Additional file 5: Figure S4. Pairwise correlation matrix between
individuals calculated from bacteria abundance at the genus level.
Additional file 6: Table S2. Number of connections from the partial
correlation network assigned to different phyla.
Additional file 7: Figure S5. Comparison of interactions at the phylum
level.
Additional file 8: Figure S6. Pairwise correlation matrix between
individuals calculated from the frequency abundance at the OTU level.
Additional file 9: Table S3. Comparison of 56 core OTUs with
published results from HMP.
Additional file 10: Table S4. Results from subsampling.
Additional file 11: Figure S7. Comparison of the rarefaction analysis
from original and subsampled reads.
Additional file 12: Figure S8. Comparison of the UniFrac analysis from
original and subsampled reads.
Additional file 13: Figure S9. Comparison of the alpha- and
beta-diversity analysis from original and subsampled reads.
Additional file 14: Figure S10. Rarefaction analysis by subsampling 10
individuals from each group.
Page 12 of 13
Additional file 15: Figure S11. Diversity analysis by subsampling 10
individuals from each group.
Competing interests
The authors declare that they have no competing interests.
Authors’ contributions
MS designed the study. JAR and MGH collected the samples. MR and DQ
carried out the laboratory work. JL, HPH, and ML analyzed the data. MS, JL,
and HPH wrote the manuscript. All authors read and approved the final
manuscript.
Acknowledgements
We thank all individuals who kindly donated a sample for this study, and the
late Ivane Nasidze for valuable contributions to this work. This research was
funded by the Max Planck Society and the National Science Foundation
(OPP-0732857). Jing Li was supported by the National Science Foundation of
China (NSFC) grant (31370505).
Author details
1
Max Planck Institute for Evolutionary Anthropology, Deutscher Platz 6,
D-04103 Leipzig, Germany. 2Max Planck Independent Research Group on
Population Genomics, Chinese Academy of Sciences and Max Planck Society
(CAS-MPG) Partner Institute for Computational Biology, Shanghai Institutes
for Biological Sciences, Chinese Academy of Sciences, 320 Yueyang Road,
Shanghai 200031, China. 3Division of Virology, Institute of Medical
Microbiology, RWTH Aachen University Hospital, Pauwelsstrasse 30, D-52057
Aachen, Germany. 4Division of Endocrinology, Metabolism, and Molecular
Medicine, Department of Medicine, Northwestern University Feinberg School
of Medicine, Chicago, IL 60611, USA. 5Department of Anthropology,
Northwestern University, Evanston, IL 60208, USA. 6Center for Genetic
Medicine, Northwestern University Feinberg School of Medicine, Chicago, IL
60611, USA. 7Current address: Department of Genetics, Harvard Medical
School, 77 Louis Pasteur Avenue, Boston, MA 02115, USA. 8Current address:
Department of Anthropology, University of Texas, Austin, TX 78712, USA.
Received: 19 August 2014 Accepted: 27 November 2014
References
1. Gill SR, Pop M, Deboy RT, Eckburg PB, Turnbaugh PJ, Samuel BS, Gordon JI,
Relman DA, Fraser-Liggett CM, Nelson KE: Metagenomic analysis of the
human distal gut microbiome. Science 2006, 312(5778):1355–1359.
2. Pflughoeft KJ, Versalovic J: Human microbiome in health and disease.
Annu Rev Pathol 2012, 7:99–122.
3. Greenblum S, Turnbaugh PJ, Borenstein E: Metagenomic systems biology
of the human gut microbiome reveals topological shifts associated with
obesity and inflammatory bowel disease. Proc Natl Acad Sci U S A 2012,
109(2):594–599.
4. Ley RE: Obesity and the human microbiome. Curr Opin Gastroenterol 2010,
26(1):5–11.
5. Huttenhower C, Gevers D, Knight R, Abubucker S, Badger JH, Chinwalla AT,
Creasy HH, Earl AM, FitzGerald MG, Fulton RS, Giglio MG, Hallsworth-Pepin K,
Lobos EA, Madupu R, Magrini V, Martin JC, Mitreva M, Muzny DM, Sodergren
EJ, Versalovic J, Wollam AM, Worley KC, Wortman JR, Young SK, Zeng QD,
Aagaard KM, Abolude OO, Allen-Vercoe E, Alm EJ, Alvarado L, et al:
Structure, function and diversity of the healthy human microbiome.
Nature 2012, 486(7402):207–214.
6. Methe BA, Nelson KE, Pop M, Creasy HH, Giglio MG, Huttenhower C, Gevers
D, Petrosino JF, Abubucker S, Badger JH, Chinwalla AT, Earl AM, FitzGerald
MG, Fulton RS, Hallsworth-Pepin K, Lobos EA, Madupu R, Magrini V, Martin
JC, Mitreva M, Muzny DM, Sodergren EJ, Versalovic J, Wollam AM, Worley KC,
Wortman JR, Young SK, Zeng Q, Aagaard KM, Abolude OO, et al: A framework
for human microbiome research. Nature 2012, 486(7402):215–221.
7. Costello EK, Lauber CL, Hamady M, Fierer N, Gordon JI, Knight R: Bacterial
Community Variation in Human Body Habitats Across Space and Time.
Science 2009, 326(5960):1694–1697.
8. Qin JJ, Li RQ, Raes J, Arumugam M, Burgdorf KS, Manichanh C, Nielsen T,
Pons N, Levenez F, Yamada T, Mende DR, Li JH, Xu JM, Li SC, Li DF, Cao JJ,
Wang B, Liang HQ, Zheng HS, Xie YL, Tap J, Lepage P, Bertalan M, Batto JM,
Li et al. BMC Microbiology 2014, 14:316
http://www.biomedcentral.com/1471-2180/14/316
9.
10.
11.
12.
13.
14.
15.
16.
17.
18.
19.
20.
21.
22.
23.
24.
25.
26.
27.
28.
29.
30.
31.
32.
33.
34.
Hansen T, Le Paslier D, Linneberg A, Nielsen HB, Pelletier E, Renault P, et al:
A human gut microbial gene catalogue established by metagenomic
sequencing. Nature 2010, 464(7285):59–U70.
Yatsunenko T, Rey FE, Manary MJ, Trehan I, Dominguez-Bello MG, Contreras
M, Magris M, Hidalgo G, Baldassano RN, Anokhin AP, Heath AC, Warner B,
Reeder J, Kuczynski J, Caporaso JG, Lozupone CA, Lauber C, Clemente JC,
Knights D, Knight R, Gordon JI: Human gut microbiome viewed across
age and geography. Nature 2012, 486(7402):222–227.
Meurman JH: Oral microbiota and cancer. J Oral Microbiol 2010, 2:5195–5205.
Awano S, Ansai T, Takata Y, Soh I, Akifusa S, Hamasaki T, Yoshida A, Sonoki
K, Fujisawa K, Takehara T: Oral health and mortality risk from pneumonia
in the elderly. J Dent Res 2008, 87(4):334–339.
Beck JD, Offenbacher S: Systemic effects of periodontitis: epidemiology of
periodontal disease and cardiovascular disease. J Periodontol 2005,
76(11 Suppl):2089–2100.
Joshipura KJ, Hung HC, Rimm EB, Willett WC, Ascherio A: Periodontal disease,
tooth loss, and incidence of ischemic stroke. Stroke 2003, 34(1):47–52.
Joshipura KJ, Rimm EB, Douglass CW, Trichopoulos D, Ascherio A, Willett WC:
Poor oral health and coronary heart disease. J Dent Res 1996, 75(9):1631–1636.
Offenbacher S, Jared HL, O’Reilly PG, Wells SR, Salvi GE, Lawrence HP,
Socransky SS, Beck JD: Potential pathogenic mechanisms of periodontitis
associated pregnancy complications. Ann Periodontol 1998, 3(1):233–250.
Seymour GJ, Ford PJ, Cullinan MP, Leishman S, Yamazaki K: Relationship
between periodontal infections and systemic disease. Clin Microbiol Infec
2007, 13:3–10.
Sheiham A, Watt RG: The common risk factor approach: a rational basis for
promoting oral health. Community Dent Oral Epidemiol 2000, 28(6):399–406.
Darout IA, Albandar JM, Skaug N, Ali RW: Salivary microbiota levels in
relation to periodontal status, experience of caries and miswak use in
Sudanese adults (vol 29, pg 411, 2002). J Clin Periodontol 2002, 29(10):964.
Crielaard W, Zaura E, Schuller AA, Huse SM, Montijn RC, Keijser BJF:
Exploring the oral microbiota of children at various developmental
stages of their dentition in the relation to their oral health.
Bmc Med Genomics 2011, 4:22–43.
Aas JA, Paster BJ, Stokes LN, Olsen I, Dewhirst FE: Defining the normal
bacterial flora of the oral cavity. J Clin Microbiol 2005, 43(11):5721–5732.
Nasidze I, Li J, Quinque D, Tang K, Stoneking M: Global diversity in the
human salivary microbiome. Genome Res 2009, 19(4):636–643.
Ledder RG, Gilbert P, Huws SA, Aarons L, Ashley MP, Hull PS, McBain AJ:
Molecular analysis of the subgingival microbiota in health and disease.
Appl Environ Microbiol 2007, 73(2):516–523.
Nasidze I, Li J, Schroeder R, Creasey JL, Li M, Stoneking M: High diversity of
the saliva microbiome in Batwa Pygmies. PLoS One 2011, 6(8):e23352.
Mason MR, Nagaraja HN, Camerlengo T, Joshi V, Kumar PS: Deep
sequencing identifies ethnicity-specific bacterial signatures in the oral
microbiome. PLoS One 2013, 8(10):e77287.
Quince C, Lanzen A, Davenport RJ, Turnbaugh PJ: Removing Noise From
Pyrosequenced Amplicons. BMC Bioinformatics 2011, 12:38–62.
Wang Q, Garrity GM, Tiedje JM, Cole JR: Naive Bayesian classifier for rapid
assignment of rRNA sequences into the new bacterial taxonomy.
Appl Environ Microbiol 2007, 73(16):5261–5267.
Horz HP, Ten Haaf A, Kessler O, Yekta SS, Seyfarth I, Hettlich M, Lampert F,
Kupper T, Conrads G: T-RFLP-based differences in oral microbial
communities as risk factor for development of oral diseases under
stress. Env Microbiol Rep 2012, 4(4):390–397.
Kolenbrander PE, Andersen RN, Blehert DS, Egland PG, Foster JS, Palmer RJ:
Communication among oral bacteria. Microbiol Mol Biol R 2002, 66(3):486–505.
Huse SM, Ye YZ, Zhou YJ, Fodor AA: A Core Human Microbiome as
Viewed through 16S rRNA Sequence Clusters. PLoS One 2012, 7(6):e34242.
Li K, Bihan M, Methe BA: Analyses of the Stability and Core Taxonomic
Memberships of the Human Microbiome. PLoS One 2013, 8(5):e63139.
Wolff L, Dahlen G, Aeppli D: Bacteria as Risk Markers for Periodontitis.
J Periodontol 1994, 65(5):498–510.
Navia JM: Carbohydrates and dental health. Am J Clin Nutr 1994,
59(3 Suppl):719S–727S.
Foster JA, Krone SM, Forney LJ: Application of ecological network theory
to the human microbiome. Interdiscip Perspect Infect Dis 2008, 2008:839501.
Periasamy S, Kolenbrander PE: Central Role of the Early Colonizer
Veillonella sp in Establishing Multispecies Biofilm Communities with
Initial, Middle, and Late Colonizers of Enamel. J Bacteriol 2010,
192(12):2965–2972.
Page 13 of 13
35. Liu B, Faller LL, Klitgord N, Mazumdar V, Ghodsi M, Sommer DD, Gibbons
TR, Treangen TJ, Chang YC, Li S, Stine OC, Hasturk H, Kasif S, Segre D, Pop
M, Amar S: Deep Sequencing of the Oral Microbiome Reveals Signatures
of Periodontal Disease. PLoS One 2012, 7(6):e37919.
36. Faust K, Sathirapongsasuti JF, Izard J, Segata N, Gevers D, Raes J,
Huttenhower C: Microbial Co-occurrence Relationships in the Human
Microbiome. Plos Comput Biol 2012, 8(7):e1002606.
37. Shade A, Handelsman J: Beyond the Venn diagram: the hunt for a core
microbiome. Environ Microbiol 2012, 14(1):4–12.
38. Kandhai MC, Reij MW, Grognou C, van Schothorst M, Gorris LGM, Zwietering
MH: Effects of preculturing conditions on lag time and specific growth
rate of Enterobacter sakazakii in reconstituted powdered infant formula.
Appl Environ Microb 2006, 72(4):2721–2729.
39. Ratkowsky DA, Lowry RK, Mcmeekin TA, Stokes AN, Chandler RE: Model for
Bacterial Culture-Growth Rate Throughout the Entire Biokinetic
Temperature-Range. J Bacteriol 1983, 154(3):1222–1226.
40. Eber MR, Shardell M, Schweizer ML, Laxminarayan R, Perencevich EN:
Seasonal and Temperature-Associated Increases in Gram-Negative
Bacterial Bloodstream Infections among Hospitalized Patients.
PLoS One 2011, 6(9):e25298.
41. Anderson DJ, Richet H, Chen LF, Spelman DW, Hung YJ, Huang AT, Sexton
DJ, Raoult D: Seasonal variation in Klebsiella pneumoniae bloodstream
infection on 4 continents. J Infect Dis 2008, 197(5):752–756.
42. Doyle F, Zehner WJ, Terndrup TE: The Effect of Ambient-Temperature
Extremes on Tympanic and Oral Temperatures. Am J Emerg Med 1992,
10(4):285–289.
43. Sloan REG, Keatinge WR: Depression of Sublingual Temperature by Cold
Saliva. Brit Med J 1975, 1(5960):718–720.
44. Quinque D, Kittler R, Kayser M, Stoneking M, Nasidze I: Evaluation of saliva
as a source of human DNA for population and association studies.
Anal Biochem 2006, 353(2):272–277.
45. Sundquist A, Bigdeli S, Jalili R, Druzin ML, Waller S, Pullen KM, El-Sayed YY,
Taslimi MM, Batzoglou S, Ronaghi M: Bacterial flora-typing with targeted,
chip-based Pyrosequencing. BMC Microbiol 2007, 7:108–122.
46. Meyer M, Stenzel U, Hofreiter M: Parallel tagged sequencing on the 454
platform. Nat Protoc 2008, 3(2):267–278.
47. Ashelford KE, Chuzhanova NA, Fry JC, Jones AJ, Weightman AJ: New
screening software shows that most recent large 16S rRNA gene clone
libraries contain chimeras. Appl Environ Microbiol 2006, 72(9):5734–5741.
48. Cole JR, Wang Q, Cardenas E, Fish J, Chai B, Farris RJ, Kulam-Syed-Mohideen
AS, McGarrell DM, Marsh T, Garrity GM, Tiedje JM: The Ribosomal Database
Project: improved alignments and new tools for rRNA analysis.
Nucleic Acids Res 2009, 37:D141–D145.
49. Excoffier L, Lischer HEL: Arlequin suite ver 3.5: a new series of programs
to perform population genetics analyses under Linux and Windows.
Mol Ecol Resour 2010, 10(3):564–567.
50. Nawrocki EP, Kolbe DL, Eddy SR: Infernal 1.0: inference of RNA alignments.
Bioinformatics 2009, 25(10):1335–1337.
51. Price MN, Dehal PS, Arkin AP: FastTree: Computing Large Minimum
Evolution Trees with Profiles instead of a Distance Matrix. Mol Biol Evol
2009, 26(7):1641–1650.
52. Hamady M, Lozupone C, Knight R: Fast UniFrac: facilitating high-throughput
phylogenetic analyses of microbial communities including analysis of
pyrosequencing and PhyloChip data. Isme J 2010, 4(1):17–27.
53. Smoot ME, Ono K, Ruscheinski J, Wang PL, Ideker T: Cytoscape 2.8: new
features for data integration and network visualization. Bioinformatics
2011, 27(3):431–432.
54. Opgen-Rhein R, Strimmer K: From correlation to causation networks:
a simple approximate learning algorithm and its application to
high-dimensional plant gene expression data. BMC Syst Biol 2007, 1:37–51.
55. Ludwig W, Strunk O, Westram R, Richter L, Meier H, Yadhukumar, Buchner A,
Lai T, Steppi S, Jobb G, Forster W, Brettske I, Gerber S, Ginhart AW, Gross O,
Grumann S, Hermann S, Jost R, Konig A, Liss T, Lussmann R, May M,
Nonhoff B, Reichel B, Strehlow R, Stamatakis A, Stuckmann N, Vilbig A,
Lenke M, Ludwig T, et al: ARB: a software environment for sequence data.
Nucleic Acids Res 2004, 32(4):1363–1371.
doi:10.1186/s12866-014-0316-1
Cite this article as: Li et al.: Comparative analysis of the human saliva
microbiome from different climate zones: Alaska, Germany, and Africa.
BMC Microbiology 2014 14:316.
© Copyright 2026