
Investment Strategy
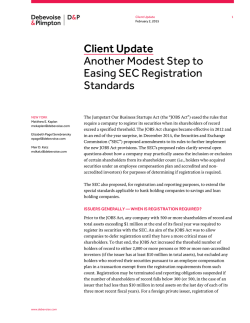
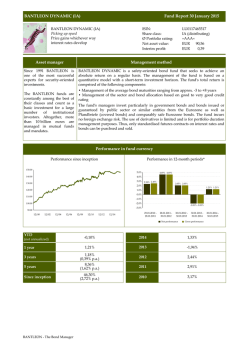
Investment Strategy
Published by Raymond James & Associates
February 2, 2015
Investment Strategy __________________________________________________________________________________________
Jeffrey D. Saut, Chief Investment Strategist, (727) 567-2644, [email protected]
"The January Barometer"
It’s that time of year again when the media is abuzz with that old stock market saying, “so goes January, so goes the year.”
With the D-J Industrial Average (INDU/17164.95) off by 3.69% for the month of January, and the S&P 500 (SPX/1994.99) down
3.10%, it is worth revisiting the January Barometer. Devised by Yale Hirsch in 1972, as reprised in his publication The Stock
Traders’ Almanac, the January Barometer states, “As goes the month of January, so goes the year,” obviously referring to the
direction of the equity markets.
According to the Stock Trader’s Almanac (as paraphrased by me):
The January Barometer has registered eight major errors since 1950 for an 87.7% accuracy ratio. This indicator adheres to the
propensity that as the S&P 500 goes in January, so goes the year. Of the eight major errors, Vietnam affected 1966 and 1968.
1982 saw the start of a major bull market in August. Two January rate cuts and 9/11 affected 2001. The market in January
2003 was held down by the anticipation of military action in Iraq. The second worst bear market since 1900 ended in March of
2009 and Federal Reserve intervention influenced 2010 and 2014. Including the eight flat years yields a .754 batting average.
. . . [For 2015] it’s official; our January Barometer indicator is negative again for the second year in a row and five of the last
eight years. Since the start of the secular bear market in 2000 January has been down 7 of the last 15 years with an average
loss of 1.2% on the S&P and Dow, and a fractional gain of 0.1% for NASDAQ. Five of the indicators’ eight major errors have
occurred in this 15-year timeframe.
While the January Barometer has a decent track record there is another tried and true indicator to be considered. Again, as
scribed by the astute Hirsch Organization (paraphrased):
When the Dow closes below its December closing low in the first quarter, it is frequently an excellent warning sign. Jeffrey
Saut, managing director of investment strategy at Raymond James, brought this to our attention a few years ago. The
December Low Indicator was originated by Lucien Hooper, a Forbes columnist and Wall Street analyst back in the 1970s.
Hooper dismissed the importance of January’s first week and the entire month. Instead, said Hooper, “Pay much more
attention to the December low. If that low is violated during the first quarter of the New Year, watch out!”
In the current case, 2014’s December low for D-J Industrials was 17068.87 and 1972.74 for the S&P 500. Alas, it feels like
almost yesterday when Lucien imparted the December Low Indicator to me at “Harry’s at the Amex Bar & Grill” over cocktails
in 1971. I miss Lucien, but I never forgot his indicator, which when taken in concert with the January Barometer produces an
unbelievable combined track record. That said, there is one problem with the January Barometer, it includes the
performance of the month of January in the yearly returns! Since investors typically have to wait until the end of January to
see what the January Barometer “says,” one has to wonder what the yearly gains look like excluding January’s performance,
but that’s a discussion for another time.
Given these thoughts, investors will be watching the December Low Indicator very intently this week, which is shaping up as a
do or die week. As often stated, the SPX has basically been trapped between its support zone of 1990 – 2000, and its
overhead resistance zone at 2060 – 2080, since late October of last year. Also as stated by Andrew Adams and myself, if the
1990 level is violated to the downside, it would present a disturbing chart pattern. This year’s action, however, should come
as no surprise because since late December I have repeatedly opined that the first few months of 2015 were going to be rocky
and volatile, Q.E.D. Now that I have discussed some of the “bad,” let’s talk about the “good.”
Recently, I have been “clubbed” with the statement that the equity markets have never been up seven years in a row. While
true, such mantras have little meaning on the Street of Dreams. Recall those same “clubbers” said the equity markets
couldn’t go down three years in a row and they certainly did. So, what’s the good? Well, since World War II the SPX has
never suffered a loss in the third year of the presidential cycle; and, this is the third year of said cycle. Moreover, January was
a down month in 2014, and the equity markets still turned in a decent performance. Then there is the “Rule of 5’s.” To wit,
since 1885 there have been 13 years ending in the number 5. In 12 of those 13 years the equity markets have been up. Or
how about this, since its inception there have been seven instances where the U.S. Dollar Index has rallied more than 10% in a
year, like it did in 2014, and in the following year the SPX was up every time. Further, since 1962 there have been only four
Please read domestic and foreign disclosure/risk information beginning on page 4 and Analyst Certification on page 4.
© 2015 Raymond James & Associates, Inc., member New York Stock Exchange/SIPC. All rights reserved.
International Headquarters: The Raymond James Financial Center | 880 Carillon Parkway | St. Petersburg, Florida 33716 | 800-248-8863
Raymond James
Investment Strategy
occurrences where the yield on the S&P 500 has been greater than the yield on the 10-year T’note like happened in midJanuary 2015. In the three previous instances the SPX’s performance three months later has shown a median gain of 9.5%.
Meanwhile, 63.5% of the companies that have reported 4Q14 earnings have beaten estimates and 57% have bettered
revenue estimates. That said, it is worth mentioning the spread between companies raising versus lowering forward earnings
guidance leans toward lowering guidance by more than 8%. As for sectors, Healthcare and Technology currently have the
best 4Q14 earnings momentum, while Consumer Staples, Telecom, and Utilities have the worst.
Turning to the technicals, as my colleague Andrew Adams pointed out in last Thursday’s “Morning Tack,” as featured in this
week’s Barron’s, “The range-bound trading we have experienced this month looks to be forming an almost picture-perfect
Double Top pattern (see chart 1), which resembles the letter ‘M,’ and a daily close below 1990 would complete this pattern
and signal further losses are more likely than not.” I would add the chart pattern also looks conspicuously like a “head and
shoulders” topping pattern whose “neckline” would be broken to the downside with a close by the SPX below 1990 (read:
negatively). Also of interest is that the SPX has fallen below its 150-day moving average at 1996.94, a moving average that
has supported the S&P 500 for the past few months. Obviously, all of this makes the upcoming week very important in the
scheme of things for the near-term direction of the equity markets. A close below 1990 would indeed activate lower price
targets on a short-term trading basis of 1972 and then 1952. Failing to hold those levels would suggest a drop to the 1900 –
1920 level. We remain cautious.
To conclude, last Friday a TV anchor surprised me by asking “on air,” “What did you think was the biggest surprise in the
markets this week?” I responded, “The new Greek PM and Finance Minister who said there will be no cooperation on the
debt situation with the EU. Those comments sent the Athens stock market down 14% with Greek bank stocks, and the Greek
debt complex, getting crushed.” On more contemplation, I would amend that answer by noting crude oil looks to have
bottomed. Indeed, on Thursday the March futures crude oil contract made an “undercut low” (a lower print low than the
previous reaction low). Then on Friday that same contract traded higher by more than 8% (see chart 2). Ladies and
gentlemen, this is how the October 4, 2011 “undercut low” was made by the S&P 500, and it just may be the way the now
eight-month mini-crash in crude prices ends.
The call for this week: Interestingly, given what crude oil did on Friday, I am hosting a conference call with my friend Troy
Shaver. With a background in geology, Troy embraces immense knowledge about the battered energy complex and the
stocks du jour. He is captain of Dividend Assets Capital and was chosen a number of years ago as the outside portfolio
manager for the Goldman Sachs Rising Dividend Fund (GSRAX/$20.79), which I own. Those of you that have heard the two of
us at last year’s Raymond James national conference, or on previous conference calls, know the verbal exchange tomorrow
will be informative. The call is slated for Tuesday at 4:15 p.m. and the phone number and password are: (888) 329-8905;
6106339. As for the equity markets, over the weekend we went to the symphony to hear the celebrated cellist Yo Yo Ma. In
certain dialects the term “yo yo” means “come back-come back.” Hopefully, this week the stock markets will “come back . . .
come back.” And this morning that’s exactly what the equity markets are trying to do as Greece unveils a new debt relief
program to the EU. Regrettably, I do not trust the early morning strength.
© 2015 Raymond James & Associates, Inc., member New York Stock Exchange/SIPC. All rights reserved.
International Headquarters: The Raymond James Financial Center | 880 Carillon Parkway | St. Petersburg, Florida 33716 | 800-248-8863
2
Raymond James
Investment Strategy
Chart 1
Source: TC2000
Chart 2
Source: ThomsonReuters
© 2015 Raymond James & Associates, Inc., member New York Stock Exchange/SIPC. All rights reserved.
International Headquarters: The Raymond James Financial Center | 880 Carillon Parkway | St. Petersburg, Florida 33716 | 800-248-8863
3
Raymond James
Investment Strategy
Important Investor Disclosures
Raymond James & Associates (RJA) is a FINRA member firm and is responsible for the preparation and distribution of research created in
the United States. Raymond James & Associates is located at The Raymond James Financial Center, 880 Carillon Parkway, St. Petersburg,
FL 33716, (727) 567-1000. Non-U.S. affiliates, which are not FINRA member firms, include the following entities which are responsible for
the creation and distribution of research in their respective areas; In Canada, Raymond James Ltd. (RJL), Suite 2100, 925 West Georgia
Street, Vancouver, BC V6C 3L2, (604) 659-8200; In Latin America, Raymond James Latin America (RJLatAm), Ruta 8, km 17, 500, 91600
Montevideo, Uruguay, 00598 2 518 2033; In Europe, Raymond James Euro Equities, SAS (RJEE), 40, rue La Boetie, 75008, Paris, France,
+33 1 45 61 64 90.
This document is not directed to, or intended for distribution to or use by, any person or entity that is a citizen or resident of or located in
any locality, state, country, or other jurisdiction where such distribution, publication, availability or use would be contrary to law or
regulation. The securities discussed in this document may not be eligible for sale in some jurisdictions. This research is not an offer to sell
or the solicitation of an offer to buy any security in any jurisdiction where such an offer or solicitation would be illegal. It does not
constitute a personal recommendation or take into account the particular investment objectives, financial situations, or needs of
individual clients. Past performance is not a guide to future performance, future returns are not guaranteed, and a loss of original capital
may occur. Investors should consider this report as only a single factor in making their investment decision.
For clients in the United States: Any foreign securities discussed in this report are generally not eligible for sale in the U.S. unless they are
listed on a U.S. exchange. This report is being provided to you for informational purposes only and does not represent a solicitation for the
purchase or sale of a security in any state where such a solicitation would be illegal. Investing in securities of issuers organized outside of the
U.S., including ADRs, may entail certain risks. The securities of non-U.S. issuers may not be registered with, nor be subject to the reporting
requirements of, the U.S. Securities and Exchange Commission. There may be limited information available on such securities. Investors who
have received this report may be prohibited in certain states or other jurisdictions from purchasing the securities mentioned in this report.
Please ask your Financial Advisor for additional details and to determine if a particular security is eligible for purchase in your state.
The information provided is as of the date above and subject to change, and it should not be deemed a recommendation to buy or sell
any security. Certain information has been obtained from third-party sources we consider reliable, but we do not guarantee that such
information is accurate or complete. Persons within the Raymond James family of companies may have information that is not available
to the contributors of the information contained in this publication. Raymond James, including affiliates and employees, may execute
transactions in the securities listed in this publication that may not be consistent with the ratings appearing in this publication.
Additional information is available on request.
Analyst Information
Registration of Non-U.S. Analysts: The analysts listed on the front of this report who are not employees of Raymond James & Associates,
Inc., are not registered/qualified as research analysts under FINRA rules, are not associated persons of Raymond James & Associates, Inc.,
and are not subject to NASD Rule 2711 and NYSE Rule 472 restrictions on communications with covered companies, public companies,
and trading securities held by a research analyst account.
Analyst Holdings and Compensation: Equity analysts and their staffs at Raymond James are compensated based on a salary and bonus
system. Several factors enter into the bonus determination including quality and performance of research product, the analyst's success
in rating stocks versus an industry index, and support effectiveness to trading and the retail and institutional sales forces. Other factors
may include but are not limited to: overall ratings from internal (other than investment banking) or external parties and the general
productivity and revenue generated in covered stocks.
The views expressed in this report accurately reflect the personal views of the analyst(s) covering the subject securities. No part
of said person's compensation was, is, or will be directly or indirectly related to the specific recommendations or views
contained in this research report. In addition, said analyst has not received compensation from any subject company in the last
12 months.
Ratings and Definitions
Raymond James & Associates (U.S.) definitions
Strong Buy (SB1) Expected to appreciate, produce a total return of at least 15%, and outperform the S&P 500 over the next six to 12 months.
For higher yielding and more conservative equities, such as REITs and certain MLPs, a total return of at least 15% is expected to be realized
over the next 12 months.
Outperform (MO2) Expected to appreciate and outperform the S&P 500 over the next 12-18 months. For higher yielding and more
conservative equities, such as REITs and certain MLPs, an Outperform rating is used for securities where we are comfortable with the relative
safety of the dividend and expect a total return modestly exceeding the dividend yield over the next 12-18 months.
Market Perform (MP3) Expected to perform generally in line with the S&P 500 over the next 12 months.
Underperform (MU4) Expected to underperform the S&P 500 or its sector over the next six to 12 months and should be sold.
© 2015 Raymond James & Associates, Inc., member New York Stock Exchange/SIPC. All rights reserved.
International Headquarters: The Raymond James Financial Center | 880 Carillon Parkway | St. Petersburg, Florida 33716 | 800-248-8863
4
Raymond James
Investment Strategy
Suspended (S) The rating and price target have been suspended temporarily. This action may be due to market events that made coverage
impracticable, or to comply with applicable regulations or firm policies in certain circumstances, including when Raymond James may be
providing investment banking services to the company. The previous rating and price target are no longer in effect for this security and should
not be relied upon.
Raymond James Ltd. (Canada) definitions
Strong Buy (SB1) The stock is expected to appreciate and produce a total return of at least 15% and outperform the S&P/TSX Composite Index
over the next six months.
Outperform (MO2) The stock is expected to appreciate and outperform the S&P/TSX Composite Index over the next twelve months.
Market Perform (MP3) The stock is expected to perform generally in line with the S&P/TSX Composite Index over the next twelve months and
is potentially a source of funds for more highly rated securities.
Underperform (MU4) The stock is expected to underperform the S&P/TSX Composite Index or its sector over the next six to twelve months
and should be sold.
Raymond James Latin American rating definitions
Strong Buy (SB1) Expected to appreciate and produce a total return of at least 25.0% over the next twelve months.
Outperform (MO2) Expected to appreciate and produce a total return of between 15.0% and 25.0% over the next twelve months.
Market Perform (MP3) Expected to perform in line with the underlying country index.
Underperform (MU4) Expected to underperform the underlying country index.
Suspended (S) The rating and price target have been suspended temporarily. This action may be due to market events that made coverage
impracticable, or to comply with applicable regulations or firm policies in certain circumstances, including when Raymond James may be
providing investment banking services to the company. The previous rating and price target are no longer in effect for this security and should
not be relied upon.
Raymond James Euro Equities, SAS rating definitions
Strong Buy (1) Expected to appreciate, produce a total return of at least 15%, and outperform the Stoxx 600 over the next 6 to 12 months.
Outperform (2) Expected to appreciate and outperform the Stoxx 600 over the next 12 months.
Market Perform (3) Expected to perform generally in line with the Stoxx 600 over the next 12 months.
Underperform (4) Expected to underperform the Stoxx 600 or its sector over the next 6 to 12 months.
Suspended (S) The rating and target price have been suspended temporarily. This action may be due to market events that made coverage
impracticable, or to comply with applicable regulations or firm policies in certain circumstances, including when Raymond James may be
providing investment banking services to the company. The previous rating and target price are no longer in effect for this security and should
not be relied upon.
In transacting in any security, investors should be aware that other securities in the Raymond James research coverage universe might carry a
higher or lower rating. Investors should feel free to contact their Financial Advisor to discuss the merits of other available investments.
Rating Distributions
Coverage Universe Rating Distribution*
Investment Banking Distribution
RJA
RJL
RJ LatAm
RJEE
RJA
RJL
RJ LatAm
RJEE
Strong Buy and Outperform (Buy)
54%
65%
50%
46%
25%
39%
0%
0%
Market Perform (Hold)
40%
34%
50%
39%
8%
17%
0%
0%
Underperform (Sell)
6%
2%
0%
15%
0%
0%
0%
0%
* Columns may not add to 100% due to rounding.
Suitability Categories (SR)
Total Return (TR) Lower risk equities possessing dividend yields above that of the S&P 500 and greater stability of principal.
Growth (G) Low to average risk equities with sound financials, more consistent earnings growth, at least a small dividend, and the potential
for long-term price appreciation.
Aggressive Growth (AG) Medium or higher risk equities of companies in fast growing and competitive industries, with less predictable earnings
and acceptable, but possibly more leveraged balance sheets.
High Risk (HR) Companies with less predictable earnings (or losses), rapidly changing market dynamics, financial and competitive issues,
higher price volatility (beta), and risk of principal.
Venture Risk (VR) Companies with a short or unprofitable operating history, limited or less predictable revenues, very high risk associated
with success, and a substantial risk of principal.
© 2015 Raymond James & Associates, Inc., member New York Stock Exchange/SIPC. All rights reserved.
International Headquarters: The Raymond James Financial Center | 880 Carillon Parkway | St. Petersburg, Florida 33716 | 800-248-8863
5
Raymond James
Investment Strategy
Raymond James Relationship Disclosures
Raymond James expects to receive or intends to seek compensation for investment banking services from the subject companies in the
next three months.
Stock Charts, Target Prices, and Valuation Methodologies
Valuation Methodology: The Raymond James methodology for assigning ratings and target prices includes a number of qualitative and
quantitative factors including an assessment of industry size, structure, business trends and overall attractiveness; management effectiveness;
competition; visibility; financial condition, and expected total return, among other factors. These factors are subject to change depending on
overall economic conditions or industry- or company-specific occurrences. Only stocks rated Strong Buy (SB1) or Outperform (MO2) have
target prices and thus valuation methodologies.
Target Prices: The information below indicates target price and rating changes for the subject companies included in this research.
Risk Factors
General Risk Factors: Following are some general risk factors that pertain to the projected target prices included on Raymond James research:
(1) Industry fundamentals with respect to customer demand or product / service pricing could change and adversely impact expected
revenues and earnings; (2) Issues relating to major competitors or market shares or new product expectations could change investor attitudes
toward the sector or this stock; (3) Unforeseen developments with respect to the management, financial condition or accounting policies or
practices could alter the prospective valuation; or (4) External factors that affect the U.S. economy, interest rates, the U.S. dollar or major
segments of the economy could alter investor confidence and investment prospects. International investments involve additional risks such as
currency fluctuations, differing financial accounting standards, and possible political and economic instability.
Additional Risk and Disclosure information, as well as more information on the Raymond James rating system and suitability
categories, is available at rjcapitalmarkets.com/Disclosures/index. Copies of research or Raymond James’ summary policies relating to
research analyst independence can be obtained by contacting any Raymond James & Associates or Raymond James Financial Services
office (please see raymondjames.com for office locations) or by calling 727-567-1000, toll free 800-237-5643 or sending a written
request to the Equity Research Library, Raymond James & Associates, Inc., Tower 3, 6th Floor, 880 Carillon Parkway, St. Petersburg, FL
33716.
International securities involve additional risks such as currency fluctuations, differing financial accounting standards, and possible
political and economic instability. These risks are greater in emerging markets.
Small-cap stocks generally involve greater risks. Dividends are not guaranteed and will fluctuate. Past performance may not be indicative
of future results.
Investors should consider the investment objectives, risks, and charges and expenses of mutual funds and exchange-traded funds
carefully before investing. The prospectus contains this and other information about mutual funds and exchange –traded funds. The
prospectus is available from your financial advisor and should be read carefully before investing.
For clients in the United Kingdom:
For clients of Raymond James & Associates (London Branch) and Raymond James Financial International Limited (RJFI): This document
and any investment to which this document relates is intended for the sole use of the persons to whom it is addressed, being persons
who are Eligible Counterparties or Professional Clients as described in the FCA rules or persons described in Articles 19(5) (Investment
professionals) or 49(2) (High net worth companies, unincorporated associations etc) of the Financial Services and Markets Act 2000
(Financial Promotion) Order 2005 (as amended) or any other person to whom this promotion may lawfully be directed. It is not intended
to be distributed or passed on, directly or indirectly, to any other class of persons and may not be relied upon by such persons and is
therefore not intended for private individuals or those who would be classified as Retail Clients.
For clients of Raymond James Investment Services, Ltd.: This report is for the use of professional investment advisers and managers and
is not intended for use by clients.
For purposes of the Financial Conduct Authority requirements, this research report is classified as independent with respect to conflict of
interest management. RJA, RJFI, and Raymond James Investment Services, Ltd. are authorised and regulated by the Financial Conduct
Authority in the United Kingdom.
© 2015 Raymond James & Associates, Inc., member New York Stock Exchange/SIPC. All rights reserved.
International Headquarters: The Raymond James Financial Center | 880 Carillon Parkway | St. Petersburg, Florida 33716 | 800-248-8863
6
Raymond James
Investment Strategy
For clients in France:
This document and any investment to which this document relates is intended for the sole use of the persons to whom it is addressed,
being persons who are Eligible Counterparties or Professional Clients as described in “Code Monétaire et Financier” and Règlement
Général de l’Autorité des Marchés Financiers. It is not intended to be distributed or passed on, directly or indirectly, to any other class of
persons and may not be relied upon by such persons and is therefore not intended for private individuals or those who would be
classified as Retail Clients.
For institutional clients in the European Economic Area (EEA) outside of the United Kingdom:
This document (and any attachments or exhibits hereto) is intended only for EEA institutional clients or others to whom it may lawfully be
submitted.
Raymond James Euro Equities is a French Investment Services Provider authorized by the Autorité de contrôle prudentiel et de résolution
and regulated by the Autorité de contrôle prudentiel et de résolution and the Autorité des Marchés Financiers. For non-European
exchanges, Raymond James Euro Equities operates under the name Raymond James International.
For Canadian clients:
This report is not prepared subject to Canadian disclosure requirements, unless a Canadian analyst has contributed to the content of the
report. In the case where there is Canadian analyst contribution, the report meets all applicable IIROC disclosure requirements.
Proprietary Rights Notice: By accepting a copy of this report, you acknowledge and agree as follows:
This report is provided to clients of Raymond James only for your personal, noncommercial use. Except as expressly authorized by
Raymond James, you may not copy, reproduce, transmit, sell, display, distribute, publish, broadcast, circulate, modify, disseminate or
commercially exploit the information contained in this report, in printed, electronic or any other form, in any manner, without the prior
express written consent of Raymond James. You also agree not to use the information provided in this report for any unlawful purpose.
This is RJA client
releasable research
This report and its contents are the property of Raymond James and are protected by applicable copyright, trade secret or other
intellectual property laws (of the United States and other countries). United States law, 17 U.S.C. Sec.501 et seq, provides for civil and
criminal penalties for copyright infringement.
© 2015 Raymond James & Associates, Inc., member New York Stock Exchange/SIPC. All rights reserved.
International Headquarters: The Raymond James Financial Center | 880 Carillon Parkway | St. Petersburg, Florida 33716 | 800-248-8863
7


© Copyright 2026