
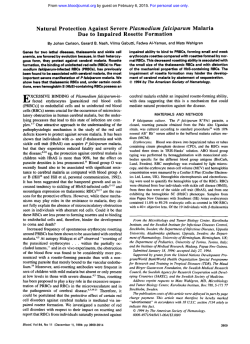
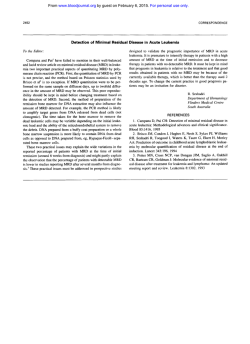
The Unique Red Cell Heterogeneity of SC Disease: Crystal
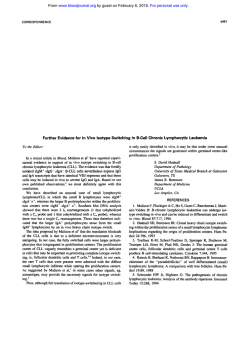
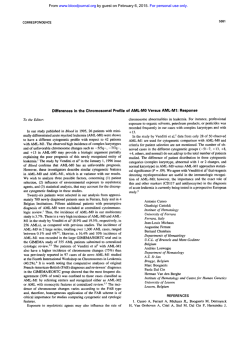
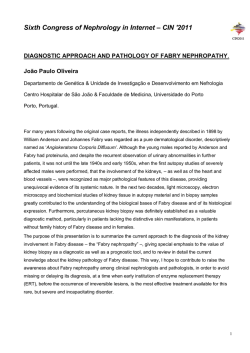
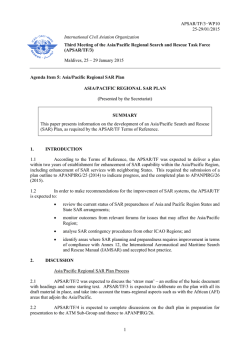
From www.bloodjournal.org by guest on February 6, 2015. For personal use only.
The Unique Red Cell Heterogeneity of SC Disease: Crystal Formation, Dense
Reticulocytes, and Unusual Morphology
By Christine Lawrence, Mary E. Fabry, and Ronald L. Nagel
Knowledge concerning SS (homozygous for the psgene) red
blood cell (RBC) heterogeneity has been useful for understanding the pathophysiology of sickle cell anemia. No
equivalent information exists for RBCs of the compound
heterozygotefor the psand pc genes (SC) RBCs. These RBCs
are known to be denser than most cells in normal blood and
even most cellsin SS blood (Fabryet al,JClinlnvesf70:1284,
1981). We have analyzed the characteristics of SC RBC
heterogeneity and find that: (1) SC cells exhibit unusual
morphologic features, particularly the tendency for membrane “folding“ (multifolded, unifolded, and triangular shapes
are all common); (2) SC RBCs containing crystals and some
containing round hemoglobin (Hb) aggregates (billiard-ball
cells) are detectable in circulating SC blood; (3) in contrast to
normal reticulocytes, which are found mainly in a lowdensity RBC fraction, SC reticulocytes are found in the
densest SC RBC fraction; and (4) both deoxygenation and
replacement of extracellular CI- by NO,- (both inhibitors of
K:CI cotransport)led to moderate depopulationof the dense
fraction and a dramatic shift of the reticulocytes to lower
density fractions. We conclude that the RBC heterogeneityof
SC disease is very different from that of SS disease. The
major contributions of properties introduced by HbC are
”folded” RBCs, intracellular crystal formation in circulating
SC cells, and apparently a very active K:CI cotransporter that
leads to unusually dense reticulocytes.
0 1991 by The American Society of Hematology.
S
SC disease, based on the assumption that HbC crystallization does not occur in SC cells, at least “in vivo.” Hence, the
syndrome has been thought to be dominated by the tendency of the SC cells to sickle.
However, evidence reported here shows that a subset of
circulating SC cells do have intracellular crystals. This
phenomenon can be observed particularly in SC patients
with a full complement of a genes and these cells are found
predominantly in the densest fraction of RBCs. In addition,
we find that SC reticulocytes, independent of a-thalassemia
status, are found predominantly among the densest RBCs
in SC blood, in contrast to the low density of reticulocytes in
AA and SS blood. High-density reticulocytes seem then to
be a feature characteristic of the cells containing p’,
because CC reticulocytes are also dense.5 Finally, SC RBCs
have a tendency to acquire a “folded” appearance, similar
to shape changes previously observed in CC disease.’
C DISEASE IS A chronic hemolytic disorder punctuated by acute painful crises and diverse chronic organ
damage, secondary to the presence of both hemoglobin
(Hb) S and HbC. CC disease is a mild chronic hemolytic
anemia in which red blood cells (RBCs) contain only HbC
(homozygous for the p” gene). Some of the factors affecting
the phenotype of patients with SC disease have been
identified during the last 10 years. CC and SC cells have a
higher mean corpuscular Hb concentration (MCHC), and
hence are denser than normal RBCs, and many of the
pathophysiologic features of SC disease can be corrected
when these cells are restored to a normal MCHC, a feature
with potential therapeutic implications.’,’The high MCHC
of SC cells resolves the paradox that SC cells are more
prone to sickling than AS cells, despite HbC enhancing the
polymerization of HbS “in vitro” only slightly?
The increase in MCHC contributed by the p“ phenotype
explains many effects attributable to increased polymer
formation,* with possible minor contributions from the
interactions between HbS and HbC? Some of the observations leading to these conclusions were confirmed by Bunn
et a1: who also pointed out that the higher percent of psin
SC (about 50% HbS) than in AS (40% HbS) also contributes to increased sickling in SC cells.
Little attention has been paid to the potential influence
of HbC or HbC crystal formation in the pathophysiology of
From the Division of Hematology, Department of Medicine, Albert
Einstein College of MedicinelMontefiore Medical Center, Bronx
Municipal Hospital Center, Bronx, NY
Submitted January 14, 1991; accepted June 6, 1991.
Supported by National Institutes of Health (NIH) Center Grant No.
HL38655 and NIHProgram Grant No. HL21016.
Presented in part as an abstract in Clin Res 3%6024, 1989.
Address reprint requests to Christine Lawrence, MD, Professor of
Medicine, Division of Hematology, Albert Einstein College of Medicine, 1300Mom‘sParkAve, Ullmann 921, Bronx, NY 10461.
The publication costs of this article were defrayed in part by page
charge payment. This article must therefore be hereby marked
“advertisement” in accordance with I8 U.S.C. section 1734 solely to
indicate this fact.
@ 1991 by The American Society of Hematology.
0006-4971/91/7808-0011$3.0010
2104
MATERIALS AND METHODS
Patient material and clinical laboratory studies. Patients were
examined in the Hematology Clinic of the Bronx Municipal
Hospital Center, as well as in the Heredity Clinic (Dr H.H. Billett,
Director) of the Bronx ComprehensiveSickle Cell Center. Diagnosis was based on two electrophoreses (cellulose acetate, borate
buffer, pH 8.6, and agar, citrate buffer, pH 6.4) and a solubility test.
Hematologic indices were determined with a Technicon H1 (Technicon, Tarrytown, NY) or a Coulter counter S+IV (Coulter,
Hialeah, FL). Reticulocyte determinations were performed by a
single observer who counted a minimum of 1,000 cells. Type 1
reticulocytes had abundant intracellular particles that tended to
aggregate in one sector of the cell as a pseudo-nucleus; type 2
reticulocytes had abundant stainable particles (typically 15 or
more) that were dispersed; type 3 had between 5 and 15; and type 4
had 5 or less particles. Type 1 and 2 are referred to as stress
reticulocytes.
To classify a cell as containing a crystal, the intracellular body
has to be very dense, have sharp, straight edges, and have partially
or completely depleted the cytosolic content (Hb in solution) of the
cell; this last feature was most apparent when a thin rim of RBC
membrane was observed encircling the crystal inclusion(s). In
“billiard-ball cells” the dense intracellular body was rounded,
without sharp edges, and eccentrically located; this left a portion of
the RBC in which the cytosol seemed devoid of Hb and the
membrane appears empty.
Blood, Vo178,No8(0ctober 15),1991:pp2104-2112
From www.bloodjournal.org by guest on February 6, 2015. For personal use only.
2105
UNIQUE RBC HETEROGENEITY IN SC DISEASE
RBC densify fictionation. The percent of dense cells was
determined from Percoll-Stractan continuous density gradients as
previously described." In these experiments we used Larex, a
purified form of Stractan, manufactured by Consulting Associates
(Tacoma, WA). All cell density separations were performed at
37°C except where noted. Separations performed at 4°C required
an extended period of centrifugation (2 hours) to attain the same
density profile. The SC4 fraction (MCHC > 42 g/dL, density > 1.103 g/mL) is the densest of four fractions (SCl to SC4)."
Gradients formulated with nitrate as the anion were made with
Larex subjected to an additional Amberlite MB-3 (Sigma, St Louis,
MO) extraction step as previously described' to remove residual
Cl-. The divisions were made at densities that are similar to, but
higher than those made for SS cells (Fig I), hence a different
nomenclature (SCl to SC4) is used. The densities in grams per
deciliter used to define SC fractions were: SCI, less than 1.081;
SC2, between 1.081 and 1.087; SC3, between 1.087 to 1.097; SC4,
greater than 1.097. The percent of irreversibly sickled cells (ISCs)
was determined by a single observer who counted 1,OOO RBCs.
HbF determination. The percent of HbF was measured by
alkaline denaturation."
DNA analysis. DNA was prepared from the subjects' white
blood cells (WBCs) by previously described techniques? Haplotype
analysis of the P-like globin gene cluster was performed in one
group of patients with the following restriction endonucleases:
Hindlll,Hincll, Hinfl, and Hpa 1. In another group, the haplotypes
were determined by polymerase chain reaction (PCR) amplification of the appropriate sequences that enables the detection of
polymorphic sites by simple digestion with either Hindlll, Hincll,
or Hinfl5' to the P gene site. The PCR detection of the site Hpa I
3' to f3 chain has proven to be unreliable, so this site has only been
defined by Southern blotting. Digestion of the PCR-amplified
segments yielded easily identifiable fragments detected by ethidium bromide.'" Some DNA was processed by both methods with
identical results. The a-globin gene haplotypes were determined as
previously reported?
Glucose-6-phosphate dehydrogenase (Gd-PD) determination.
Gd-PD was measured using a Sigma kit (345-UV) for kinetic
determination of enzyme activity at 340 nm. Complete lysis was
ensured by freezing in liquid nitrogen and thawing in water three
times. Samples were spun in a microfuge, to remove particulate
matter, before recording UV absorption: kinetics were measured
at 30°C and (3-6-PD activity was recorded as units per gram of Hb.
One unit is the amount of G-6-PD activity that will convert 1 kmol
of substrate per minute.
Fig 1. Percoll-Stractancontinuous density gradientseparation
of normal cells (far left) and of
the 10 SC patients discussed.
The five patients on the left have
a-thalassemia ( - a / m )and average fewer cells in the bottom of
the gradient (densest class of
cell, SC4). The patients' density
gradients are displayed in the
same order as Table 1. Density
class SC4d. presented in Table 1,
consists of the sum of the two
densest divisions (marked 4d).
whereas SC4 consists of the sum
of the three and one-half densest
divisions.
REF A
Scanning electron microscop. Cells were washed in phosphatebuffered isotonic saline, pH 7.4, and fixed in 10% buffered
formaldehyde or, on some occasions. 2% glutaraldehyde. Fixed
cells were allowed to adhere to polylysine-coatedglass coverslips,
rinsed briefly in distilled H,O, followed by dehydration in a graded
ethanol series. Specimens were dried in CO, in a Tousimis 790
(Tousimis Research Corp, Lockville, MD) critical point drier, then
sputter-coated with goldlpalladium in a Denton Desk-1 sputter
coater. Specimenswere observed in a JEOL 25SM or a JEOL 6400
scanning electron microscope at an acceleratingvoltage of 14 kV.
Ligand-stateeffect on RBC density. To study the potential effect
of ligand on the density distribution of SC RBC and reticulocytes,
the following experiment was performed. Cells suspended in
plasma were first partially deoxygenated by alternate exposure to
N, and vacuum in a serum cap-sealed tube. They were then
transferred to an N,-filled glove bag and the suspension was
layered on top of 5.9 mL of Percoll-Larexgradient mix, to which 20
kL of a 1 mol/L solution of dithionite in saline had been added.
The tubes were stirred and the sample was allowed to equilibrate
for 30 minutes at room temperature, after which the tubes were
centrifuged as described in the section for density fractionation.
Samples for scanningmicroscopywere obtained from the dithionitetreated gradients by removing them with a syringe previously
washed in dithionite solution. Before fixing in 10% buffered
formaldehyde, the cells were washed in saline containing 20 WLof 1
mol/L dithionite per 10 mL. SC and AA whole blood equilibrated
with CO and incubated with the same concentration of dithionite
for 30 minutes were used as controls for these experiments. For
reticulocyte preparations, the dithionite was washed out with two
1:20 washes with deoxygenated saline, and the cells were resuspended in plasma before incubation with supravital dye.
Effect of deoxygenation on intracellularcrystals. There were too
few naturally occurring SC crystals to allow reliable determination
of changes in the percent of crystal-containingcells after deoxygenation; therefore, 5% NaCl was added to SC whole blood to reach a
final osmolarity of 820 mOsm/Kg H?O.After 4 hours, sharp-edged,
distinct HbC-like crystals were well formed. These cells were then
deoxygenated either by alternate vacuum and N, with hand
agitation or in a tonometer with intermittent mixing (Instrumentation Laboratories, Lexington, MA). The percent of oxygen saturation was determined by Cooximeterreadingsof aliquots (Instrumentation Laboratories). In both cases, less than 10%oxygen saturation
was reached in about 15 minutes and the cells were then maintained deoxygenated for another 20 minutes. Aliquots were examined at 15-minute intervals and crystals were counted in wet
A
I
II
aa/aa
aa/-a
I
I
sc
I
From www.bloodjournal.org by guest on February 6, 2015. For personal use only.
2106
LAWRENCE, FABRY, AND NAGEL
preparations and in reticulocyte-stained smears. These experiments were designed to show if crystals in SC RBCs melt when
deoxygenated.
Effectof isotonic NO,- on SC cell densiy. To estimate the effect
of KCI cotransport on the density distribution of SC whole blood
and individual elements such as reticulocytes, SC whole blood was
incubated in isotonic (280 mOsm) media in which C1- had been
replaced with NO,- [the medium contained 10 mmol/L glucose, 0.5
g% bovine serum albumin [BSA], 5 mmol/L PO, buffer at pH 7.4,
and 140 mmol/L NaNO, with 4 mmol/L KNO, and Mg(NO,),] for
30 minutes at 38°C. Because K:Cl cotransport is chloride dependent, any role that it might have is negated in the absence of C1-. At
the end of 30 minutes the cells were washed with fresh isotonic
nitrate media and then reconcentrated. The cells were then
separated by density gradient centrifugation by mixing 0.5 mL of
packed cells with 5.5 mL of isotonic Percoll-Larex mixture containing NO,- as the anion. The gradient was then fractionated into
density classes SC1 to SC4 using the same depth in the tube as was
used for chloride-containing gradients to separate the fractions. An
aliquot from each fraction was taken for a reticulocyte count and
was washed three times in isotonic saline and then resuspended in
autologous plasma. The percent of cells in fractions (SC1 to SC4)
was determined in two different ways. Grams of Hb in each fraction
were measured by diluting the cells in each fraction to a known
volume and determining the Hb concentration of an aliquot;
alternatively, the density gradients were photographed and read by
a densitometer as previously described6with the exception that the
depth in the tube was adjusted to conform to the separation used
for SC blood. When these two methods were compared, we found a
ratio of 1.17 f 0.14 (mean f SD) between grams per deciliter Hb
per fraction and the densitometrically determined percent of cells
in each fraction. Therefore, we used the densitometrically determined percent of cells in each fraction to calculate the absolute
percent of reticulocytes in each fraction.
Statistics. The statistics program Statgraphics 4.0 (STSC-PlusWare, Rockville, MD) was used on an IBM-AT (International
Business Machine, NY) for plotting and for the two-sample t-test.
RESULTS
Table 1 summarizes pertinent findings in the 10 patients
included in this report. The most striking finding was the
presence of large visible intra-erythrocytic crystals in circulating RBCs of all SC patients with a normal complement of
a-genes. Crystals in circulating RBCs (taken directly from
finger-stick samples) could be seen not only in Wright and
supravital stained smears, but also in “wet” preparations in
which the finger-stick sample was collected directly into
saline with 10% buffered formaldehyde (Fig 2A, B, and C).
Blood from three of the five SC patients with a-thalassemia
who had the lowest mean corpuscular volumes (MCVs) did
not exhibit intra-erythrocytic crystals. Regardless of a-gene
status, there were RBCs in all patients that contained a
single, eccentrically located, heavily stained globular (round)
mass of Hb that we refer to as “billiard-ball cells” (Fig 3).
These cells are different from spherocytes in that the
globular mass depletes the adjacent Hb and separates from
the membrane, which then appears empty. These cells were
seen on the blood smears of all SC patients and, when
density gradient fractions were examined, they were found
predominantly among the denser cells (SC4) (Table 1). In
Table 1, we compare the percent billiard-ball cell count of
SC4 with that of SC2 (the most abundant density fraction in
SC blood).
By scanning electron microscopy, SC patients, regardless
of a-genes status, have striking, abnormally shaped cells
(Fig 4). “Multi-folded cells” were common (Fig 4A), some
of them having only a single fold and resembling pita bread
(Fig 4B). These are probably the cells that Krauss and
Diggs” called “fat cells,” because in the Wright-stained
smear they appear as wide bipointed cells and the folding is
difficult to appreciate. Cells with triconcave shapes, ie,
Table 1. Hematologic and Related Parameters in Ten Patients With SC Genotype
Patients
Sex
p-gene haplotype
Hb (g/dL)
Hct (%)
MCV (fL)
RDW
WB
Retics (YO)
SCl*
Retics (YO)
SC2
Retics (YO)
SC3
Retics (YO)
SC4
Retics (YO)
HbF (Yo)
a-gene status
Dense cells (%) (SC4)t
(SC4d)
Densest cells (YO)
ISC (%) WE
Crystals (%)
Billiard-ball cells (YO)
(SC2)
Billiard-ball cells (%) (SC4)
G-6-PD (U/g Hb)
CE
F
BEN/C
10.7
29.9
62
18.0
5.5
0.2
1.3
7.7
23.7
1.7
3a
5.7
2.9
0.6
0
1
10
13.75
PK
F
BAN/C
11.1
30.0
70
15.6
4.6
3.8
3.0
6.2
6.8
4.4
3a
14.3
1.1
0.5
0
1
5
7.42
ss
F
BEN/C
10.2
27.8
71
16.6
10.5
4.4
8.8
14.7
10.5
2.2
3a
15.7
2.8
0.2
0
1
10
14.85
RJ
M
BAN/C
13.5
38.9
76
18.4
7.4
0.6
1.3
8.3
18.1
0.9
3a
18.3
4.1
1.2
0.8
0
4
13.60
YH
F
SEN/C
10.1
32.9
82
16.0
9.0
2.2
4.9
11.7
14.1
4.8
3a
25.1
4.5
1.2
1.2
1
2
12.96
_.
GB
F
BAN/C
11.7
32.2
75
16.0
7.5
0.8
3.2
15.3
9.2
1.3
4a
14.5
3.4
1.1
0.8
2
9
15.34
NA
F
BEN/C
11.8
30.6
82
14.1
10.0
5.3
11.2
18.3
11.5
1.8
4a
20.5
2.8
0.5
1.2
0
4
5.04
RT
M
BEN/C
13.4
39.9
88
18.6
7.1
0.2
3.5
9.5
17.6
0.8
4a
30.5
4.3
1.5
0.1
1
6
3.38
VR
F
BEN/C
10.6
31.4
90
18.0
8.5
1.9
4.7
13.5
16.7
2.4
4a
17.1
2.3
1.o
0.15
0
10
19.63
SP
F
BEN/C
11.1
32.9
95
14.2
6.9
1.8
4.4
16.6
23.4
1.3
4a
14.1
4.0
1.E
0.06
0
6
11.50
~~
Abbreviations: WB, whole blood; BEN, Benin; BAN, Bantu; SEN, Senegal; C, typical HbC associated haplotype.
*SCl-SC4, density gradient fractions; underlined numbers are the highest percentage of reticulocytes in each density separation.
tBoth percent SC4 and percent SC4d are average valuesfor several determinations. SC4d consists of the two densest divisions as shown in Flg 1.
From www.bloodjournal.org by guest on February 6, 2015. For personal use only.
UNIQUE RBC HETEROGENEITY IN SC DISEASE
2107
A
cells, and was particularly notable for the presence of
invaginations (Fig 5 ) ; however, cells in SC3 were also
irregular in shape.
3. Crystal-containing cells and billiard-ball cells were
found predominantly in SC3 and SC4 in SC patients with
the normal complement of a-genes and in two of the five
a-thalassemics with the largest MCVs (Fig 6 ) , although any
inference must be tentative due to the small number of
cases. These crystals were best seen and most easily
counted in supravital-stained preparations because most of
the crystals remained bright red, ie, unstained, in contrast
with the bluish color of the cytosol Hb in the rest of the
cells. In contrast, billiard-ball cells were found in all 10 SC
patients, regardless of their a-thalassemia status (Fig 3,
Table 1). It is worth noting that the ISCs commonly found
in the densest fraction in SS blood were uncommon in SC
blood samples, even in the SC4 fraction (Table 1).
4. When the separation was conducted at 37T, the
highest absolute reticulocyte count (Fig 7) (absolute reticulocytes are the percent reticulocytes tines the percent cells
in a fraction) was found in SC3 and SC4, which corresponds
to densities greater than 1.0879 g/dL, although the highest
percent of stress reticulocytes (as defined in Materials and
Methods) was found in fraction SCl (Fig 8). Under the
same conditions, CC cells also exhibited increased reticulocyte counts in the densest fraction.' These findings contrast
Fig 2. Crystalcantaining RBCs in circulating blood of SC patients.
Blood obtained by finger-stick. Note crystals indicatedby arrows. (A)
10% buffered formaldehyde fixed wet preparation;(6)Wright-stained
smear; (C) supravital-stainedsmear. Note the cell membrane sunounding the Hb-depleted cytosol in the crystal-containing RBCs (arrows).
(Originalmagnification x 1.000.)
triangular cells with three dimples, were similar to those
seen in acute alcohol intoxication that Bessis'* named
"knizocytes" (Fig 4C).
The density separation of SC cells (Fig 1) showed several
features:
1.
Previously reported, most of the RBCS in sc
individuals were denser than AA cells, with the majority of
cells exhibiting a density intermediate between AA and C c
cells.*
was their
2*The denser the sc cells, the more
shape. Fraction SC4 contained the most abnormally shaped
sa
Fig 3. Billlard-ball cells in
fraction isoiatd from PemollStractan density gradient from patient CE (-dad.
(A) Supravital
Stain; (B) Wright-stained smear. The dense, eccentrically located Hb
aggregateappears to contain most of the Hb in the cell; a piece of the
membrane surrounds a portion of the cytosol devoid of Hb. Note that
some of these "billiard-balls cells" are reticulocytes. (Original magnification xi,ooo.)
From www.bloodjournal.org by guest on February 6, 2015. For personal use only.
2108
Fig 4. Scanning electron microscopy of individual SC cells. Electron micrographs illustrate: (A) mukifolded SC cells (original magnification ~ 6 , 5 0 0 )(B)
; unifolded SC cells resembling pita bread, most
likely the same cell described as "fat cell" in Wright-stainedsmears by
Krauss and Diggs"; (C) tridimpled SC cell, also called triangular cells
and knizocytes by others. (Originalmagnification x 10,000.)
strikingly with the usual distribution of reticulocytes in
normal blood at 37°C in hemolytic anemias in AA and SS
individuals and thalassemics. In most SS patients, 90% of
all reticulocytes are found in SSl and SS2 at densities less
than 1.091." In all of these cases, reticulocytes are among
the lightest cells in the blood. However, if the separation of
SC RBCs is conducted at 4"C, the majority of reticulocytes
are found in SCl and SC2.
5. There was a ligand-dependent reduction of aggregated
forms. We found that deoxygenation, both by hand with
LAWRENCE, FABRY, AND NAGEL
alternating vacuum and N,, and by tonometer, resulted in
the disappearance of more than 80% of the crystals at the
end of 30 minutes, and 95% to 100% of the crystals at the
end of 45 minutes.
6. There was a ligand-dependent redistribution of RBCs
and reticulocytes. In contrast to the effects seen in SS
individuals," the density distribution of SC RBCs on
deoxygenated density gradients showed a small reduction
of cells in the densest fractions (SC3 and SC4). When cells
were separated into four fractions and the percent of
reticulocytes in each fraction was determined, we found
that reticulocytes had migrated from the densest fractions
(SC3 and SC4) to the less dense fractions (SCl and SC2)
(Fig 9).
7. The replacement of chloride with nitrate had an effect
on the distribution of RBCs and reticulocytes. Incubation
of SC whole blood in isotonic nitrate medium effected only
a small shift in density distribution, with some cells moving
from the two densest fractions, SC3 and SC4, into the two
lighter fractions, SCl and SC2. However, a much more
striking shift in the density distribution of reticulocytes
occurred. Dramatic effects were seen on the absolute
reticulocyte distribution shifted from a maximum in SC3
and SC4 to a maximum in SC2 in the five patients studied by
this approach (Fig IO).
8. G-6-PD determination in the oxygenated SC fractions
(room temperature) showed that the activity was similar in
all of the density fractions (data not shown). This result is in
contrast to AA and SS blood, in which the enzyme activity
decreases pari-passu with the increasing density of the
fraction, presumably due to the presence of older cells in
higher density fractions. These results in SC blood must be
interpreted in conjunction with the abnormal density distribution of reticulocytes and the progressively more abnormal shapes observed on scanning electron microscopy
(EM). The low G-6-PD activity of the presumably older
cells found in SC3 and SC4 (based on their abnormal
shapes) is compensated for by the increase in the number of
reticulocytes in those denser fractions, resulting in a flat
distribution of G-6-PD at all cell densities.
Finally, p-gene cluster haplotypes were determined in all
patients as a matter of record. Because of the small size of
the sample, it is impossible to draw any conclusions from
the data.
DISCUSSION
The data presented here show that circulating RBCs of
patients with SC disease do contain crystals. The presence
of circulating crystals in SC disease needs to be compared
with this tendency in CC and AC genotypes. While all CC
individuals form tetragonal CC crystals "in vitro" after
dehydration or exposure to hypertonic medium," circulating HbC crystals are observed predominantly in splenectomized CC individuals. SC patients have a greatly reduced
splenic function by the time they reach adulthood, although
they retain a palpable spleen longer than SS individ~als.'~
In AC subjects, crystals are not observed either "in vivo" or
"in vitro"."
The formation of morphologically identifiable crystals
From www.bloodjournal.org by guest on February 6, 2015. For personal use only.
2109
UNIQUE RBC HETEROGENEITYIN SC DISEASE
SC DENSITY FRACTIONATION (3K mag)
sc 1
sc 2
Fig 5. Scanning electron microscopy of the four
density fractions found in SC blood. Note that as the
cells become more dense, they became progressively
more abnormal. These cells have unusually deep
invaginations that are consistent with dehydration.
sc 3
sc 4
appears to be only the tip of the iceberg in terms of Hb
aggregation (which is different than HbS polymerization)in
SC cells. RBCs with “marginated” Hb, but not sharp
crystal-like edges, were commonly observed in Wrightstained smears, “wet” preparations, and supravital-stained
reticulocyte smears in these patients. These “marginated,”
globular dense bodies incorporated most of the RBC Hb
(billiard-ball cells) and were observed in the densest gradient fraction of all SC patients (Fig 3, Table 1).
Striking morphologic differences, in addition to the
crystal-containing cells, are another feature of the blood of
SC patients. Scanning electron microscopy shows unusual
shapes of SC cells in the different density fractions. Fraction SCl exhibits flattened RBCs and occasional “folded
cells.” These characteristics are more prominent in SC2
and SC3. In this latter fraction, triple-folded cells are quite
common. Of note is that these “folded” cells are reminiscent of RBC abnormalities found in HbC homozygotes.’
Finally, in SC4, grossly pitted cells, bizarre folded cells, and
cells that appear to have intracellular “crystals” are apparent. The presence of true crystals is confirmed by “wet”
preparations and supravital-stained smears under light
microscopy (Figs 2 and 6). These crystals rapidly disappear
under fully deoxygenated conditions, which is similar to the
IF
d
Fig6. Crystalcontaining cells
Insupravital-stained preparation.
B
Crystals Isolated from SC4 fraction and stained with new methylene blue, which stains the cytosol Hb blue but is excluded from
the red crystals. Crystals are indicated by arrows.
From www.bloodjournal.org by guest on February 6, 2015. For personal use only.
2110
LAWRENCE, FABRY, AND NAGEL
.."
A n
T
sc 1
sc3
sc2
I
m
5.0
~
sc 1
sc4
Fig 7. Absolute reticulocytes in the four SC density fractions. The
absolute value was obtained by multiplying the percent of reticulocytes by the percent of cells found in that density fraction. The points
are the average values for the 10 patients studied plus or minus the
standard error.
behavior of crystals formed in vivo in CC individual^.'^ This
finding suggests that crystals are formed from the oxygenated form of Hb.
Another unique feature of SC disease is the presence of
dense reticulocytes. When the density separation is performed at 37T, the highest percent of reticulocytes is found
in the SC4 fraction, while the highest absolute number is
found in fractions SC3 and SC4. However, if the separation
is performed at 4"C, SC reticulocytes are found in the top
two fractions. Low temperature inhibits KCl cotransport"
and many other RBC processes. The high density of SC
reticulocytes observed at the physiologic temperature of
37°C more accurately reflects the in vivo density distribution. At 37"C, 90% of SC reticulocytes are found at
densities in excess of 1.087 g/dL. In contrast, 90% of SS
reticulocytes are found at densities less than 1.091g/dL.
Stress reticulocytes, the youngest forms, are present in
the highest percent in SC1. The finding of most of the SC
reticulocytes in dense fractions is surprising, because in AA
and SS individuals, reticulocytes of all ages are predominantly low-density cells at 37°C. One explanation for this
A
sc2
sc3
sc4
Fig 9. Absolute reticulocytes in SC patients after deoxygenation
and separation on a deoxygenated density gradient. (0.W, A) Cells
an average value of five patients
from three individual patients; (0)
studied on oxygenated chloride Percoll-Stractan gradients.
result is that reticulocytes in SC disease exit the marrow as
low-density cells and become dense within 24 hours, sinking
to the denser fractions. The G-6-PD data show that either
SC cells do not exhibit the characteristic reduction of
enzyme level usually associated with aged high-density
RBCs or that the high-density cells are a mixture of old and
young cells.
Why are SC reticulocytes so dense? Brugnara et al'*.''
were the first to detect a volume-stimulated K+ efflux in CC
and SS cells. Canessa et almI2'were the first to establish that
this transport system was C1-dependent and stimulated by
N-ethyl maleimide (NEM) in CC and SS cells. These
findings showed that the volume-stimulated K+ efflux reported by Brugnara et a1'8.1ywas, in fact, the KCl transport
system previously discovered by Ellory and Dunham" in
sheep RBCs. Hall and E l l ~ r y ?Canessa
~
et al,7324325
and
Brugnara et a126327further showed independently that this
transporter was predominantly present in young RBCs
(including HbA reticulocytes), explaining its elevated activity in SS blood.
These previously reported experiments do not settle the
origin of the increased density of CC cells nor can they, by
themselves, explain the increased density of SC reticulo-
90
3
v)
w
E3
3+
x
70
0
0
3
60
.-0
A+
a,
50
40
!z
W
U
v)
a:
m
80
30
20
10
0
CK
j ; ;=
W
A+
-30
m
.I,
a
sc1
2
SC2
SC3
A ~ A
aAA
SC4
Y
a
Whole
Blood
Fig 8. Stress reticulocytes as percent of all reticulocytes in the four
SC density-defined fractions (SC1-4) and in whole blood. ( 0 )Patients
with four a-genes; (A)patients with one a-gene deletion (-a/aa).
sc 1
sc2
sc3
sc4
Fig 10. Absolute reticulocytes in five SC patients after incubation
in isotonic nitrate and separation on a nitrate containing PercollStractan gradient. (0)Average values of five experiments in nitrate
average values for five experiments performed under the
media; (0)
same conditions in chloride-containing gradients. Error bars represent standard error.
From www.bloodjournal.org by guest on February 6, 2015. For personal use only.
2111
UNIQUE RBC HETEROGENEITY IN SC DISEASE
cytes. Nevertheless, the data in Fig 10 provide a partial
explanation for the phenomena. The density distribution of
SC reticulocytes, but not mature cells, shifts when C1- is
removed from the media and replaced by NO,-, the percent
of dense cells is reduced, and the reticulocytes move to less
dense fractions. Because KCI cotransport is abolished
under these circumstances, we conclude that SC reticulocytes are endowed with a highly active K C l cotransport
system (even at isotonic conditions) that decreases RBC
volume when the K’ and C1- efflux are not compensated
with Na’ influx or Na’/H’ exchange. K C l cotransport and
Na’/H’ antiport activity in CC cells have been measured by
Fabry et al’ and will be reported in full elsewhere, including
similar data for SC cells.
This finding should not be confused with the early
observation of Bertles and Milnera (recently confirmed by
Bookchin et al)29 that SS dense cells mostly originate
directly from the lightest density fraction. In the case of SS,
the densest cell fraction does not contain a significant
number of reticulocytes, although the cells are younger
than less dense fractions. The unusual finding in SC blood is
that most mature reticulocytes are observed in the densest
fraction.
What are the implications of these findings vis-a-vis the
pathophysiology of SC disease? We need to understand
why SC patients exhibit circulating RBCs containing crystals. There are three factors to consider, which are not
mutually exclusive: (1) the spleen fails to eliminate crystal
or aggregate containing RBCs due to infarction and/or
functional asplenia (secondary to blockade of reticuloendothelial cells); (2) HbS accelerates the crystallization of HbC
in vitro,” and it is reasonable to infer that this phenomena
might occur also “in vivo”; and (3) although the percentage
of HbC is only about 50% in SC patients, this Hb is at a
higher intra-erythrocytic concentration than in HbC trait
RBCs (which also contain 50% HbC). This increased
density (MCHC) in SC RBCs is the result of a more active
KCI cotransport system in the young RBCs.
Why are crystal-containing SC cells particularly prominent in the densest fraction? There are two possible
explanations: (1) the presence of crystals increases the
density of these cells (the concentration of Hb crystals is
about 68 g/dL) and/or (2) the SC cells that are, for
whatever reason, destined to become densest are also likely
to produce crystals as a byproduct of the progressive
increase in MCHC. This phenomenon is, of course, reminiscent of CC disease,’ in which crystals are found in the
highest density fraction.
Does the presence of SC cells containing crystals and
aggregated Hb contribute to the vaso-occlusiveevents in SC
disease? The answer is most probably no. Based on the data
presented here, and knowledge acquired in the study of CC
di~ease,”.~’
some predictions can be made as to the pathophysiologic role of SC RBCs containing Hb aggregates and
crystals in vaso-occlusion. As in CC, we have shown that SC
crystals melt on deoxygenation, presumably because their
crystal structure is based on Hb in the oxygenated conformation, which then changes when oxygen is removed.’’ Hence,
the previous analysis developed for CC disease is also
applicable to SC disease. After initial vaso-occlusion, low
pH and progressive deoxygenation follow, leading to melting of the crystals and increased deformability. In contrast,
SS cells become even more rigid under these conditions. In
addition, the lower MCV of SC cells affords partial protection from obstruction?’ These characteristics of SC cells
might contribute to the lower incidence of painful crises in
SC disease when compared with sickle cell disease.
In summary, the findings reported here are the following:
(1) in addition to the already reported higher than normal
MCHC of SC cells,’ the percent of the very dense cells
seems to depend in part on the a-thalassemia status,
although this fact needs to be confirmed in a larger sample;
(2) crystal-containing cells circulate and are observed in the
densest fractions; (3) deoxygenation melts intracellular
crystals and decreases the MCHC of some of the very dense
SC cells (SC3 and SC4), suggesting that other forms of Hb
aggregation, besides the morphologicallyrecognizable HbClike tetragonal crystal, occur in these cells and are liganddependent; (4) the majority of SC reticulocytes are of high
density, although they might not have entered the circulation in that state. Deoxygenation or removing C1- from the
extracellular media dramatically shifts these reticulocytes
to lower densities. A highly active K C l co-transport in SC
reticulocytes is probably the basis for this phenomenon; and
(5) multi-, tri-, or unifolded RBCs are a morphologic
feature of SC disease, similar to those of CC disease.’
We conclude that RBC heterogeneity in SC disease is
under a different pathophysiologic control than in SS
disease, due to the effects of the presence of HbC, including
HbC-driven crystal formation in some of the dense SC cells,
high-density reticulocytes, and a tendency to form “folded”
RBCs.
ACKNOWLEDGMENT
We are deeply indebted to Sandra Suzuka and Rose Grossman
for their excellent technical assistance. In addition, we acknowledge the contribution of Dr Soili Erlingson for p and a cluster
haplotype determinations in these patients. We thank the Analytical Ultrastructural Center at the Albert Einstein College of
Medicine and Jane Fant and Lynn Dean for their excellent help
with the scanning electron microscopy.
REFERENCES
1. Fabry ME, Kaul D, Raventos C, Baez S, Rieder R, Nagel R L
polymer solubilities of deoxyhemoglobins S + C and S + A
Some aspects of the pathophysiology of homozygous hemoglobin
mixtures. Blood 673387,1986
CC red cells. J Clin Invest 671284, 1981
4. Bunn HF, Noguchi (JT, Hofrichter J, SchechterGP, Schechter
2. Fabry ME, Kaul DK, Raventos-Suarez C, Chang H, Nagel
AN, Eaton W A Molecular and cellular pathogenesis of hemogloRL: SC red cells have an abnormally high intracellular hemoglobin
bin SC disease. Proc Natl Acad Sci USA 79:7527,1982
concentration: Pathophysiological consequences. J Clin Invest
5. Fabry ME, Canessa M, Romero J, Lawrence C, Nagel R L
70:1315,1982
The unique density distribution of reticulocytes and ion transport
3. Bookchin RM, Balazs T: Ionic strength dependence of the
properties in HbC red cells. Blood 74:983a, 1989 (abstr, suppl 1)
From www.bloodjournal.org by guest on February 6, 2015. For personal use only.
2112
6. Fabry ME, Mears JG, Patel P, Schaefer-Rego K, Carmichael
D, Martinez G, Nagel R L Dense cells in sickle cell anemia: The
effects of gene interaction. Blood 64:1042,1984
7. Canessa M, Fabry ME, Blumenfeld N, Nagel R L A volumestimulated, CI- dependent K+ efflux is highly expressed in young
human red cells containing normal hemoglobin or HbS. J Membr
Biol97:97, 1987
8. Pembrey ME, McWade P, Weatherall J: Reliable routine
estimation of small amounts of foetal haemoglobin by alkali
denaturation. J Clin Pathol25:738,1971
9. Nagel RL, Rao SK, Dunda-Belkhodja 0, Connolly MM,
Fabry ME, Georges A, Krishnamoorthy R, Labie D: The hematological characteristics of sickle cell anemia bearing the Bantu
haplotype: The relationship between G~ and HbF level. Blood
69:1026, 1987
10. Sutton M, Bouhassira EE, Nagel R L Polymerase chain
reaction amplification applied to the determination of p-gene
cluster haplotypes. Am J Hematol3266,1989
11. Krauss AP, D i g s LW: In vitro crystallization of hemoglobin
occurring in citrated blood from patients with hemoglobin C. J Lab
Clin Med 47:700,1956
12. Bessis M: Red cell shapes: An illustrated classification and
its rationale, in Bessis M, Weed RI, Leblond PF (eds): Red Cell
Shape. New York, NY,Springer-Verlag, 1973
13. Kaul DK, Fabry ME, Windisch P, Baez S, Nagel R L Red
cells in sickle cell anemia are heterogeneous in their rheological
and hemodynamic characteristics. J Clin Invest 72:22,1983
14. Fabry ME, Nagel R L The effects of deoxygenation on red
cell density: Significance for the pathophysiology of sickle cell
anemia. Blood 601370,1982
15. Hirsch RE, Raventos-Suarez C, Olson JA, Nagel R L
Ligand state of intraerythrocytic circulating HbC crystals in homozygote CC patients. Blood 66:775,1985
16. Serjeant GR: Sickle Cell Disease. New York, NY, Oxford,
1985
17. Canessa M: Personal communication, July 1990
18. Brugnara C, Kopin AS, Bunn HF, Tosteson DC: Regulation
of cation content and cell volume in patients with homozygous
hemoglobin C disease. J Clin Invest 75:1608,1985
19. Brugnara C, Bunn HF, Tosteson D C Regulation of erythrocyte cation and water content in sickle cell anemia. Science
232:388,1986
LAWRENCE, FABRY, AND NAGEL
20. Canessa M, Spalvins A, Nagel R L Volume-dependent and
NEM stimulated K+:CI- transport is elevated in SS, SC and CC
human red cells. Red Cell Club, Yale University, Nov, 1985.
Biophys 549580,1986 (abstr)
21. Canessa M, Spalvins A, Nagel R L Volume-dependent and
NEM-stimulated K+:CI- transport is elevated in oxygenated SS, SC
and CC human red cells. FEBS Lett 200197,1986
22. Ellory JC, Dunham PB: Volume-dependent passive potassium transport in LK sheep red cells, in Lassen UV, Ussing HH,
Wieth JO (eds): Membrane Transport in Erythrocytes. Alfred
Benzon Symposium 14. Copenhagen, Denmark, Munksgaard,
1980, p 409
23. Hall AC, Ellory JC: Evidence for the presence of volumesensitive KC1 transport in 'young' human red cells. Biochim
Biophys Acta 858:317,1986
24. Canessa M, Fabry ME, Blumenfeld N, Spalvins A, Nagel
R L A volume-dependent K+:CI- transporter is highly expressed in
young human red cells with AA and SS hemoglobin: Physiological
and pathophysiological implications. J Gen Physiol 88:14, 1986
(abstr)
25. Canessa M, Fabry ME, Spalvins A, Blumenfeld N, Nagel
R L Activation of a KC1 transporter by cell swelling in Hb SS red
cells, in Nagel RL (ed): Progress in Clinical and Biological
Research: Pathophysiological Aspects of Sickle Cell Vasoocclusion
(~01240).New York, NY,Liss, 1987, p 201
26. Brugnara C, Tosteson D C Cell volume, K' transport and
cell density in human erythrocytes. J Gen Physiol88:14a, 1986
27. Brugnara C, Tosteson DC: Cell volume, K' transport and
cell density. Am J Physiol21:C269,1987
28. Bertles JF, Milner P F A Irreversibly sickled erythrocytes: A
consequence of the heterogeneous distribution of hemoglobin
types in sickle cell anemia. J Clin Invest 47:1731,1968
29. Bookchin RM, Ortiz OE, Lew V L Evidence for a direct
reticulocyte origin of dense cells in sickle cell anemia. J Clin Invest
87:113, 1991
30. Kaul DK, Baez S, Nagel R L Flow properties of oxygenated
HbS and HbC erythrocytes in the isolated microvasculature of the
rat. A contribution to the hemorheology of hemoglobinopathies.
Clin Hemorheol1:73,1981
From www.bloodjournal.org by guest on February 6, 2015. For personal use only.
1991 78: 2104-2112
The unique red cell heterogeneity of SC disease: crystal formation,
dense reticulocytes, and unusual morphology
C Lawrence, ME Fabry and RL Nagel
Updated information and services can be found at:
http://www.bloodjournal.org/content/78/8/2104.full.html
Articles on similar topics can be found in the following Blood collections
Information about reproducing this article in parts or in its entirety may be found online at:
http://www.bloodjournal.org/site/misc/rights.xhtml#repub_requests
Information about ordering reprints may be found online at:
http://www.bloodjournal.org/site/misc/rights.xhtml#reprints
Information about subscriptions and ASH membership may be found online at:
http://www.bloodjournal.org/site/subscriptions/index.xhtml
Blood (print ISSN 0006-4971, online ISSN 1528-0020), is published weekly by the American
Society of Hematology, 2021 L St, NW, Suite 900, Washington DC 20036.
Copyright 2011 by The American Society of Hematology; all rights reserved.


© Copyright 2026