
Supporting Information Nonmetal P
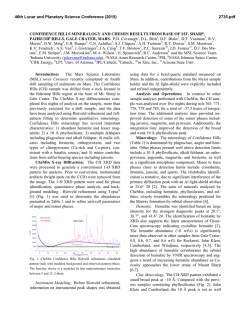
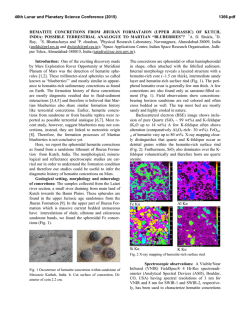
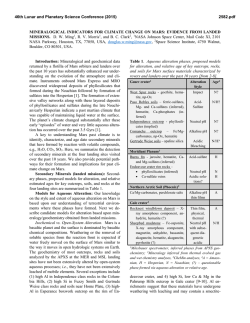
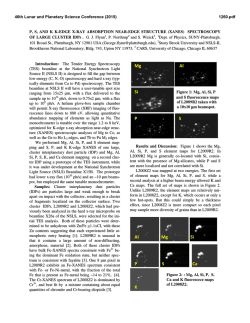
Electronic Supplementary Material (ESI) for Energy & Environmental Science. This journal is © The Royal Society of Chemistry 2015 Supporting Information Nonmetal P-doped Hematite Photoanode with Enhanced Electron Mobility and High Water Oxidation Activity Yuchao Zhang, a Shiqi Jiang, b Wenjing song, a Peng Zhou, a Hongwei Ji, a Wanhong Ma, a Weichang Hao, b Chuncheng Chen,* a Jincai Zhao a a Key Laboratory of Photochemistry, Beijing National Laboratory for Molecular Sciences, Institute of Chemistry, Chinese Academy of Sciences, Beijing 100190, China b Center of Materials Physics and Chemistry, Beihang University, Beijing 100191, China EXPERIMENTAL SECTION Photoanode preparation. Hematite nanowires were prepared on a fluorine-doped tin oxide (FTO, TCO-15, Nippon Sheet Glass, Japan, 14 ohm/sq) glass substrate by a modified procedure reported by Yat Li and coworkers.1 Briefly, 100 ml aqueous solution containing 2.43 g of ferric chloride (FeCl3.6H2O, Alfa Aesar, 98%) and 0.85 g of sodium nitrate (NaNO3, J&K, 99%) at pH = 1.4 (adjusted by HCl) were prepared in a Teflon-lined stainless steel autoclave. Several FTO glass slides (2 4 cm), washed with acetone, ethanol, and then deionized water, were placed in the autoclave and heated at 95 °C for 4 hours. After the hydrothermal treatment, a uniform layer of iron oxyhydroxides (FeOOH) was coated on the FTO glass, which was washed completely with deionized water to remove any residual salts. The obtained film was sintered in air at 550°C for 2 hours to convert the FeOOH nanowires into hematite nanowires. The hematite nanowires were further annealed at 650°C for 20 min, or at 750°C for 15 min. P-doped hematite nanowires were prepared by the same procedure as hematite nanowires, except that FeOOH films were soaked in 0.05M of Na2HPO4 solution with different pH for 1min and then immediately underwent the sintering and annealing procedure without other modifications. The pH of the soaking solution was adjusted by HCl and NaOH solutions and measured by a pH-meter (Thermo Scientific, 3-Star). “Co-Pi” modification was fabricated according to the photo-assisted electrodeposition methods.2 The hematite film was submerged in a solution of 0.5 mM cobalt nitrate in 0.1 M potassium phosphate (KPi) buffer (pH 7). A 150 W Xenon lamp coupled to a filter (AM 1.5G) was used as the white light source. The light power density of 100 mW/cm2 was measured with a radiometer (CEAULIGHT, CEL-NP2000). “Co-Pi” was electrodeposited at +0.1 V vs. Ag/AgCl for 15 min. Photoelectrochemical characterization PEC performances of the films were measured in 1M NaOH electrolyte solution (pH 13.6) in a three-electrode electrochemical cell. The electrolyte solution was deaerated by purging argon for 30 min before J-V scan. The measured potentials vs Ag/AgCl were converted to the reversible hydrogen electrode (RHE) scale according to the Nernst equation: ERHE = EAg/AgCl + 0.059pH + 0.1976. A 150 W Xenon lamp coupled to a filter (AM 1.5G) was used as the white light source. The light power density of 100 mW/cm2 was measured with a radiometer (CEAULIGHT, CEL-NP2000). The exposed area for all the photoanodes were controlled by a Teflon mold with a standard 1 cm2 hole. Electrochemical impedance spectra were measured under visible light illumination (λ>420 nm, I0=60 mW/cm2), recorded by an electrochemical workstation (PGSTAT302N autolab, Metrohm). A sinusoidal voltage pulse of 10 mV amplitude was applied on a bias voltage, with a frequency that ranged from 10 kHz to 1Hz. Mott-Schottky plots were collected with bias voltage scanned from -0.4 to 0.1 V vs. Ag/AgCl with a 50 mV interval, in the dark at a frequency of 1000Hz. The raw data were fitted using Nova 1.8 software from Metrohm Inc. Oxygen detection Oxygen was detected by a Thermo Scientific Orion 3-Star dissolved oxygen meter. The photoelectrochemical cell was a two-compartment cell divided by a porous ceramics for cutting off the gas flow but keeping the conduction of the circuit. The hematite photoanode together with Ag/AgCl reference electrode and the sensor of the dissolved oxygen meter were placed in one cell, and the Pt counter electrode was placed into the other one. Both cells were filled with 1M NaOH electrolyte solution (pH 13.6). The electrolyte in the working compartment was 30 mL. A 150 W Xenon lamp coupled to a filter (AM 1.5G) was used as the white light source. The applied potential was 1.23 VRHE. Before every experiment, the whole system was deaerated by purging high-purity argon for one hour and then all of the connectors were sealed by silicone rubber. This procedure was repeated for several times until the reading of the dissolved oxygen meter kept below 0.1 mg/L for 30 min. The quantity of electric charge passing through the circuit was recorded by an electrochemical workstation (CHI 760D). The charge passed during the experiment was then converted to moles by dividing by 4F (F = 96485 C/mol). Structural characterization X-ray diffraction (XRD) measurements were performed on a Regaku D/Max-2500 diffractometer with the Cu KR radiation (1.5406 Å). Diffraction patterns were recorded from 20 to 80° 2θ with a step size of 0.04° at 4°/min. X-ray photoelectron spectroscopy (XPS) data were obtained with an ESCALab220i-XL electron spectrometer from VG Scientific using 300W Al Kα radiation. The base pressure was about 3×10⁻⁹ mbar. The binding energies were referenced to the C1s line at 284.8 eV from adventitious carbon. Ar ion etching was conducted at an Ar partial pressure of 2 × 10⁻⁷ mbar at 3 kV and 10 mA resulting in 0.07 nm/sec etching rate. SEM data were obtained with a Hitachi S4800 scanning electron microscope (HITACHI Ltd) with the acceleration voltage of 15 KV. TEM data were performed on a Tecnai G2 F30 S-TWIN 300kV field-emission microscope. XAFS experiments were carried out at the XAFS station of the Beijing Synchrotron Radiation Facility (BSRF). The beamline provided a focused X-ray beam from 5 to 20 keV with a photon flux on the order of 1011 phs/s (@ 10 keV) and a beam size of 0.9(H)× 0.3(V)mm2. The energy was calibrated by a standard Fe metal foil before experiments started. Fe K-edge X-ray absorption fine structure (XAFS) spectra of the samples were collected by a Lyttle fluorescence detector at room temperature. The X-ray absorption fine structure (XAFS) was collected from -20 to +60 eV relative to the Fe K-edge. P K-edge XAFS spectra were collected at beamline 4B7A of BSRF, with energy range from 2.05keV to 6.0keV, and energy bandpass about 0.3eV at P K-edge. The sample was measured in PFY model with a SDD detector. The data analysis of XANES was carried out using the Athena and Artemis interfaces to the IFEFFIT program package. DFT calculations The first-principle calculations were carried out using the Vienna ab initio simulation package (VASP) based on DFT+U with projector-augmented wave (PAW) pseudo-potential method. The exchange and correlation energy was treated via the generalized gradient approximation (GGA) using the Perdew-Burke-Emzerh of formulation. A conjugate-gradient algorithm was used to relax the ions into their ground states, and the energies and the forces on each ion were converged within 1.0 × 10⁻⁴ eV/atom and 0.01 eV/Å, respectively. The Koln-Sham orbitals were expanded by a plane wave basis set and an energy cutoff of 400 eV was used throughout. O 2p orbitals were regarded as valence band orbitals while Fe 3d and 4s were regarded as conduction band orbitals. The Brillouin-zone integration is per-formed by using the Gamma-centered Monkhorst-Pack scheme with 5×5×1 k-points, together with a Gaussian smearing broadening of 0.1 eV. The electron effective mass can be calculated as: 1. Y. Ling, G. Wang, D. A. Wheeler, J. Z. Zhang and Y. Li, Nano. Lett., 2011, 11, 2119-2125. 2. D. K. Zhong, M. Cornuz, K. Sivula, M. Graetzel and D. R. Gamelin, Energy. Environ. Sci., 2011, 4, 1759-1764. 2 J (mA/cm ) 2.5 2.0 1.5 1.0 A 0.5 0.0 0.6 0.8 1.0 1.2 1.4 Potential (V vs. RHE) 1.6 1.8 1.0 1.8 1.6 B 2- - HPO4 H2PO4 0.8 1.4 1.2 0.6 1.0 0.8 0.4 0.6 3- PO4 H3PO4 0.4 0.2 0.2 0.0 2 4 6 8 10 Mole Fraction 3 5 6 7 8 9 10 11 12 13 Photocurent density (mA/cm-2) 3.0 0.0 14 12 pH Figure S1. (A) J-V scans collected for P-doped hematite synthesized by phosphate solutions with different pH and annealed at 650C. (B) Photocurrent densities obtained at 1.23 VRHE. 0.20 pH3 pH8 pH12 2 J (mA/cm ) 0.15 0.10 0.05 0.00 0.6 0.8 1.0 1.2 1.4 1.6 Potential (V vs. RHE) Figure S2. J-V scans collected for undoped hematite photoanodes synthesized by solutions with different pH and annealed at 650C. 80 NW650 PNW650 NW750 PNW750 8 6 70 A Faradaic efficiency O2 produced (mol) 10 4 2 0 0 5 10 15 20 Time (min) 25 30 B 60 50 40 30 20 PNW650 NW750 PNW750 10 0 5 10 15 20 Time (min) 25 30 Figure S3. (A) O2 evolution and (B) the corresponding faradic efficiency detected by a dissolved oxygen meter during the PEC water oxidation at 1.23 VRHE for the pristine and P-doped hematite photoanodes annealed at 650C and 750C. The faradaic efficiencies for all the PEC oxygen evolution were around 70%. Since no other species except H2O can be oxidized in our PEC systems, the deviation of the faradaic efficiencies from unity should be caused by some systematic errors. 3.4 3.0 B A 3.3 2.9 3.1 2 J (mA/cm ) 2 J (mA/cm ) 3.2 3.0 2.9 2.8 2.7 2.6 2.7 2.6 0.0 2.8 0.2 0.4 0.6 0.8 2.5 1.0 0 5 10 15 Time (h) 20 25 30 35 40 Time (h) Figure S4. Long-term PEC experiments for (A) PNW750+CoPi and (B) PNW750 in 1 M NaOH at 1.23 VRHE. NW650 PNW650 A Absorbance (a.u.) Absorbance (a.u.) 1.6 1.4 1.2 1.0 0.8 0.6 0.4 0.2 0.0 -0.2 400 500 600 700 Wavelength (nm) 800 IPCE (%) 40 1.4 1.2 1.0 0.8 0.6 0.4 0.2 0.0 -0.2 B 400 NW750 PNW750 500 600 700 Wavelength (nm) 800 PNW750 NW750 PNW650 NW650 C 30 20 10 0 350 400 450 500 550 Wavelength (nm) 600 650 Figure S5. UV-vis data collected for P-doping hematite photoanodes annealed at (A) 650C and (B) 750C. (C) IPCE values collected for undoped and P-doped hematite photoanodes. -2 10 -2 4 C ( 10 F cm ) 5.0 4.5 4.0 3.5 3.0 2.5 2.0 1.5 1.0 0.5 0.0 NW650 PNW650 0.60 0.65 0.70 0.75 0.80 0.85 0.90 Potential (V vs. RHE) Figure S6. Mott-Schottky plots collected in the dark for undoped and P-doped hematite photoanodes annealed at 650C. 12 NW650-exp PNW650-exp NW650-fit PNW650-fit 8 2 -Z'' (10 ) 10 6 Cbulk Rs 4 CPE Rct,trap Rtrapping 2 Ctrap CPE 0 0 2 4 6 2 8 10 12 14 Z' / (10 ) Figure S7. Nyquit plot collected for NW650 and PNW650 at 1.2VRHE. Inset is the equivalent circuit used for the fit and simulation. In this model, Rs stands for all the series resistances in the electrochemical cell, Cbulk represents the capacitance of the space charge depletion region at the surface of the electrode, Rtrapping represents the resistance in the process of trapping holes by surface states, Ctrap represents the amount of active sites in surface states, and Rct,trap represents the resistance in the process of charge transfer across the interface. 4 3 30 0 2 -30 1 -60 -90 pH3 pH8 pH12 0 B 120 2 60 150 Rs (cm ) A Photocurrent (mA) 3 2 Rct,trap ( cm ) 90 90 60 30 0 pH3 pH8 pH12 2.5 -2 Cbulk(10 F cm ) C 2.0 -5 1.5 1.0 0.5 0.0 pH3 pH8 pH12 Figure S8. Fitted values of (A) Rct,trap, (B) Rs, (C) Cbulk from EIS spectra collected for P-doped hematite anodes impregnated by phosphate solutions with different pH and annealed at 650C. Fe2O3 20 -1 -1 DOS (states.eV .atom ) 40 0 -20 2.0 eV -40 -20 -15 -10 -5 Energy (eV) Figure S9. DOS of pure hematite. 0 5 10 Figure S10. DOS of P-doped hematite structures. Fe2O3 A) B) Energy (eV) Energy (eV) 0 -2.5 A H K M L F Q Z Fe3 D) Fe2 C) 2.5 Energy (eV) Energy (eV) 0 -2.5 H 2.5 0 -2.5 Fe1 2.5 2.5 F Q Z 0 -2.5 F Q Z E) Fe4 Energy (eV) 2.5 0 -2.5 F Q Z Figure S11. Band structures of (A) pristine hematite and (B)-(E) P-doped hematite. A) B) C) D) E) Figure S12. Electron density distribution plots for (A) pristine and (B)-(E) P-doped hematite (110) surface. 800000 NW650 PNW650 700000 B 9000 8500 500000 Counts Counts 600000 9500 A 400000 300000 200000 P 2p 8000 7500 7000 6500 100000 6000 0 0 200 400 600 800 1000 Binding Energy (ev) 1200 125 130 135 140 Binding Energy (ev) 145 Figure S13. (A) The XPS survey data collected for NW650 and PNW650. (B) The P 2p detail spectrum collected for PNW650. The XPS survey data confirm the presence of P on the surface of PNW650, while no P signal is detected on NW650. The high resolution P 2p spectrum shows that the P 2p binding energy of 133.3 eV which is much higher than the reported for phosphate (132.1-132.9 eV), but is nearly consistent with values reported for FePO4 (133.4 eV). PNW650 NW650 Figure S14. SEM images of undoped and P-doped hematite (cross-section view). PNW750 NW750 Figure S15. SEM images for P-doped (right) and undoped (left) hematite photoanodes annealed at 750C. Similar to the situation in 650C, the P-doped hematite nanowires annealed at 750C became thinner than the undoped 1.2 * * * 1.0 0.8 0.6 0.4 0.2 0.0 10 20 30 40 50 60 2 Theta (degree) 70 80 * (110) * FTO 1.8 * 1.6 1.4 1.2 NW750 PNW750 B * (300) * 1.4 2.0 (104) 1.6 NW650 PNW650 A Normalized Intensity (a.u.) * * FTO 1.8 (300) 2.0 (104) (110) Normalized Intensity (a.u.) ones. ** 1.0 0.8 0.6 0.4 0.2 0.0 10 20 30 40 50 60 70 80 2 Theta (degree) Figure S16. XRD patterns of undoped and P-doped hematite for (A) annealed at 650C and (B) annealed at 750C. pH3 pH8 pH12 0.6 pH3 pH8 pH12 8 Normolized x Normolized x 0.8 0.4 0.2 7114 7116 7118 7120 7122 7124 6 4 2 0 2150 E (eV) 2151 2152 2153 E (eV) Figure S17. A comparison of Fe K-edge X-Ray absorption near edge structure (XANES) spectra (left) and P K-edge XANES spectra (right). For Fe K-edge XANES spectra, the pre-edge peak at 7114 eV exhibited a gradual increase with the decrease of pH. This pre-edge peak is a signature of the 1s-3d transition of tetrahedrally coordinated Fe, which is commonly found in Fe3O4 and quite weak for the α-Fe2O3. The larger pre-edge peak 4 * 3 A * * * * NW650 pH3 pH8 pH12 2 1 0 20 30 40 50 60 2 Theta (degree) 70 80 Relative Intensity of (110) Diffraction * FTO (300) 5 (104) (110) Normalized Intensity (a.u.) suggests that the content of tetrahedrally coordinated Fe increased with the decrease of pH. 0.60 pH3 pH8 pH12 0.55 0.50 B 0.45 0.40 0.35 0.30 0.25 560 580 600 Temperature(0C) 620 640 Figure S18. (A) XRD patterns collected for undoped and P-doped hematite anodes impregnated by phosphate solution with different pH and annealed at 650C. (B) The relative (110) diffraction from temperature programmed XRD. Table S1. Fitted values of the EIS data in Figure 2A Rs Cbulk Rtrapping -6 NW650 142.5 Ωcm2 PNW650 119.4 Ωcm2 5.9 × 10 F -2 cm 2.2 × 10⁻⁵ F cm-2 Ctrap Rct,trap -5 3194.2 Ωcm2 230.6 Ωcm2 4.6 × 10 F cm-2 4.9 × 10⁻⁴ F cm-2 25441.2 Ωcm2 81.5 Ωcm2 Table S2. The content of P from XPS experiments for P-doped hematite anodes impregnated by phosphate solution with different pH and annealed at 650C. P% pH3 pH8 pH12 4.14 4.87 2.92


© Copyright 2026