
Market Synopsis 29012015
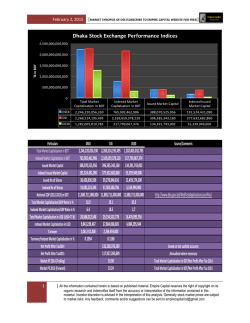
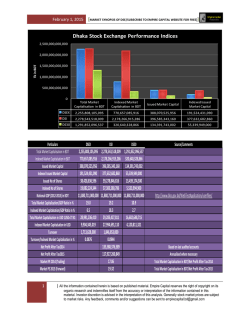
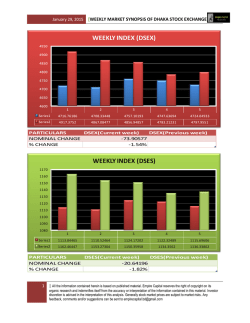
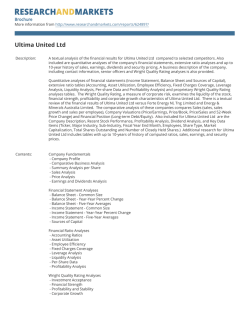
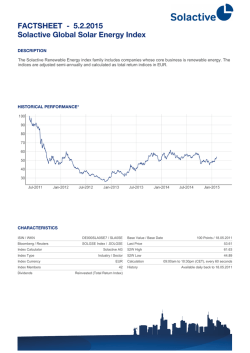
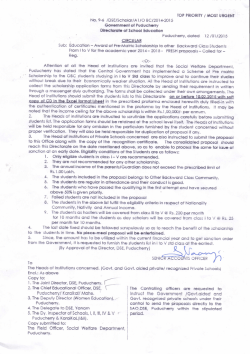
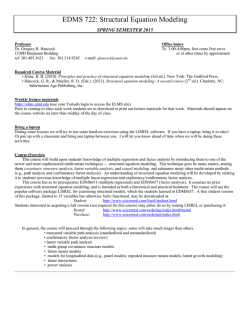
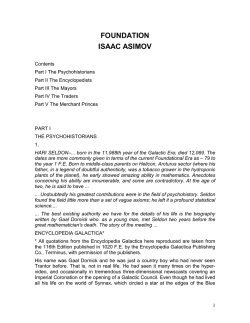
January 29, 2015
[MARKET SYNOPSIS OF DSE/SUBSCRIBE TO EMPIRE CAPITAL WEBSITE FOR FREE]]
Dhaka Stock Exchange Performance Indices
2,500,000,000,000
Tk in BDT
2,000,000,000,000
1,500,000,000,000
1,000,000,000,000
500,000,000,000
0
Total Market
Capitalisation in BDT
Issued Market Capital
Indexed Issued
Market Capital
DSEX
2,283,567,723,878
780,479,932,847
388,070,525,956
191,524,431,090
DSI
2,306,933,576,116
2,203,839,271,695
396,585,343,160
377,632,682,860
DS30
1,305,667,197,409
324,607,685,157
134,391,743,002
55,339,949,000
Particulars
Total Market Capitalisation in BDT
Indexed Market Capitalsation in BDT
Issued Market Capital
Indexed Issued Market Capital
Issued No of Shares
Indexed No of Shares
National GDP (2012-2013) in BDT
Total Market Capitalisation/GDP Ratio in %
Indexed Market Capitalsation/GDP Ratio in %
Total Market Capitalisation in USD 1USD=78.34
Indexed Market Capitalsation in USD
Turnover
Turnover/Indexed Market Capitalisation in %
Net Profit After Tax2014
Net Profit After Tax2015
Market PE 2014 (Trailing)
Market PE 2015 (Forward)
1
Indexed Market
Capitalsation in BDT
DSEX
DSI
DS30
2,283,567,723,878
780,479,932,847
388,070,525,956
191,524,431,090
38,428,836,596
19,082,224,344
11,880,711,000,000
19.2
6.6
29,149,447,586
9,962,725,719
1,956,768,000
0.1000
2,306,933,576,116
2,203,839,271,695
396,585,343,160
377,632,682,860
39,278,846,816
37,383,580,786
11,880,711,000,000
19.4
18.5
29,447,709,677
28,131,724,173
2,065,740,000
0.1056
133,588,376,589
117,927,260,849
17.27
19.56
1,305,667,197,409
324,607,685,157
134,391,743,002
55,339,949,000
13,439,174,300
5,533,994,900
11,880,711,000,000
11.0
2.7
16,666,673,442
4,143,575,251
Source/Comments
http://www.bbs.gov.bd/WebTestApplication/userfiles/
Based on last audited accounts
Annualised where necessary
Total Market Capitalisation in BDT/Net Profit After Tax 2014
Total Market Capitalisation in BDT/Net Profit After Tax 2015
| All the information contained herein is based on published material. Empire Capital reserves the right of copyright on its
organic research and indemnifies itself from the accuracy or interpretation of the information contained in this
material. Investor discretion is advised in the interpretation of this analysis. Generally stock market prices are subject
to market risks. Any feedback, comments and/or suggestions can be sent to [email protected]
January 29, 2015
SECTOR
YDAY MARKET CAP
Bank
Cement
Ceramic
Engineering
Financial Institutions
Food & Allied
Fuel and Power
Insurance
IT Sector
Jute
Miscellaneous
Pharma & Chemicals
Service & Real Estate
Tannery
Telecommunication
Textile
Travel & Leisure
Paper and Printing
TOTAL EQUITY MARKET CAP
MARKET CAP
404,090,284,834
198,460,743,300
23,331,154,698
102,145,087,333
139,291,476,843
234,256,940,851
317,510,948,103
80,402,540,370
5,830,051,396
814,207,600
60,392,481,337
323,295,493,736
20,421,202,357
23,438,959,485
464,085,883,971
80,069,440,007
26,928,851,801
484,500,000
2,505,250,248,023
INDEX
DSEX
DSES
DS30
TOTAL MARKET CAPITALIZATION
2
[MARKET SYNOPSIS OF DSE/SUBSCRIBE TO EMPIRE CAPITAL WEBSITE FOR FREE]]
403,094,677,831
197,832,526,832
22,435,286,524
100,536,197,238
137,619,329,627
240,418,839,865
313,278,675,824
79,321,205,009
5,849,757,247
802,874,300
59,878,196,530
322,074,787,421
19,868,967,241
23,666,829,732
461,024,416,965
81,838,640,394
26,814,327,721
476,900,000
2,496,832,436,301
% CHANGE MARKET CAP% OF TOTAL MARKET CAPYDAY TURNOVER(in mn) TURNOVER(in mn)
-0.25%
-0.32%
-3.84%
-1.58%
-1.20%
2.63%
-1.33%
-1.34%
0.34%
-1.39%
-0.85%
-0.38%
-2.70%
0.97%
-0.66%
2.21%
-0.43%
-1.57%
-0.34%
16.14%
7.92%
0.90%
4.03%
5.51%
9.63%
12.55%
3.18%
0.23%
0.03%
2.40%
12.90%
0.80%
0.95%
18.46%
3.28%
1.07%
0.02%
100.00%
162.719
54.986
41.097
265.937
136.414
61.013
316.273
37.19
143.596
2.003
95.29
245.686
101.294
6.116
109.282
393.786
15.45
8.359
2196.491
186.309
94.414
37.608
235.89
134.481
91.084
308.761
43.536
72.517
1.722
76.113
163.598
64.598
7.32
114.96
317.006
21.094
6.851
1977.862
% CHANGE TURNOVER
14.50%
71.71%
-8.49%
-11.30%
-1.42%
49.29%
-2.38%
17.06%
-49.50%
-14.03%
-20.12%
-33.41%
-36.23%
19.69%
5.20%
-19.50%
36.53%
-18.04%
-9.95%
YESTERDAY
TODAY
% CHANGE
4747.63694
4724.04933
-0.4968%
1122.32489
1115.69606
-0.5906%
1756.80991
1747.75509
-0.5154%
3190599.23
3177697.796
-0.40%
| All the information contained herein is based on published material. Empire Capital reserves the right of copyright on its
organic research and indemnifies itself from the accuracy or interpretation of the information contained in this
material. Investor discretion is advised in the interpretation of this analysis. Generally stock market prices are subject
to market risks. Any feedback, comments and/or suggestions can be sent to [email protected]
January 29, 2015
[MARKET SYNOPSIS OF DSE/SUBSCRIBE TO EMPIRE CAPITAL WEBSITE FOR FREE]]
Market Capitalisation Composition
Market Turnover Composition
3
| All the information contained herein is based on published material. Empire Capital reserves the right of copyright on its
organic research and indemnifies itself from the accuracy or interpretation of the information contained in this
material. Investor discretion is advised in the interpretation of this analysis. Generally stock market prices are subject
to market risks. Any feedback, comments and/or suggestions can be sent to [email protected]
January 29, 2015
[MARKET SYNOPSIS OF DSE/SUBSCRIBE TO EMPIRE CAPITAL WEBSITE FOR FREE]]
Sector
Bank
Cement
Ceramic
Engineering
Financial Institutions
Food & Allied
Fuel and Power
Insurance
IT Sector
Jute
Miscellaneous
Pharma & Chemicals
Service & Real Estate
Tannery
Telecommunication
Textile
Travel & Leisure
Paper and Printing
Total Market Cap.(DSEX)
Total Market Cap.(DSI)
Total Market Cap.(DS30)
Turnover
375,255,665,413
375,255,665,105
94,063,595,346
197,832,531,743
197,832,531,743
172,339,908,888
20,292,728,655
20,539,525,437
83,198,649,161
83,567,793,535
32,282,637,975
137,038,601,275
137,922,575,755
16,347,843,320
207,346,552,288
217,607,959,328
203,557,074,385
262,163,927,566
262,533,496,634
197,167,927,238
75,265,041,189
76,537,008,265
24,885,853,718
5,135,550,649
5,135,550,621
262,792,800
781,462,800
59,694,590,943
59,761,305,994
16,149,107,685
281,475,317,060
288,677,757,463
45,397,929,017
14,154,112,354
14,154,112,322
23,448,987,840
23,655,387,840
461,024,416,970
461,024,416,970
461,024,416,970
56,208,172,372
57,711,103,158
19,157,717,269
23,293,185,600
23,759,023,148
23,293,185,600
476,900,000
476,900,000
-
% Turnover of TMC(DSEX) % Turnover of TMC(DSI) % Turnover of TMC(DS30)
186.309
0.0496%
0.0496%
0.1981%
94.414
0.0477%
0.0477%
0.0548%
37.608
0.1853%
0.1831%
0.0000%
235.89
0.2835%
0.2823%
0.7307%
134.481
0.0981%
0.0975%
0.8226%
91.084
0.0439%
0.0419%
0.0447%
308.761
0.1178%
0.1176%
0.1566%
43.536
0.0578%
0.0569%
0.1749%
72.517
1.4121%
1.4121%
0.0000%
1.722
0.6553%
0.2204%
0.0000%
76.113
0.1275%
0.1274%
0.4713%
163.598
0.0581%
0.0567%
0.3604%
64.598
0.4564%
0.4564%
0.0000%
7.32
0.0312%
0.0309%
0.0000%
114.96
0.0249%
0.0249%
0.0249%
317.006
0.5640%
0.5493%
1.6547%
21.094
0.0906%
0.0888%
0.0906%
6.851
1.4366%
1.4366%
0.0000%
Sector
Bank
Cement
Ceramic
Engineering
Financial Institutions
Food & Allied
Fuel and Power
Insurance
IT Sector
Jute
Miscellaneous
Pharma & Chemicals
Service & Real Estate
Tannery
Telecommunication
Textile
Travel & Leisure
Paper and Printing
Indexed Market Cap.(DSEX) Indexed Market Cap.(DSI) Indexed Market Cap.(DS30) Turnover
197,322,130,003
375,115,156,495
45,762,973,885
84,276,981,003
186,199,336,743
75,463,943,297
5,367,499,885
20,539,525,437
31,321,308,044
69,364,643,184
11,515,945,455
59,374,677,511
133,745,726,787
5,223,525,177
43,963,612,950
216,832,861,490
36,490,391,076
74,068,979,918
241,686,793,199
57,996,162,098
33,439,962,369
61,929,235,839
8,640,632,325
3,779,957,874
4,660,041,287
97,233,336
781,462,800
18,040,566,892
56,854,531,410
12,757,795,043
107,511,217,111
282,474,940,960
6,072,085,146
5,148,746,093
14,154,112,322
8,807,358,689
23,655,387,840
48,721,740,786
451,468,415,601
48,721,740,786
25,478,009,801
47,322,634,132
8,928,687,174
7,033,803,696
10,712,137,418
7,033,803,696
163,052,110
476,900,000
-
% Turnover of IMC(DSEX) % Turnover of IMC(DSI) % Turnover of IMC(DS30)
186.309
0.0944%
0.0497%
0.4071%
94.414
0.1120%
0.0507%
0.1251%
37.608
0.7007%
0.1831%
0.0000%
235.89
0.7531%
0.3401%
2.0484%
134.481
0.2265%
0.1005%
2.5745%
91.084
0.2072%
0.0420%
0.2496%
308.761
0.4169%
0.1278%
0.5324%
43.536
0.1302%
0.0703%
0.5039%
72.517
1.9185%
1.5561%
0.0000%
1.722
1.7710%
0.2204%
0.0000%
76.113
0.4219%
0.1339%
0.5966%
163.598
0.1522%
0.0579%
2.6943%
64.598
1.2546%
0.4564%
0.0000%
7.32
0.0831%
0.0309%
0.0000%
114.96
0.2360%
0.0255%
0.2360%
317.006
1.2442%
0.6699%
3.5504%
21.094
0.2999%
0.1969%
0.2999%
6.851
4.2017%
1.4366%
0.0000%
4
| All the information contained herein is based on published material. Empire Capital reserves the right of copyright on its
organic research and indemnifies itself from the accuracy or interpretation of the information contained in this
material. Investor discretion is advised in the interpretation of this analysis. Generally stock market prices are subject
to market risks. Any feedback, comments and/or suggestions can be sent to [email protected]
January 29, 2015
Sector
Bank
Cement
Ceramic
Engineering
Financial Institutions
Food & Allied
Fuel and Power
General Insurance
IT Sector
Jute
Miscellaneous
Pharma & Chemicals
Service & Real Estate
Tannery
Telecommunication
Textile
Travel & Leisure
[MARKET SYNOPSIS OF DSE/SUBSCRIBE TO EMPIRE CAPITAL WEBSITE FOR FREE]]
Sectoral PE
10.08
35.15
33.35
25.58
14.80
31.30
10.84
11.31
19.11
208.31
29.52
22.35
39.57
23.70
21.35
13.32
14.90
Market Capitalisation Negative Earnings excluded
403,094,677,831 ICBIBNK
197,832,526,832
22,435,286,524 SPCERAMICS,
100,536,197,238 AZIZ PIPES, KAY&QUE,
137,619,329,627 ILFSL, MIDASFIN
240,418,839,865 CVOPRL, FINEFOODS, GEMINISEA, MEGHCONMILK, RAHIMAFOOD, ZEAL BANGLA
313,278,675,824
35,720,809,628
5,849,757,247 INTECH
802,874,300 JUTESPIN
59,878,196,530
322,074,787,421 IMAMBUTTON
19,868,967,241
23,666,829,732
461,024,416,965
81,838,640,394 DULAMIACOT, SONARGAON, MODERNDYE
26,814,327,721
TOP 10 GAINERS BASED ON YCP AND CLOSE PRICE
Instr Code
NPOLYMAR
BSCCL
BATBC
ISLAMIINS
RANFOUNDRY
BGIC
KOHINOOR
MONNOSTAF
AMCL(PRAN)
PRIMEBANK
YCP
TOP 10 LOSERS BASED ON YCP AND CLOSE PRICE
Instr Code
EXIM1STMF
SPCL
HFL
NTLTUBES
METROSPIN
BDAUTOCA
KEYACOSMET
GEMINISEA
GSPFINANCE
RAKCERAMIC
YCP
5
High
64.2
102.6
2816.6
18.2
96.3
20.1
339
294.5
195.2
18.8
Low
70.4
112.1
2957.3
19.2
100.3
21.3
359
306.8
201
19.5
High
6.6
233.5
31.7
103.5
12.9
22.5
21.7
251.6
29.2
56.7
CLOSE
65
104
2780
18
95.2
19.5
337.5
294
193
18.7
Low
6
234
31.4
99.7
12.7
22.5
22
255
28.9
56.6
69.3
109.2
2934.4
18.9
99.9
20.8
348.9
302.5
200.5
19.3
CLOSE
6
213.1
28.8
93.2
12
20.7
20.3
234
27.4
53.6
6
213.9
29.1
95.2
12.1
21.2
20.5
238
27.7
54.1
%CHG
7.944
6.433
4.182
3.846
3.738
3.483
2.92
2.716
2.715
2.66
%CHG
-9.091
-8.394
-8.202
-8.019
-6.202
-5.778
-5.53
-5.405
-5.137
-4.585
| All the information contained herein is based on published material. Empire Capital reserves the right of copyright on its
organic research and indemnifies itself from the accuracy or interpretation of the information contained in this
material. Investor discretion is advised in the interpretation of this analysis. Generally stock market prices are subject
to market risks. Any feedback, comments and/or suggestions can be sent to [email protected]
January 29, 2015
[MARKET SYNOPSIS OF DSE/SUBSCRIBE TO EMPIRE CAPITAL WEBSITE FOR FREE]]
Lowest Forward PE Companies
Forward PE
GENNEXT( Generation Next Fashions Limited
5.51
SOUTHEASTB( Southeast Bank )
5.97
FAMILYTEX( Familytex (BD) Limited )
6.13
TRUSTBANK( Trust Bank Limited )
6.48
ABBANK( AB Bank Limited )
7.10
UNITEDAIR( United Airways (BD) Ltd.
7.18
ASIAPACINS( Asia Pacific General Insurance Co. Ltd. )
7.44
IFIC( IFIC Bank )
7.58
CONTININS( Continental Insurance Ltd. )
7.58
UTTARAFIN( Uttara Finance )
7.67
Highest Forward PE Comapnies
ECABLES( Eastern Cables )
Forward PE
1736.76
ATLASBANG( Atlas Bangladesh )
580.10
MONNOSTAF( Monno Jute Stafflers )
259.29
BAYLEASING( Bay Leasing & Investment Limited )
244.22
GEMINISEA( Gemini Sea Food )
171.11
BEACONPHAR( Beacon Pharmaceuticals Limited )
166.90
SONALIANSH( Sonali Aansh )
162.22
BXSYNTH( Beximco Synthetics )
143.48
RENWICKJA( Renwick Jajneswar & Co (Bd) )
124.57
BDAUTOCA( BD.Autocars )
113.51
Highest Dividend Yield Companies
Dividend Yield
RSRMSTEEL( Ratanpur Steel Re-Rolling Mills Limited )
9.23%
FIRSTSBANK( First Security Islami Bank Limited )
9.09%
SIBL( Social Islami Bank Limited )
8.63%
DHAKAINS( Dhaka Insurance Limited )
8.30%
SOUTHEASTB( Southeast Bank )
8.16%
DHAKABANK
8.10%
STANDBANKL( Standard Bank Limited )
8.00%
PHOENIXFIN( Phoenix Finance and Investments Ltd. )
7.97%
HEIDELBCEM( Heidelberg Cement Bd. )
7.74%
DELTASPINN( Delta Spinners Ltd. )
7.52%
6
| All the information contained herein is based on published material. Empire Capital reserves the right of copyright on its
organic research and indemnifies itself from the accuracy or interpretation of the information contained in this
material. Investor discretion is advised in the interpretation of this analysis. Generally stock market prices are subject
to market risks. Any feedback, comments and/or suggestions can be sent to [email protected]
January 29, 2015
[MARKET SYNOPSIS OF DSE/SUBSCRIBE TO EMPIRE CAPITAL WEBSITE FOR FREE]]
TOP TEN CHEAPEST STOCK BASED ON FORWARD PE RELATIVE TO SECTORAL PE
NAME OF THE COMPANY
CMCKAMAL( CMC Kamal )
QSMDRYCELL( Quasem Drycells )
BATBC( BATBC )
ORIONINFU( Orion Infusion Ltd. )
PADMAOIL( Padma Oil Co. )
METROSPIN( Metro Spinning
GP( Grameenphone Ltd. )
BATASHOE( Bata Shoe )
PRIMEINSUR( PRIME INSURACE )
NPOLYMAR( National Polymer )
Realtive to Sector PE most undervalued stocks
Column1
BANK
CEMENT
EBL( Eastern Bank )
PREMIERCEM( Premier Cement Mills Limited )
EXIMBANK( Export Import (Exim) Bank of Bangladesh )
HEIDELBCEM( Heidelberg Cement Bd. )
FIRSTSBANK( First Security Islami Bank Limited )
MEGHNACEM( Meghna Cement )
CERAMIC
ENGINEERING
RAKCERAMIC( RAK Ceramics (Bangladesh) Limited )
NPOLYMAR( National Polymer )
FUWANGCER( Fu-Wang Ceramic )
BSRMSTEEL( BSRM Steels Limited )
GOLDENSON( Golden Son Ltd. )
FINANCIAL INSTITUITION
FOOD AND ALLIED
ISLAMICFIN( Islamic Finance & Investment Ltd. )
BATBC( BATBC )
BDFINANCE( Bangladesh Finance and Investment Co.Ltd )
APEXFOODS( Apex Foods )
FASFIN( FAS Finance & Investment Limited )
RDFOOD( Rangpur Dairy & Food Products Ltd. )
FUEL AND POWER
GENERAL INSURANCE
PADMAOIL( Padma Oil Co. )
PRIMEINSUR( PRIME INSURACE )
SPPCL (Summit Purbanchol Power Company Limited )
MERCINS( Mercantile Insurance Co. Ltd. )
BEDL( Barakatullah Electro Dynamics Ltd. )
SONARBAINS( Sonar Bangla Insurance Ltd. )
IT SECTOR
MISCELLANEOUS
BDCOM( BDCOM Online Ltd. )
BERGERPBL( Berger Paints Bangladesh Ltd. )
DAFODILCOM( Daffodil Computers Ltd. )
SINOBANGLA( Sinobangla Industries )
INTECH( In Tech Online Ltd. )
ARAMIT( Aramit )
PHARMA AND CHEMICALS
SERVICE AND REAL ESTATE
MARICO( Marico Bangladesh Limited )
SAMORITA( Samorita Hospital )
ACTIVEFINE( Active Fine Chemicals Limited )
EHL( Eastern Housing )
SALVOCHEM( Salvo Chemical Industry Limited )
TANNERY
TELECOMMUNICATION
APEXADELFT( Apex Adelchi Footwear Ltd. )
GP( Grameenphone Ltd. )
BATASHOE( Bata Shoe )
TEXTILE
TRAVEL AND LEISURE
RNSPIN( R.N. Spinning Mills Limited )
BDSERVICE( Bangladesh Services Ltd. )
SAIHAMCOT( Saiham Cotton Mills Limited )
UNITEDAIR( United Airways (BD) Ltd.
PTL( Paramount Textile Limited )
7
| All the information contained herein is based on published material. Empire Capital reserves the right of copyright on its
organic research and indemnifies itself from the accuracy or interpretation of the information contained in this
material. Investor discretion is advised in the interpretation of this analysis. Generally stock market prices are subject
to market risks. Any feedback, comments and/or suggestions can be sent to [email protected]
January 29, 2015
[MARKET SYNOPSIS OF DSE/SUBSCRIBE TO EMPIRE CAPITAL WEBSITE FOR FREE]]
NOTES
DSE Indices as per „DSE Bangladesh Index Methodology‟ designed and developed by S&P Dow Jones Indices Dhaka Stock Exchange Indices
The Dhaka Stock Exchange presently computes two indices, DSE Broad Index (DSEX) and DSE 30 Index (DS30). None of the DSE Indi ces
include mutual funds, debentures and bonds. DSEX and DS30 Index
Introduction of DSE Indices
The Dhaka Stock Exchange Limited introduced DSE Broad Index (“DSEX”) and DSE 30 Index (“DS30”) as per „DSE Bangladesh Index
Methodology‟ designed and developed by S&P Dow Jones Indices with effect from January 28, 2013.” DSEX” is the Broad Index of the
Exchange (Benchmark Index) which reflects around 97% of the total equity market capitalization.DS30 constructed with 30 leading companies
which can be said as investable Index of the Exchange. “DS30” reflects around 51% of the total equity market capitalization. The criteria taken
into consideration in construction of these Indices are:
Market Capitalization
DS30 - Eligible stocks must have a float-adjusted market capitalization above 500 million BDT as of the rebalancing reference date.
DSEX - Eligible stocks must have a float-adjusted market capitalization above 100 million BDT. Additionally, if a current index constituent falls
below the 100 million BDT threshold, but is no less than 70 million BDT, then the stock remains in the index provided it also meets the other
inclusion criteria.
Float-Adjustment: A stock‟s weight in an index is determined by its float-adjusted market capitalization.
Liquidity
DS30- Stocks must have a minimum three-month average daily value traded (ADVT) of 5 million BDT as of the rebalancing reference date.
Liquidity criteria can be reduced to 3 million BDT in certain circumstance to ensure there are enough constituents in the ind ex. At each semiannual rebalancing, if a current index constituent falls below 5 million BDT but is no less than 3 million BDT then the stock remains in the index
provided it also meets the other eligibility criteria.
DSEX - Stocks must have a minimum six-month ADVT of 1 million BDT as of the rebalancing reference date. At each annual rebalancing, if a
current index constituent falls below 1 million BDT, but is no less than 0.7 million BDT, then the stock remains in the index provided it also
meets the other eligibility criteria. In addition, all eligible stocks for the DSE indices are required to trade at least half of normal trading days
each month for the three months prior to the rebalancing reference date.
Financial Viability
DS30 - Stocks must be profitable as measured by positive net income over the latest 12-month period, as of the rebalancing reference date. The
figure is calculated by adding the latest four quarters of net income reported for the company.
DSEX - Financial viability is not required for index membership.
Sector Classification
All listed DSE stocks are classified according to the DSE Industry Classification system. The number of constituents in Banks, Financial
Institutions, Insurance sector and Real Estate Sub-sector of Service & Real Estate sector is capped at 5 each and 10 combined for the DS30
Index.
Sector diversification rule is not applied to the DSEX.
Base Date
The base dates of the DSE 30 Index (DS30) and The DSE Broad Index (DSEX) are January 17, 2008.
Base Value
DSE 30 Index (DS30): The base value is 1000 for DS30 Index. The DSE Broad Index (DSEX): The DSE Broad index has a base value of 2951.91 on
Jan 17th 2008 which was the index value of the DSE General Index on this date. The new index is a broad market index and is d esigned to refect
the broad market performance. Starting the base value at 2951.91 the performance of the two indices has been linked and we maintain the
continuity of the performance of the benchmark. The two indices are very close in design and we can build on the history of the older index
which goes back to 2001.
“Interim IPO additions to the DSE Broad Index
8
| All the information contained herein is based on published material. Empire Capital reserves the right of copyright on its
organic research and indemnifies itself from the accuracy or interpretation of the information contained in this
material. Investor discretion is advised in the interpretation of this analysis. Generally stock market prices are subject
to market risks. Any feedback, comments and/or suggestions can be sent to [email protected]
January 29, 2015
[MARKET SYNOPSIS OF DSE/SUBSCRIBE TO EMPIRE CAPITAL WEBSITE FOR FREE]]
(DSEX) take place quarterly on the third Thursday of April, July and October. To be considered eligible for inclusion, an IPO must fall within the
top half of the ranked companies, by float-adjusted market capitalization and have at least one month of sufficient liquidity at each quarterly
observation date”. After ranking the companies in accordance with “DSE Bangladesh Index Methodology” designed &developed by S&P Dow
Jones Indices, following one (1) company was qualified for inclusion in the DSEX with effect from October 20, 2013.
1 Familytex (BD) Limited
As a result, the total numbers of constituents in DSEX stands at 207 (Two Hundred and Seven).
On January 16, 2014 new 23 companies were included to the DSEX and existing 4 companies were excluded. The new 23 companies that were
included to the DSEX are Fareast Finance, Eastern Cables, Renwick Jajneswar, National Tubes, Bengal Windsor Thermoplastics, Bangladesh
Building Systems, AMCL (Pran), Rahim Textile, Ambee Pharma, The Ibn Sina, Libra Infusions, Global Heavy Chemicals, JMI Syring es & Medical
Devices, Central Pharmaceuticals, Hakkani Pulp & Paper, Samorita Hospital, Information Services Network, Purabi General Insurance, Pragati
Insurance, Prime Insurance, Sunlife Insurance, Usmania Glass and Berger Paints. On the other hand, existing four companies th at lost their
eligibility to retain their position in the index are Kay & Que, Midas Finance, CVO Petrochemical and Rahima Food. As a result, the total
numbers of constituents in DSEX stands at 226 (Two Hundred and twenty Six).
Similarly on January 16, 2014 in the DS30, four new companies were added to the index. They are United Commercial Bank Ltd., Delta Life
Insurance Ltd, Orion Pharma Ltd and Renata Ltd.
The existing four companies that were excluded from the index are Beximco Ltd, Khulna Power Company Ltd, Square Textiles Ltd and
Southeast Bank Ltd as they failed to meet their criteria to stay in the index.
9
| All the information contained herein is based on published material. Empire Capital reserves the right of copyright on its
organic research and indemnifies itself from the accuracy or interpretation of the information contained in this
material. Investor discretion is advised in the interpretation of this analysis. Generally stock market prices are subject
to market risks. Any feedback, comments and/or suggestions can be sent to [email protected]

© Copyright 2026