
Log-Likelihood Method of Reducing Noise in CRISM Along
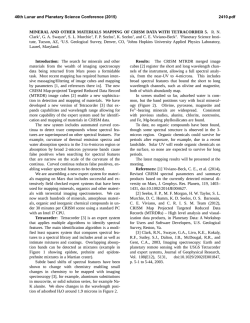
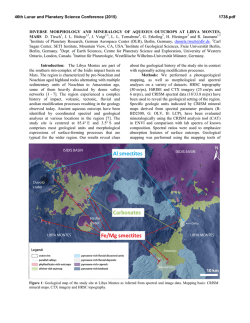
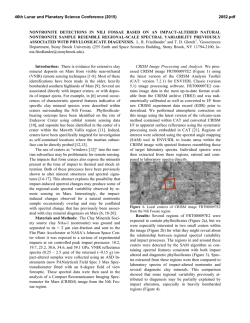
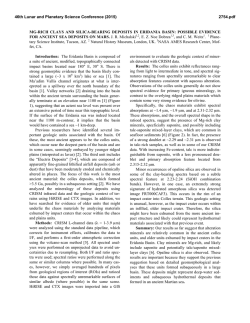
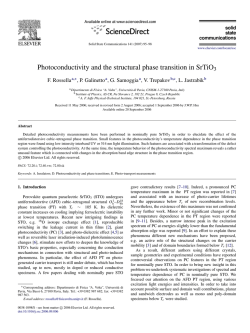
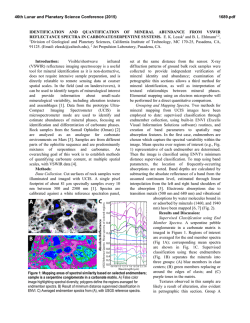
46th Lunar and Planetary Science Conference (2015)
1708.pdf
LOG-LIKELIHOOD METHOD OF REDUCING NOISE IN CRISM ALONG-TRACK OVERSAMPLED
HYPERSPECTRAL IMAGES. C. D. Kreisch1, R. E. Arvidson1, J. A. O’Sullivan1, K. Le1, E. A. Guinness1, D.
Politte1, N. Stein1, A. A. Fraeman2
1
Washington University in St. Louis, [email protected], 2California Institute of Technology.
Introduction: The Compact Reconnaissance Imaging Spectrometer for Mars (CRISM) on the Mars
Reconnaissance Orbiter (MRO) starting in 2010 began
acquiring Along-Track Oversampled (ATO) that can
be processed to spatial resolutions in the along-track
direction of as small as ~9 m/pixel as compared to the
normal 18 m/pixel. We present a new method to both
process and reduce noise in the ATOs.
We pursue processing the CRISM data from spectral radiance files because of known artifacts in standard I/F products. For this work we focus on generation
of I/F files in sensor space for the along-track oversampled CRISM observation ATO0002EC79, a scene
that the Curiosity rover will be driving into once finished with measuremnts in Pahrump Hills (see Figs.
1,2). DISORT-based processing and the Hapke function are used to retrieve surface single scattering albedos (SSAs), which are free of the effects of aerosols
and gases, include time-dependent wavelength shifts,
and are independent of lighting and viewing conditions.
We developed an iterative log maximum likelihood
method with a log hyperbolic cosine penalty function
regularization approach to retrieve scene SSA data in
the presence of noise [1]. The algorithm produces images with 9 m/pixel spatial resolution from images
originally with 18 m/pixel resolution. We compare our
results to standard processing of I/F data using map
projection capabilities (superGLT) contained within
ENVI/IDL. The log-likelihood method reduces Poisson
noise in the spectrum for a given hyperspectral pixel,
allowing for identification of subtle spectral absorptions otherwise lost in noise.
Algorithm Overview: We assume the CRISM
ATO data are Poisson distributed with mean μ, where μ
is the blurred version of the Martian surface, c. The
CRISM ATO data d are the blurred and noisy version
of the surface. The spatial and spectral transfer functions (TFs) characterize the blur. We assume the spatial
TF is given by a 2D Gaussian and use the asymmetric
Gaussian spectral TF given in the CRISM documentation.
It is more efficient to maximize the log of a function rather than the function itself, so we compute the
image c that maximizes the log-likelihood function for
the data. The Kuhn-Tucker conditions describe the
requirements for an image c to maximize the loglikelihood function. We begin with an initial guess c0
for the projected, estimated scene c and have the freedom to choose any reasonable output pixel size. For
ATO0002EC79 work we chose 9m.
The projected image c(k) is mapped into sensor
space, where k represents the kth iteration, and the spatial and spectral TFs are convolved with c(k) to obtain
an estimate for the measured data. We then divide the
ATO d by the simulated scene µ(k) and back project this
factor into dimensions of c by using inverses of the
TFs. We divide the back projected factor f(k) by H0 + U’
to obtain p(k), where U’ is the derivative of the penalty
function U with respect to image pixel c(λ’, x’, y’)(k).
Finally, the estimate for c is updated as c(k+1) = c(k)p(k)
and the the procedure iterates until convergence is
achieved.
Penalty Function Motivation and Methodology:
When using overlapping measurements with different
sampling for the measurements than in the desired final
product, noise and systematic errors in measurements
can propagate. If there are no direct measurements at a
given location, an interpolation strategy is needed.
Robust regularization addresses both issues simultaneously. We use a 2D neighborhood penalty in the spatial
and 1D penalty in the spectral dimensions. The penalty
takes the form of a log hyperbolic cosine function (see
Fig. 3).
The penalty function is quadratic for small differences and linear for large differences, where size is
relative to the chosen function parameters. The effect
of this penalty is to introduce smoothing for small differences in values, while allowing larger jumps. This
penalty is sometimes referred to as being in the Huber
class, motivated by Huber's robust estimation techniques.
Results: Preliminary results indicate that the new
algorithm sharpens in the spatial dimension and
smooths in the spectral dimension relative to the original SSA scene (see Figs. 4,6). For example, the retrieved scene and example linear unmixing end member spectra for L data are shown for third iterations and
compared to ENVI-IDL standard superGLT processing
in Figs. 5-6. Minor offsets arise from slightly different
pixel locations when comparing the projected and
unprojected scenes. Fig. 4 compares projected scenes
from the 1st and 3rd iterations to ENVI’s superGLT.
The alogorithm sharpens spatially as iterations continue and has more sharpening flexibility than standard
processing techniques.
46th Lunar and Planetary Science Conference (2015)
1708.pdf
References: [1]. O’Sullivan, J. A. et al., (1998),
IEEE Trans. Info. Theory, 44, 2094-2123.
Fig. 1: Foot print of ATO0002EC79 with Curiosity’s traverse. Curiosity is currently located at Pahrump
Hills, base of Mount Sharp, Gale Crater.
Fig. 3: Plot of penalty function with δ=0.03, a parameter controlling the transition threshold from quadratic and linear domains.
Fig. 2: Sensor space I/F L data cube for
ATO0002EC79. R: 2.5295 µm, G: 1.5066 µm, B:
1.0800 µm
Fig. 6: End member pectra for units shown in Fig.
5. Large spikes will be removed in ongoing work, using an enhanced penalty function and S data will also
be processed using the MLM procedures. Mineralogic
interpretations based on comparison to laboratory spectra and predictions will be testable using Curiosity’s
instruments.
Fig. 5 (below): Projected SSA L data cube 3 iterations with mineralogy map overlain. R: 2.5295 µm, G:
1.5066 µm, B: 1.0800 µm
Fig. 4: Portions of projected SSA L data cube for
ATO0002EC79. Top image after 1 iteration, middle
image after 3 iterations, and bottom image produced
from ENVI’s SuperGLT. Images are projected at
9m/pixel and span ~5 km across. R: 2.5295 µm, G:
1.5066 µm, B: 1.0800 µm


© Copyright 2026