
Evolution of the electronic structure with size in II-VI
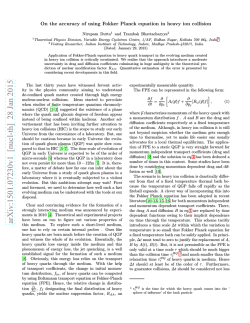
Evolution of the electronic structure with size in II-VI semiconductor nanocrystals Sameer Sapra and D. D. Sarma* Solid State and Structural Chemistry Unit, Indian Institute of Science, Bangalore-560012, India In order to provide a quantitatively accurate description of the band-gap variation with sizes in various II-VI semiconductor nanocrystals, we make use of the recently reported tight-binding parametrization of the corresponding bulk systems. Using the same tight-binding scheme and parameters, we calculate the electronic structure of II-VI nanocrystals in real space with sizes ranging between 5 and 80 Å in diameter. A comparison with available experimental results from the literature shows an excellent agreement over the entire range of sizes. I. INTRODUCTION It is now possible to grow a large variety of semiconductor nanocrystals and also control their sizes to obtain monodispersed particles.1,2 A large number of II-VI ͑Refs. 3–5͒ and III-V ͑Refs. 6 – 8͒ semiconductor nanocrystals have been prepared over the past two decades. These quantum dots are good candidates for electronic and optical devices9–13 due to their reduced dimensions, enabling one to reduce the size of electronic circuitry. Also, due to the increased oscillator strengths in these nanocrystals as a result of quantum confinement,14 these are expected to have higher quantum efficiencies in applications such as light emission. This is a direct consequence of a greater overlap between the electron and the hole wave functions upon size reduction. Moreover, one can tune these properties to suit a specific application by merely changing the size of the nanocrystals. For example, the band gap of CdSe can be varied from 1.9 eV to 2.7 eV by changing the size of the particle from 5.5 nm to 2.3 nm.15 Along with the band gap of the particle, the photoluminescence can also be varied through the red to the blue region of the visible spectrum.15 This quantum size effect can be explained qualitatively by considering a particle-in-a-box like situation where the energy separation between the levels increases as the dimensions of the box are reduced. Thus, one observes an increase in the band gap of the semiconductor with a decrease in the particle size On a more quantitative footing, various different theoretical approaches have been employed to account for the variation in the electronic structure of nanocrystallites as a function of its size. The first explanation for the size dependence of electronic properties in nanocrystals was given by Efros and Efros.16 It is based on the effective masses of the electron (m e* ) and the hole (m * h ). Known as the effective mass approximation ͑EMA͒, it is solved by taking various choices for the electron and hole wave functions and solving the effective mass equation variationally. In most EMA calculations, the confining potentials for the electron and the hole have been assumed infinite.14,16 –20 Therefore, the electron and the hole wave functions vanish at and beyond the surface of the nanocrystal, without the possibility of any tunneling. In the strong confinement regime, where R, the nanocrystal radius, is much smaller than a B , the Bohr exciton radius, Brus proposed17 the following expression for the band gap of the finite-sized system: E ͑ R ͒ ϭE g ϩ ͩ ͪ ប2 1 1 2 e2 Ϫ0.248 E * ϩ Ϫ1.786 Ry , 2 2 m* ⑀R m* e h R ͑1͒ where E g is the bulk band gap. The second term is the kinetic-energy term containing the effective masses, m e* and m h* , of the electron and the hole, respectively. The third term arises due to the Coulomb attraction between the electron and the hole, and the fourth term due to the spatial correlation between the electron and the hole which is generally small compared to the other two terms. EMA calculations have also been reported where a finite confining potential was used to account for the passivating agents that coat the surface of the nanocrystals in order to arrest their growth. Finite potential calculations are shown to improve the description for CdS nanocrystals to a large extent.21 Another improvement to the single band EMA is the inclusion of multiple bands for describing the hole effective mass. This is prompted by the fact that the top of the valence band for II-VI semiconductors comprised of triply degenerate bands at the ⌫ point and thus is better defined using a multiband theory. To account for this degeneracy, Einevoll22 and Nair et al.23 have used the effective bond-orbital model for the hole wave function, while the electron is described by a single-band EMA. Finite barrier heights and the electronhole Coloumb attraction are included in the calculation and exciton energies are obtained variationally in an iterative Hartree scheme. The multiband and finite potential EMA methods explain the experimental results reasonably well, but lack the predictive capabilities desirable of a theoretical model, since the finite potentials need to be adjusted to match the experimental results in each specific case. Pseudopotential calculations have also been carried out to study the variation of electronic structure with the nanocrystal size.24 –26 Recently, the semiempirical pseudopotential method has been employed to calculate the electronic structure of Si, CdSe,25 and InP26 nanocrystals. The atomic pseudopotentials are extracted from first-principles localdensity approximation ͑LDA͒ calculations on bulk solids. Thus, the wave functions are LDA-like while the band structures, effective masses, and deformation potentials are made to match experimental results. This method provides a reasonable description of the electronic structure of the nanocrystals. However, major computational efforts and difficulties do not allow one to calculate the properties of large sized nanocrystals. The tight-binding ͑TB͒ scheme has been employed by a number of researchers over the past decade.27–34 This method enjoys several advantages over the other methods discussed above, explaining its popularity. Compared to EMA, both pseudopotential method and the tight-binding approach provide a substantial improvement in the accuracy of the results. The tight-binding method has the further advantage of being significantly less demanding in terms of computational efforts, besides providing a simple physical picture in terms of the atomic orbitals and hopping interactions defined over a predetermined range. A detailed analysis of the first-principle electronic structure calculations can lead to a judicious tight-binding scheme that is minimal in terms of the dimension of the Hamiltonian matrix and yet is highly accurate due to the use of a physical and realistic basis.35 The earliest such TB parametrization was provided by Vogl et al.36 who used a TB model with the s p 3 s * orbital basis in order to describe the electronic structure of bulk semiconductors. The s * orbital was employed in an ad hoc manner in addition to the s p 3 orbital basis in order to improve the TB fit to the ab initio band dispersions. Subsequently, this TB model was used by Lippens and Lannoo27 to calculate the variations in the band gap for the corresponding semiconducting nanocrystals as a function of the size. Though their results are in better agreement compared to the infinite potential EMA, the sp 3 s * TB model tends to underestimate the band gap. The main problem with the s p 3 s * model appears to be a failure to reproduce even the lowest lying conduction band within that scheme.36 Improvements in the nearestneighbor s p 3 s * model have been carried out by including the spin-orbit coupling and the electron-hole interaction.28,29 However, to account for the conduction bands, the inclusion of d orbitals becomes necessary.30,34 This has been shown in the case of InP ͑Ref. 30͒ nanocrystals, a III-V semiconductor, that TB model with the s p 3 d 5 orbital basis for the anion and the sp 3 basis for the cation with next-nearest-neighbor interactions, for both the anion and the cation, gives excellent agreement with the experimental data. In a recent work, we have shown that the s p 3 d 5 orbital basis for both the cation and the anion and the inclusion of the next-nearest-neighbor interactions for the anions provide a very good description of the electronic structure of bulk II-VI semiconductors.35 This model is shown to describe accurately the band gap and the band dispersions for both the valence and the conduction bands over the energy range of interest. Therefore, this improved model and the parametrization should provide a good starting point for calculating the electronic properties of corresponding nanocrystals, provided the model and parameters are transferable from the bulk to the cluster limit. Ab initio calculations for a CdS cluster of about 16 Å diameter37 as well as results of Ref. 24 suggest that the present scheme is of sufficient accuracy down to about 16 Å, though the applicability of this approach may be limited for still smaller sized clusters. In order to explore the possibility of utilizing it effectively, we have used this model for calculating the band-gap variation over a wide range of sizes for A IIB VI semiconductor nanocrystals, with AϭCd or Zn and BϭS, Se, or Te, comparing the calculated results with the experimental data from the literature. The present results show a good agreement with experimental results, where ever available. II. THEORETICAL PROCEDURE The appropriate minimal TB model for the bulk electronic structure of group II-VI semiconductors was developed in Ref. 35 by analyzing the atomic wave-function characters of the various bands. This established sp 3 d 5 basis with the cation-anion and anion-anion interactions as the suitable model. The tight-binding electronic parameters, namely the orbital energies and the hopping strengths, were determined by fitting the ab initio band dispersions to the band dispersions obtained from the tight-binding Hamiltonian, given by Hϭ ͚ il 1 ⑀ l 1 a il† 1 a il 1 ϩ ͚ ij ͚ l l l1l2 ͑ t i 1j 2 a il† 1 a jl 2 ϩH.c.͒ , ͑2͒ where, the electron with spin is able to hop from the orbitals labeled l 1 with onsite energies equal to ⑀ l 1 in the ith unit cell to those labeled l 2 in the jth unit cell, with a hopl l ping strength t i 1j 2 ; the summations l 1 and l 2 running over all the orbitals considered on the atoms in a unit cell, and i and j over all the unit cells in the solid. We use exactly the same model with the parameter strengths given in Ref. 35 to calculate the electronic structure of corresponding nanocrystals as a function of the size. We build the cluster shell by shell, starting from a central atom. For the tetrahedrally coordinated compounds in the zinc-blende structure, the central atom, say the cation, is surrounded by a shell of four anions. In turn each of these anions is coordinated by four cations, one of them being the central cation. The other three cations form a part of the next shell. The clusters are generated in this manner by successive addition of shells. Assuming a spherical shape of the cluster, the diameter d is given by dϭa ͫ ͬ 3N 4 1/3 , ͑3͒ where a is the lattice constant and N the number of atoms present in the nanocrystal. Table I lists the number of atoms present upto a given shell and the diameter of the nanocrystal for various A IIB VI compounds. The Hamiltonian matrix for any given sized cluster is obtained from Eq. ͑2͒ with the same atomic orbital basis and electronic parameter strengths as given in Ref. 35 and is diagonalized to obtain the eigenvalue spectra for the nanocrystal. Direct diagonalization methods are practical only for cluster sizes containing less than ϳ1500 atoms. For larger clusters, we use the Lanczos iterative method.38 TABLE I. The unit-cell edge length for zinc-blende phase (a), number of shells (n s ), number of atoms ͑N͒ in n s , and the average diameter d for various A IIB VI semiconductors studied. ns 3 4 5 6 7 8 9 10 11 12 13 14 15 16 17 18 19 20 21 22 23 a(Å) N 17 41 83 147 239 363 525 729 981 1285 1647 2071 2563 3127 3769 4493 5305 6209 7211 8315 9527 ZnS 5.41 ZnSe 5.67 ZnTe CdS 6.10 5.82 d(Å) CdSe 6.05 CdTe 6.48 8.63 11.57 14.64 17.71 20.83 23.94 27.07 30.20 33.35 36.49 39.63 42.78 45.93 49.08 52.23 55.38 58.53 61.68 64.84 67.99 71.15 9.04 12.13 15.34 18.56 21.83 25.09 28.38 31.66 34.95 38.24 41.54 44.83 48.14 51.44 54.74 58.04 61.35 64.65 67.95 71.26 74.57 9.73 13.05 16.51 19.97 23.48 26.99 30.53 34.06 37.60 41.14 44.69 48.23 51.79 55.34 58.89 62.44 66.00 69.55 73.11 76.66 80.22 9.65 12.94 16.37 19.81 23.29 26.77 30.28 33.78 37.29 40.80 44.32 47.84 51.36 54.88 58.41 61.93 65.46 68.98 72.51 76.03 79.56 10.34 13.86 17.53 21.22 24.95 28.68 32.43 36.18 39.94 43.70 47.47 51.24 55.01 58.78 62.56 66.33 70.11 73.88 77.66 81.44 85.22 9.28 12.45 15.75 19.05 22.41 25.76 29.13 32.49 35.87 39.25 42.64 46.02 49.41 52.80 56.19 59.58 62.97 66.36 69.75 73.14 76.54 The Lanczos algorithm uses a starting basis function ͉ 0 ͘ which can be a linear combination of the atomic orbitals, i ’s, i.e., ͉ 0͘ ϭ ͚i c i͉ i ͘ . Once the starting basis function has been generated, a new basis function ͉ 1 ͘ is generated by applying the Hamiltonian and then making the resulting function orthogonal to ͉ 0 ͘ . ͉ 1 ͘ ϭH ͉ 0 ͘ Ϫ ͗ 0͉ H ͉ 0͘ ͉ 0͘ . ͗ 0͉ 0͘ Then onwards the subsequent basis functions can be generated by using the recursion formula ͉ nϩ1 ͘ ϭH ͉ n ͘ Ϫa n ͉ n ͘ Ϫb 2n ͉ nϪ1 ͘ nϭ0,1,2, . . . , where, a nϭ ͗ n͉ H ͉ n͘ , ͗ n͉ n͘ b 2n ϭ ͗ n͉ n͘ , ͗ nϪ1 ͉ nϪ1 ͘ with b 0 ϭ0 and ͉ Ϫ1 ͘ ϭ0. By construction, each basis function is orthogonal to the previously generated basis functions. Here the a n ’s are the diagonal elements, while b n ’s are the off-diagonal terms of the Hamiltonian matrix. Diagonalization of this tridiagonal matrix is less time consuming and gives the eigenvalue spectrum for the clusters. We choose the FIG. 1. Comparison of ͑a͒ LMTO DOS, ͑b͒ TB DOS, and ͑c͒ DOS of a 76.5 Å CdS nanocrystals. starting seed vector to be a particular orbital of an atom. The eigen spectrum thus obtained is composed of only those orbitals that couple with the seed vector. Thus, taking each orbital of every atom in the cluster we obtain the entire density of states. Due to the underlying symmetry in the nanocrystal we need not perform calculations for all atomic orbitals as seed vectors, but only those with distinct symmetries. The band gap for a particular sized nanocrystal is then calculated by subtracting the energy of the top of the valence band ͑TVB͒ from that of the bottom of the conduction band ͑BCB͒. However, the determinations of the TVB and the BCB become ambiguous due to the presence of dangling bonds at the surface of the nanocrystals. These nonbonded states lie in the band-gap region of the nanocrystals. These surface states need to be either selectively disposed off27 or passivated31,32 in order to remove the midgap states. Once the surface states are removed, the band gap can be easily determined. In the present work, we have passivated the surfaces of the nanocrystals in order to remove the midgap states from the calculations. III. RESULTS AND DISCUSSION The various steps involved in the calculations for the variation of the band gap with size are quite similar for the different A IIB VI compounds studied here. We therefore use the case of CdS as an example to illustrate all the steps and various considerations, prior to presenting comprehensive results for all the systems together at the end. Figure 1͑a͒ shows the first-principle results for the density of states ͑DOS͒ for CdS bulk obtained from the linearized muffin-tin orbital ͑LMTO͒ method with the atomic sphere approximation ͑ASA͒. It should be noted that the parameters appearing in the TB Hamiltonian ͓Eq. ͑2͔͒ were determined35 by a least-squared-error approach in order to obtain dispersions at high-symmetry points and a few other k points along the symmetry directions in the Brillouin zone. Since we are eventually interested in the density of states which involves an integration over the entire momentum space, we have explicitly verified in each case that the DOS calculated within the TB approach is very similar to the one obtained from the LMTO-ASA method. We illustrate this point with the help of DOS calculated within the TB model for CdS with parameter strengths from Ref. 35; this TB DOS is shown in Fig. 1͑b͒ with the same energy scale as in Fig. 1͑a͒. We note an excellent agreement of the TB DOS with the LMTO DOS over the entire range of the energy considered. While the electronic structure of small sized nanocrystals is known to be pronouncedly dependent on the size, larger sized nanocrystals are expected to resemble the bulk in terms of their electronic structures; evidently in the limit of the large size, the electronic structure of the nanocrystal must smoothly evolve into that of the bulk. It is known that the quantum confinement effect is generally small for a nanocrystal with typical size larger than the excitonic radius. The excitonic diameter of CdS is about 58 Å. 39 We consider a CdS cluster of 76 Å containing 9527 atoms that is considerably larger than the excitonic diameter. In Fig. 1͑c͒ we show the DOS for this large CdS cluster. The DOS of the nanocrystal indeed resembles the bulk DOS closely, as is evident in Fig. 1, apart from the discrete nature of the DOS arising from the finite size of the nanocrystallite system. As discussed in the preceding section, the dangling orbitals on the surface atoms appear within the band-gap region, complicating the identification of the band gap. Figure 2͑a͒ shows the normally obtained DOS for a 46 Å CdS nanocrystal; the corresponding inset shows an expanded view of the band-gap region. As one can clearly see in the expanded view, there are many states spread out over an energy range appearing between the valence band and the conduction band due to the aforementioned dangling bonds within the bandgap region. As already discussed, different authors approached the problem of dangling bonds or its removal from the DOS in different ways. For example, Lippens and Lannoo27 got rid of the dangling bonds by removing the unconnected orbitals on the surface atoms in order to obtain the band gap free of the midgap states. In spirit, this approach is similar to the infinite potential barrier on the surface of the nanocrystal assumed in the infinite potential EMA. Akin to the finite potential EMA, we choose to passivate the surface with a layer of atoms, whose electronic parameters are so chosen that the hopping interactions between the surface atoms and the passivating atoms are stronger compared to those in the bulk of the nanocrystal. Specifically, we choose only the s orbital basis on the passivating atoms with the tight-binding hopping parameters about two to three times larger than that of A-B interactions. The corresponding DOS of the passivated nanocrystals of CdS is shown in Fig. 2͑b͒. In the main frame of the figures, the unpassivated case in the upper panel and the passivated case in the lower panel appear almost identical, suggesting that the intrinsic electronic structure of the nanocrystals remains largely unaffected by the passivation. In order to illustrate FIG. 2. The DOS for 46 Å ͑a͒ unpassivated and ͑b͒ passivated CdS nanocrystals. The inset shows the expanded region encompassing the top of the valence band and the bottom of the conduction band, showing the removal of the midgap states when the nanocrystal is passivated. the effect of passivation on the midgap states, we show an expanded view of the band-gap region between the TVB and the BCB in the inset to Fig. 2͑b͒. This inset shows that the surface passivation is indeed effective in removing the midgap states, present in the inset to Fig. 2͑a͒, illustrating the unpassivated case. Most often, the total band-gap variation as a function of the size of the nanocrystal is reported in the literature.40 This is primarily motivated by the fact that this quantity ⌬E g is easily determined by experimental UV-visible absorption spectroscopy, which is a routine characterization tool. However, it is to be noted that the total change in the band gap of any material is simultaneously contributed by shifts of the valence and the conduction-band edges away from each other. In general, the shift of the top of the valence band is not the same as that of the bottom of the conduction band. Moreover, there are recent studies, though few in number41– 44 that report the individual shifts in TVB and BCB as a function of the size employing various forms of high-energy spectroscopies, such as the photoemission and the x-ray absorption spectroscopies. Thus, it is desirable to compute these shifts of the individual band edges with the size of the nanocrystallite. The variation of TVB ͑circles͒ and the BCB ͑squares͒ with respect to the bulk values are calculated for different sized passivated nanocrystals and shown in Fig. 3. As expected, the shifts of the band edges decrease smoothly to zero for large sized nanocrystals in every case. We find that the shift in the BCB is in general much larger compared to the shift in the TVB for any given size of the nanocrystal; this indicates that the shifts in the PHYSICAL REVIEW B 69, 125304 ͑2004͒ EVOLUTION OF THE ELECTRONIC STRUCTURE WITH . . . TABLE II. The values of the parameters a and b used in Eq. ͑4͒ for all the A IIB VI semiconductors studied. ae be ah bh ZnS ZnSe ZnTe CdS CdSe CdTe 15.72 1.01 Ϫ14.93 1.18 13.71 0.91 Ϫ13.31 1.15 8.23 0.65 Ϫ20.47 1.13 24.47 1.05 Ϫ7.76 1.27 24.43 1.05 Ϫ19.49 1.19 16.38 0.92 Ϫ19.03 1.13 EMA-like d Ϫ2 dependence and instead the best exponent for d is in the range of 1.13–1.27 for TVB and 0.65–1.05 for BCB, as shown in Table II. Figure 4 shows the variation of the shift in the band gap (⌬E g ) for the A IIB VI semiconductor nanocrystals with A ϭZn, Cd and BϭS, Se, and Te as a function of the nanocrystal size. ⌬E g is calculated in the present model after subtracting the Coulomb term ͓third term of Eq. ͑1͔͒ from the calculated difference between the TVB and the BCB to account for the excitonic binding energy, since the experimental data obtained from the UV absorption include the FIG. 3. The variation of the TVB and the BCB with size for II-VI nanocrystals. total band gap as a function of the nanocrystal size are always dominated by the shifts of the conduction-band edge in these systems. A larger shift for the BCB is indeed expected in view of the fact that the band-edge shifts are related inversely to the corresponding effective masses ͓see Eq. ͑1͔͒ and the effective mass of the electron is always much smaller than that of the hole in these II-VI semiconductors. For example, m * e and m * h in CdS are 0.18 and 0.53, respectively. In the spirit of EMA, one can attempt to describe the shifts in the conduction and valence-band edges, as ϭ ⌬E edge i ai d bi , ͑4͒ where ⌬E edge is the variation in the band edge with diameter i d; iϭh for TVB and iϭe for BCB. Comparing with the EMA ͓Eq. ͑1͔͒, one expects the fitting parameter a i to be inversely proportional to the electron ͑for BCB, iϭe) or hole ͑for TVB, iϭh) effective mass and b i to equal 2. We have fitted the shifts in BCB and TVB as a function of d with Eq. ͑4͒ by varying the parameters a i and b i within a leastsquared-error approach; the resulting best fits are shown in Fig. 3 by the solid lines overlapping the calculated data points. We find that the fits are reasonable, though not very good, in most cases. More importantly, these fits suggest a gross deviation from the EMA predictions; for example, the variations in TVB and BCB shown in Fig. 3 are far from the FIG. 4. The sp 3 d 5 TB model with the cation-anion and anionanion interactions ͑Ref. 35, filled circles͒ compared with the sp 3 s * TB nearest-neighbor model ͑Ref. 45, dashed line͒ and the experimental data points: ͑a͒ ZnS: ᮀ Ref. 47, ᭝ Ref. 48, ٌ Ref. 49, छ Ref. 50, * Ref. 5; ͑b͒ ZnSe: ᮀ Ref. 51, ᭝ Ref. 52; ͑c͒ ZnTe: ᮀ Ref. 53. ͑d͒ CdS: ᭺ Ref. 4, ᭝ Ref. 54, * Ref. 55, ᮀ Ref. 56; ͑e͒ CdSe: ᮀ Ref. 57, ᭝ Ref. 58, * Ref. 59; ͑f͒ CdTe: ᮀ Ref. 60, ᭝ Ref. 61, * Ref. 62. The solid line passing through the calculated filled circles is the best fit to the calculated points obtained using Eq. ͑5͒. TABLE III. The values of the parameters a and b used in Eq. ͑5͒ for all the A IIB VI semiconductors studied. a1 b1 a2 b2 ZnS ZnSe ZnTe CdS CdSe CdTe 7.44 2.35 3.04 15.30 2.65 7.61 1.90 23.50 5.10 10.35 1.05 97.93 2.83 8.22 1.96 18.07 7.62 6.63 2.07 28.88 5.77 8.45 1.33 43.73 contribution from the excitonic binding energy. The solid line passing through the calculated data points ͑small solid circles͒ is the best fit to the calculations. The best fit is obtained by using simple exponential functions relating ⌬E g to the diameter of the nanocrystallites as ⌬E g ϭa 1 e Ϫd/b 1 ϩa 2 e Ϫd/b 2 . ͑5͒ While this expression is entirely phenomenological, it has the correct limiting behavior at large d. The advantage of such a best fit is that the ⌬E g for any given system can be readily calculated for any size of the nanocrystallites with the knowledge of the parameter values a 1 , b 1 , a 2 , and b 2 , which are tabulated in Table III for all the systems investigated here. For comparison, we also show in the same panels the results obtained from the s p 3 s * nearest-neighbor TB model ͑dashed line͒ ͑Ref. 45͒ and the results from the EMA equation ͑dotted line͒ ͑Ref. 46͒. Experimental results available in the literature are also plotted as scattered points with different symbols for comparison with the calculated results.4,5,47– 62 There is a plethora of experimental data for ZnS, CdS, CdSe, and CdTe and we see that the present approach provides a better description of the experimental data in all these cases. The case of ZnSe, where the experimental results are limited, also exhibits good agreement between the experiment and the theory. In the case of ZnTe, the present as *Also at Jawaharlal Nehru Center for Advanced Scientific Research, Bangalore and Center for Condensed Matter Theory, IISc. Electronic address: [email protected] 1 C.B. Murray, C.R. Kagan, and M.G. Bawendi, Annu. Rev. Mater. Sci. 30, 545 ͑2000͒. 2 A.P. Alivisatos, J. Phys. Chem. 100, 13 226 ͑1996͒. 3 C.B. Murray, D.J. Norris, and M.G. Bawendi, J. Am. Chem. Soc. 115, 8706 ͑1993͒. 4 T. Vossmeyer, L. Katsikas, M. Giersig, I.G. Popovic, K. Diesner, A. Chemseddine, A. Eychmuller, and H. Weller, J. Phys. Chem. 98, 7665 ͑1994͒. 5 J. Nanda, S. Sapra, D.D. Sarma, N. Chandrasekharan, and G. Hodes, Chem. Mater. 12, 1018 ͑2000͒. 6 O.I. Micic, J.R. Sprague, C.J. Curtis, K.M. Jones, and A.J. Nozik, J. Phys. Chem. 98, 4966 ͑1994͒. 7 A.A. Guzelian, U. Banin, A.V. Kadavanich, X. Peng, and A.P. Alivisatos, Appl. Phys. Lett. 69, 1432 ͑1996͒. 8 A.A. Guzelian, J.E. Bowen Katari, A.V. Kadavanich, U. Banin, K. Hamad, E. Juban, A.P. Alivisatos, R.H. Wolters, C.C. Arnold, and J.R. Heath, J. Phys. Chem. 100, 7212 ͑1996͒. 9 S.V. Gapoenko, Optical Properties of Semiconductor Nanocrys- well as the earlier calculations give almost similar descriptions; unfortunately, the experimental data are limited and there are large uncertainties in the data, so it is difficult to compare the experimental results with our calculations. For most of the cases, the sp 3 d 5 model with the next-nearestneighbor interactions is in better agreement with the experiments compared to the nearest-neighbor-only sp 3 s * model. This is due to the fact that the sole s * orbital does not account well for the unoccupied states. These can only be described by the inclusion of the empty anionic d orbitals and the anion-anion interactions which are of significance in the description of the bulk electronic structure.35 IV. CONCLUSIONS We have calculated the electronic structure as a function of the nanocrystallite size for A IIB VI semiconductors with AϭZn and Cd, and BϭS, Se, and Te, using the tight-binding method with the sp 3 d 5 orbital basis set including the A-B and B-B interactions. It is shown that the shift in the top of the valence band as well as that in the bottom of the conduction band are different from the predictions based on the effective mass approximation, not only in quantitative terms, but also qualitatively. The calculated variations in the band gaps over a wide range of sizes are compared with all experimental data published so far in the literature. This comparison shows a very good agreement in every case, suggesting the reliability and the predictive ability of the present approach. ACKNOWLEDGMENTS The authors thank O. K. Andersen and O. Jepsen for the codes and P. Mahadevan for providing unpublished ab initio results for ϳ16 Å CdS nanocrystals. We acknowledge financial support from the Department of Science and Technology, Government of India. LMTO tals ͑Cambridge University Press, Cambridge, UK, 1998͒. U. Woggon, Optical Properties of Semiconductor Quantum Dots ͑Springer-Verlag, Berlin, 1997͒. 11 M.A. Kastner, Phys. Today 46 ͑1͒, 24 ͑1993͒. 12 A.P. Alivisatos, Science 271, 933 ͑1996͒. 13 L.E. Brus, J. Phys. Chem. Solids 59, 459 ͑1998͒. 14 L.E. Brus, J. Phys. Chem. 90, 2555 ͑1986͒. 15 B.O. Dabbousi, J. Rodriguez-Viejo, F.V. Mikulec, J.R. Heine, H. Mattoussi, R. Ober, K.F. Jensen, and M.G. Bawendi, J. Phys. Chem. B 101, 9463 ͑1997͒. 16 Al.L. Efros and A.L. Efros, Sov. Phys. Semicond. 16, 772 ͑1982͒. 17 L.E. Brus, J. Chem. Phys. 80, 4403 ͑1984͒. 18 Y. Kayamma, Solid State Commun. 59, 405 ͑1986͒. 19 H.M. Shmidt and H. Weller, Chem. Phys. Lett. 129, 615 ͑1986͒. 20 S.V. Nair, S. Sinha, and K.C. Rustagi, Phys. Rev. B 35, 4098 ͑1987͒. 21 Y. Kayanuma and H. Momiji, Phys. Rev. B 41, 10 261 ͑1990͒. 22 G.T. Einevoll, Phys. Rev. B 45, 3410 ͑1992͒. 23 S.V. Nair, L.M. Ramaniah, and K.C. Rustagi, Phys. Rev. B 45, 5969 ͑1992͒. 24 M.V. Rama Krishna and R.A. Friesner, Phys. Rev. Lett. 67, 629 ͑1991͒. 10 L.W. Wang and A. Zunger, Phys. Rev. B 51, 17 398 ͑1995͒. H. Fu and A. Zunger, Phys. Rev. B 55, 1642 ͑1997͒. 27 P.E. Lippens and M. Lannoo, Phys. Rev. B 39, 10 935 ͑1989͒. 28 K. Leung, S. Pokrant, and K.B. Whaley, Phys. Rev. B 57, 12 291 ͑1998͒. 29 J. Perez-Conde and A.K. Bhattacharjee, Phys. Rev. B 63, 245318 ͑2001͒. 30 S. Sapra, R. Viswanatha, and D.D. Sarma, J. Phys. D 36, 1595 ͑2003͒. 31 N.A. Hill and K.B. Whaley, J. Chem. Phys. 99, 3707 ͑1993͒. 32 N.A. Hill and K.B. Whaley, J. Chem. Phys. 100, 2831 ͑1994͒. 33 S. Sapra, D.D. Sarma, S. Sanvito, and N.A. Hill, Nano Lett. 2, 605 ͑2002͒. 34 G. Allan, Y.M. Niquet, and C. Delerue, Appl. Phys. Lett. 77, 639 ͑2000͒. 35 S. Sapra, N. Shanthi, and D.D. Sarma, Phys. Rev. B 66, 205202 ͑2002͒. 36 P. Vogl, H.P. Hjalmarson, and J.D. Dow, J. Phys. Chem. Solids 44, 365 ͑1983͒. 37 P. Mahadevan ͑unpublished͒. 38 E. Dagotto, Rev. Mod. Phys. 66, 763 ͑1994͒. 39 A.D. Yoffe, Adv. Phys. 42, 173 ͑1993͒. 40 For example, see the references listed for the experimental data points in Fig. 4. 41 V.L. Colvin, A.P. Alivisatos, and J.G. Tobin, Phys. Rev. Lett. 66, 2786 ͑1991͒. 42 J. Lu¨ning, J. Rockenberger, S. Eisebitt, J.-E. Rubensson, A. Karl, A. Kornowski, H. Weller, and W. Eberhardt, Solid State Commun. 112, 5 ͑1999͒. 43 T. van Buuren, L.N. Dinh, L.L. Chase, W.J. Siekhaus, and L.J. Terminello, Phys. Rev. Lett. 80, 3803 ͑1998͒. 44 J. Nanda, Ph.D. Thesis, Indian Institute of Science, 2000. P.E. Lippens and M. Lannoo, Mater. Sci. Eng., B B9, 485 ͑1991͒. The values for effective masses and dielectric constant were taken from Data in Science and Technology: Semiconductors Other than Group IV Elements and III-V Compounds, edited by O. Madelung ͑Springer-Verlag, Berlin, Heidelberg, 1992͒. 47 Y. Nakaoka and Y. Nosaka, Langmuir 13, 708 ͑1997͒. 48 R. Rossetti, R. Hull, J.M. Gibson, and L.E. Brus, J. Chem. Phys. 82, 552 ͑1985͒. 49 H. Inoue, N. Ichiroku, T. Torimoto, T. Sakata, H. Mori, and H. Yoneyama, Langmuir 10, 4517 ͑1994͒. 50 S. Yanagida, T. Yoshiya, T. Shiragami, and C. Pac, J. Phys. Chem. 94, 3104 ͑1990͒. 51 F.T. Quinlan, J. Kuther, W. Tremel, W. Knoll, S. Risbud, and P. Stroeve, Langmuir 16, 4049 ͑2000͒. 52 M.A. Hines and P. Guyot-Sionnest, J. Phys. Chem. B 102, 3655 ͑1998͒. 53 Y.-W. Jun, C.-S. Choi, and J. Cheon, Chem. Commun. ͑Cambridge͒ 2001, 101 ͑2001͒. 54 Y. Wang and N. Herron, Phys. Rev. B 42, 7253 ͑1990͒. 55 T. Torimoto, H. Kontani, Y. Shibutani, S. Kuwabata, T. Sakata, H. Mori, and H. Yoneyama, J. Phys. Chem. B 105, 6838 ͑2001͒. 56 J. Nanda, B.A. Kuruvilla, and D.D. Sarma, Phys. Rev. B 59, 7473 ͑1999͒. 57 B.O. Dabbousi, C.B. Murray, M.F. Rubner, and M.G. Bawendi, Chem. Mater. 6, 216 ͑1994͒. 58 A.L. Rogach, A. Kornowski, M. Gao, A. Eychmuller, and H. Weller, J. Phys. Chem. B 103, 3065 ͑1999͒. 59 S. Gorer and G. Hodes, J. Phys. Chem. 98, 5338 ͑1994͒. 60 Y. Mastai and G. Hodes, J. Phys. Chem. B 101, 2685 ͑1997͒. 61 Y. Masumoto and K. Sonobe, Phys. Rev. B 56, 9734 ͑1997͒. 62 H. Arizpe-Chrez, R. Ramrez-Bon, F.J. Espinoza-Betrn, O. ZelayaAngel, J.L. Marn, and R. Riera, J. Phys. Chem. Solids 61, 511 ͑2000͒. 25 45 26 46


© Copyright 2026