
Mode synthesizing atomic force microscopy for 3D
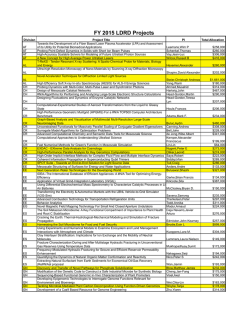
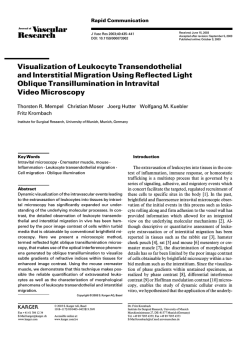
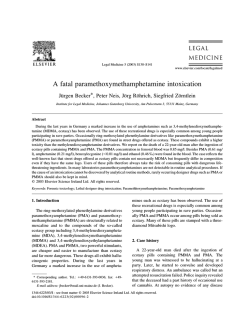
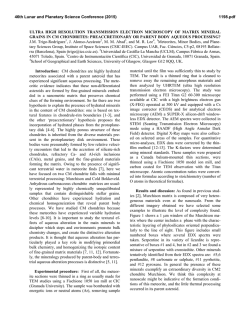
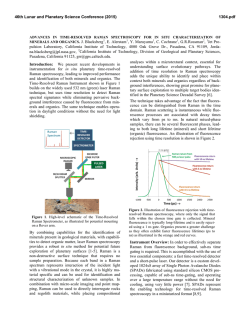
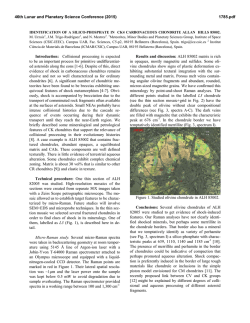
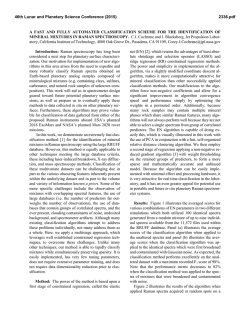
Nano Research Nano Res DOI 10.1007/s12274-015-0728-8 Mode synthesizing atomic force microscopy for 3D reconstruction of embedded low density dielectric nanostructures Pauline Vitry, 1 Eric Bourillot1 ( ), Cédric Plassard 1, Yvon Lacroute 1, Eric Calkins2,3 ,Laurene Tetard2,3 and Eric Lesniewska1 Nano Res., Just Accepted Manuscript • DOI 10.1007/s12274-015-0728-8 http://www.thenanoresearch.com on January 28, 2015 © Tsinghua University Press 2015 Just Accepted This is a “Just Accepted” manuscript, which has been examined by the peer-review process and has been accepted for publication. A “Just Accepted” manuscript is published online shortly after its acceptance, which is prior to technical editing and formatting and author proofing. Tsinghua University Press (TUP) provides “Just Accepted” as an optional and free service which allows authors to make their results available to the research community as soon as possible after acceptance. After a manuscript has been technically edited and formatted, it will be removed from the “Just Accepted” Web site and published as an ASAP article. Please note that technical editing may introduce minor changes to the manuscript text and/or graphics which may affect the content, and all legal disclaimers that apply to the journal pertain. In no event shall TUP be held responsible for errors or consequences arising from the use of any information contained in these “Just Accepted” manuscripts. To cite this manuscript please use its Digital Object Identifier (DOI®), which is identical for all formats of publication. 1 Three-dimensional reconstruction of low-density dielectric nanostructures by Mode Synthesizing Atomic Force Microscopy Pauline Vitry,a Eric Bourillot*,a , Cédric Plassard a, Yvon Lacroute a, Eric Calkinsb,c, Laurène Tétardb,c and Eric Lesniewskaa a “University of Bourgogne 9 Avenue Alain Savary UMR CNRS 6303, 21078 Dijon Cedex, France” b “ Nanoscience Technology Center, University of Central 1 –2-sentence summary of the paper. The font is Times New Roman 9 Florida, Orlando, FL 32826, USA” c “ Department of Physics, University of Central Florida, Orlando, FL 32826, USA” Laurène Tetard, http://www.nanoscience.ucf.edu/faculty/tetard.php Nano Research DOI (automatically inserted by the publisher) Review Article/Research Article Please choose one Mode Synthesizing Atomic Force Microscopy for 3D reconstruction of embedded low density dielectric nanostructures Pauline Vitry, 1 Eric Bourillot1 ( ), Cédric Plassard 1, Yvon Lacroute 1, Eric Calkins2,3 ,Laurene Tetard2,3 and Eric Lesniewska1 Received: day month year ABSTRACT Revised: day month year Outstanding challenges in nanoscale characterization call for non-invasive, yet Accepted: day month year sensitive subsurface characterization of low-density materials such as polymers. (automatically inserted by the publisher) © Tsinghua University Press In this work, we present new evidence that Mode Synthesizing Atomic Force Microscopy can be tuned to detect minute changes in low-density materials such as the ones engendered in an electro-sensitive polymer during electron and Springer-Verlag Berlin beam lithography, surpassing all common nanoscale mechanical techniques. Heidelberg 2014 Moreover we propose a 3D reconstruction of the exposed polymer regions using successive high-resolution frames acquired at incremental depth inside KEYWORDS the sample. In addition, the results clearly show the influence of increasing Nanoscale subsurface imaging, Atomic Force Microscopy, 3D reconstruction, Nanoscale tomography, Acoustic Microscopy, Dielectric dwell time on the depth profile of the nano-sized exposed regions. Hence the simple approach described here can be considered an unprecedented capability for sensitive nanoscale tomography of soft materials with promising applications in material sciences, and biology. 1. Introduction A growing need in nanometrology is the development of technologies to detect and characterize deeply buried features with lateral resolution below 100 nm. Recent developments of non-invasive platforms for nanoscale characterization based on multi-frequency Atomic Force Microscope (AFM) indicate great promise and broader impact in micro-electronics, material sciences, biopolymers and soft matter, as well as biological systems[1-9]. The majority of such techniques, implemented as first developments of high resolution subsurface probing, are based on the beating and mixing of the multi-frequency mechanical excitation of the system, coupled via the nonlinear interaction between the sample and the AFM cantilever tip [10-13]. Specifically, Mode Synthetizing AFM (MSAFM), depicted in Figure 1, is based on nonlinear mixing of multiple frequencies at the tip-sample contact [14, 15]. Previous reports have shown that one could obtain images of buried defects with high resolution, although comprehensive calibration of the method for volumetric characterization of materials is still lacking [6-8]. In addition, the interpretation of the results obtained with the multi-frequency apparatus proves to be quite challenging, in particular for dielectric samples with low-density differences [17-19]. In this article, we designed and studied calibration samples with series of low-density variations patterns in the volume of an electro sensitive polymer poly-(methyl methacrylate) (PMMA) layer using various doses and dwell time parameters of controlled electron beam lithography (EBL). PMMA is routinely used in EBL as a sacrificial layer for positive resist in direct write process. During e-beam exposure, the primary electrons entering the resist layer lose energy by means of inelastic scattering or collisions with other electrons and produce secondary electrons. The resulting electron cascade can engender a non-uniform spread of the energy deposition. The aim of this study is to track how electron-matter interactions modify the conformation of the material in the depth of the PMMA layer (i.e. below the surface). First, we show that, compared to AFM Peak Force Quantitative NanoMechanical property mapping (QNM), Lateral Force Microscopy (LFM) and confocal Raman spectroscopy, MSAFM exhibits a combination of higher sensitivity and improved depth resolution. Secondly, we consider the influence of parameters such as driving frequency and scan rate on the image contrast, and evaluate their impact on resolution and on sensitivity of the subsurface components of the MSAFM measurements. The study highlights the potential of MSAFM for sensitive differentiation of materials presenting similar elastic properties, which is of prime interest in material sciences and biology [19-22]. 2. Experimental section 2.1. AFM and Cantilever probes: For all experiments silicon nitride cantilevers (DNP-S, Bruker, k=0.12N/m), with an estimated contact radius of 30±10 nm determined by Scanning Electron Microscopy (SEM Jeol 6500), were used. The profiles of the nanoholes were acquired and plotted using the AFM cross-section data analysis tool. Peak Force QNM and Lateral Force Microscopy: The Peak Force QNM and Lateral Force Microscopy studies were performed on a Multimode AFM (Bruker), with Nanoscope IV controller. Lateral force microscopy (LFM) consists in measuring the torsional bending of the AFM cantilever engaged in contact mode. Torsional bending of the cantilever is related to the friction force acting on the tip. This mode is sensitive to mechanical and chemical properties of the material near the surface, underneath the tip of the cantilever. Peak Force Quantitative Nanomechanical Property Mapping (QNM), on the other hand, is based on PeakForce Tapping mode, which records a force curve at every point (pixel) of the image. This mode allows extracting the Young modulus of the sample, with simultaneous topography reconstruction. Force curve modeling for Young modulus extraction: Derjaguin, Muller, Toropov (DMT) is a standard model used to fit tip-sample force curves in Peak Force QNM [22, 23]. The retract part of the force Address correspondence to First A. Firstauthor, email1; Third C. Thirdauthor, email2 3 Nano Res. curve, when the cantilever-sample distance increases, is fitted using the DMT model, and the result of the fit corresponds to the reduced modulus E* calculated by: 𝐹𝑡𝑖𝑝 − 𝐹𝑎𝑑ℎ = 4 3 𝐸 ∗ √𝑅 (𝑑 − 𝑑0 ) 3 (1) where 𝐹𝑡𝑖𝑝 is the force with which the tip is pressed on the surface, 𝐹𝑎𝑑ℎ the adhesive force between the AFM tip and the sample and 𝑑 − 𝑑0 the sample deformation and R is the tip radius. 2.2. Raman spectroscopy mapping: Raman mappings of the calibration samples were obtained on WITec alpha300 RA under ambient conditions with excitation wavelength of 532 nm. The spectra were collected with a 100x objective and acquisition time of 0.1s with about 10 points per micrometer. The depth profiles were collected by performing XZ scans along the center axis (diameter) of the exposed regions. 2.3. Subsurface imaging: Figure 1 : MSAFM experimental setup. The cantilever and the sample are mechanically actuated by PZT at their bases connected to respective waveform generators. The frequency mixer is used to select the reference frequency of the lockin amplifier for amplitude and phase measurements corresponding to f. The phase signal is then displayed by the microscope by connecting the output of the lockin to the auxiliary channel (Aux C) of the Signal Access Module of the AFM controller. MSAFM measurements were performed after engaging the tip in contact mode on a Multimode AFM (Nanoscope IIIA controller, Bruker) (Fig.1), which was modified to host the piezoelectric crystals (PZT, Physik Instrument) required for multi-frequency mechanical actuation with driving frequencies above 1 MHz. The silicon nitride cantilever and the sample were glued to their respective piezoelectric crystals (selected with resonance around 4 MHz, which is considered harmless to the sample and users). Two ultrasound plane waves with frequencies between 3.0 and 5.0 MHz for both the probe (fp) and the sample (fs) were generated using two waveform generators (Agilent 33220A) connected to the respective piezoelectric crystals. The amplitude (R) and phase (ф) of frequency difference Δf = |fp-fs|, synthesized as a result of the nonlinear tip-sample interaction, were monitored via a lock-in amplifier (Lock-In Amplifier SRS 844, Stanford Research) using the detector signal S(t) as an input and the Δf as reference using an adequate frequency mixer (Fig.1). 2.4. Sample preparation: Sets of calibration samples were produced by depositing a 300 nm-thick layer of the electrosensitive polymer poly-(methyl methacrylate (PMMA) on silicon (Fig. 2(a), left). The resin was then treated using electron beam lithography (EBL) to obtain 100x100 µ m matrices of disks with doses ranging from 2.5 to 8.0 (Fig. 2(b)). EBL was performed on a JEOL 6500 scanning electron microscope (SEM). A schematic of the samples and resulting AFM cross sections are presented in Fig.2 (a) and (c), respectively. The following parameters were then selected for the EBL process: 1) step size corresponding to the distance between two exposure points (defined in pixel) by the electron beam was adjusted in accordance with the structures for a given acceleration voltage current of the electron beam on the sample, and 2) dwell time for exposure time per pixel was defined for each step of the electron beam. The dose corresponds to the exposure time coefficient that can be locally applied on part of the pattern in order to control the proximity effects and thus the size of exposed features. For instance, dose 1.0 is obtained with a step size equal to 20 nm, a dwell time of 0.017 ms, an acceleration voltage of 10 kV and a current of 20 pA. Hence, the dose is directly proportional to the dwell time: dose a = a x 0.017 ms. 3. Results and discussions The nanofabricated structures (Figure 2a) were first characterized by AFM (Figure 2b). From the profiles of the nanoholes (Figure 2c) it can clearly be seen that the depth of the structures and their lateral sizes vary with the dwell time and the dose. Under e-beam exposure, the main PMMA polymer chain undergoes scission. As a result, a change in the molecular mass of the PMMA is expected in the patterns of exposed dots, inducing a reduction of the space volume occupied by the polymer. This exposure induces www.theNanoResearch.com∣www.Springer.com/journal/12274 | Nano Research 4 topographical modifications as can be seen from the change is thickness of the treated region. Moreover, due to electrons forward and back scattering, the resulting shape of the nanostructures modified by the electron beam display a classical inverse V-shaped profile (Fig. 2(c)). Next, we characterized the same region using MSAFM with varying Δf. The resulting maps are presented in Figure 3 (a-c). During the MSAFM measurements, we found that a good synchronization of the scan rate increased the image quality. Although the scan rate did not influence the width of the exposed areas measured on each MSAFM frame, the optimization of the signals led to sharper amplitude and phase maps. Accordingly, we acquired the data with 4 Hz scan rate. By direct comparison of the MSAFM images obtained (Figure 3), a clear variation in the phase signal between the treated and non-treated PMMA can be observed. In addition, the diameter of the structures exhibited significant changes with increasing Δf. In the matrices exposed at doses varying from 2.5 to 3.5 (Figure 3(e,f)), the diameter of the dot exposed with dose 3.0 (middle dot) varied from 3.0 µm when probed with Δf = 50 kHz (Figure 3 (e)) to 3.3µ m when imaged with Δf = 110 kHz (Figure 3(f)). Overall, the minimum size was found for D2.5 at Δf = 50 kHz while the largest was found for D3.5 at Δf = 110 kHz (Figure 3(d)). In the series of patterns with dot exposed at higher doses (Figure 2(b)), the diameter of D7.0 varied from 4.1µ m at Δf = 50 kHz to 4.7µm at Δf = 140 kHz. The smallest observed structures were found with Δf = 50 kHz Figure 2 : PMMA/Exposed PMMA patterned calibration sample. Nano Res. of the D5.0 dots, while the largest diameters were found for D9.0 at Δf = 140 kHz (Figure 3(c, g)). It was necessary to increase ∆f to 140 kHz to probe the bottom of the structure, suggesting larger volume of modified PMMA with higher doses. To better understand the nature of the local polymer conformation change induced by electron-matter interaction and related MSAFM image formation mechanisms, we performed Peak Force QNM, Lateral Force Microscopy (LFM) and Raman spectroscopy on the same regions of the sample. After Peak Force QNM mapping, we extracted the reduced Young modulus E* across the sample using the DMT-based model (see methods), which is an accepted model for standard AFM-based measure of E in materials. Peak Force QNM measurements did not reveal significant variations of the Young modulus (Fig. 4(a)), showing no differences inside and out of the dots: this proves that the nature of materials has not been modified and that polymer remains inside the dots. This absence of change in the Young modulus between the exposed and the non-exposed polymer suggests that the variations measured by MSAFM are not caused by a change in modulus of the material. As the speed of the ultrasonic waves depends on the propagation medium and varies with the material, the wave speed expression is defined as the ratio of the bulk modulus K related to the stiffness of the medium and its resistance to being compressed over the density (ρ) of the medium: 𝐾 𝑣 = √ , with 𝐾 = 𝜌 | www.editorialmanager.com/nare/default.asp PMMA dots resulting from e-beam treatment. (c) AFM labeled in (b). 𝐸 3 (1−2𝑣) (2) and 𝑣 the Poisson coefficient (between 0.4 and 0.43 for the PMMA). With a constant modulus E, an increased propagation velocity in the e-beam exposed PMMA can be caused by a decrease in density ρ. This would agree with a higher acoustic response, as the one observed in the MSAFM map. Thus we infer that the changes observed in Figure 3 are related to the difference of density ρ resulting from EBL on PMMA, which is also coherent with a smaller molecular weight of the irradiated polymer compared to that of the unexposed polymer. Further, we acquired LFM maps of the same region of the sample. LFM is commonly used to detect changes in chemical composition or viscosity changes in materials. As can be seen in Figure 4(b), no contrast could be observed on the LFM images acquired on the calibration samples, except at a higher dose (D3.5), which may be due to topographical (a) Nanofabrication process. (b) AFM images of the exposed cross-sections realized for lines across dots of different doses, as 1 5 Nano Res. variations inducing a peripheral friction response. Hence, the results confirm that EBL exposure of PMMA does not affect the viscosity and likely does not modify the chemical composition of the thin layer. However, while the Peak Force QNM and LFM can provide some insight on the properties of the sample surface, they cannot access depth information. Thus, to investigate the volume properties of the exposed PMMA film, we acquired Raman depth profile across the dots of the matrix (Figure 4c). A comparison of the individual Raman spectra in the exposed and non-exposed regions confirms that PMMA chains are preserved after e-beam treatment. However, the exposed regions exhibit a lower signal in the map, in good agreement with the idea of the lower density of the treated material. Thus, MSAFM complemented of Peak Force QNM, LFM and Raman data demonstrate and confirm that density in the only parameter changing in the sample. We explored the Raman signal further to obtain some information on the in-depth profile of the exposed regions. K-means analysis on the Raman data sets revealed a low-resolution profile of the depth cross section of the exposed dots (Figure 4(d)). Although with poor spatial resolution, the slight enlargement observed is in agreement with the expected profile of an electro-sensitive resin by EBL. Therefore the changes in diameter of the exposed dots resolved with MSAFM show that the technique is sensitive to depth information and can probe the volume information of the sample. By extracting the changes in volume density from each MSAFM map and representing it as a function of driving frequencies and difference frequency Δf, we propose a simple procedure for the 3D reconstruction of the sample [24]. In short, by considering the attenuation resulting from the acoustic waves (launched by the mechanical actuators located at the base of the cantilever and below the sample) propagation through the medium, attenuation amplitude (𝑧) of the mixed waved Δf resulting from the nonlinear tip-sample interaction can be formulated: Figure 3 : MSAFM characterization of the calibration samples. (a-c) MSAFM images for high doses (D5.0-D9.0) acquired at (a) Δf = 50kHz, (b) Δf = 80kHz, and (c) Δf = 140kHz. (d) Evolution of exposed PMMA dots diameters as a function of frequency Δf for doses D2.5 and D3.5. (e,f) MFAFM images for lower doses (D2.5-D3.5) acquired at (e) Δf = 50kHz, and (f) Δf = 110kHz. (g) Figure 4 : Calibration sample characterization by Peak Force QNM (a), Lateral Force Microscopy (b) spectroscopy (c) including Raman XZ and Raman mapping and corresponding k-means analysis. Relationship between dot diameter and Δf frequency for doses D5.0 and D7.0. www.theNanoResearch.com∣www.Springer.com/journal/12274 | Nano Research 6 Nano Res. 𝐴(𝑧) = 𝐴0 𝑒 |𝛼𝑝− 𝛼𝑠|𝑧 ) 𝑣 −( (3) with αi (i=s,p) = αi(f) the attenuation coefficients (depending of frequency f) of the probe and the sample, z the investigation depth, and v the velocity of the ultrasonic wave. By calculating the minimum of attenuation for each combination of Δf in MSAFM, it is then possible to link the actuation frequencies and their difference with the investigation depth. Experimentally, the changes in diameter are extracted for the sequence of MSAFM images obtained at each Δf. By assigning an investigation depth (obtained with the simple numerical model) to each Δf, it is then possible to reconstruct the three-dimensional profile of the exposed region inside the PMMA film. The resulting reconstruction, acquired with ten successive MSAFM frames, is presented in Figure 5 (right). The 3D reconstruction of the sample is in good agreement with the expected plum shape of exposed PMMA region below the surface. changes is especially important in biology. Indeed, it is a central in the behavior of dynamic entities in intracellular organisms and conformational changes in response to various external agents such as chemical stress, thermal ...). Consequently, our results highlight the great potential of MSAFM for ground-breaking discoveries in soft matter and life sciences. Acknowledgements We acknowledge the financial support of Region Bourgogne Council, Institute Carnot ARTS and Labex Action Integrated Smart System programs. References [1] Garcia, R., & Herruzo, E. T. The emergence of multifrequency force microscopy. Nature nanotechnology, 2012, 7(4), 217-226. [2] Plassard, C., Bourillot, E., Rossignol, J., Lacroute, Y., Lepleux, E., Pacheco, L., & Lesniewska, E. Detection of defects buried in metallic samples by scanning microwave microscopy. Physical Review B, 2011, 83(12), 121409. [3] Cuberes, M. T. Intermittent-contact heterodyne force microscopy. Journal of Nanomaterials, 2009, 2009, 8. [4] Shekhawat, G. S., & Dravid, V. P. Nanoscale imaging of buried structures via scanning near-field ultrasound Figure 5: 3D reconstruction of subsurface structure and composition holography. Science, 2005, 310(5745), 89-92. of the PMMA/exposed PMMA calibration samples obtained [5] Shekhawat, G. S., Avasthy, S., Srivastava, A. K., Tark, S. by extracting the diameter for a ten successive MSAFM phase H., & Dravid, V. P. Probing buried defects in extreme image. ultraviolet multilayer blanks using ultrasound holography. Nanotechnology, IEEE Transactions on, 2010, 9(6), 671-674. 4. Conclusion [6] Tetard, L., Passian, A., Venmar, K. T., Lynch, R. M., Voy, MSAFM is well adapted for the characterization of low-density material and offers the possibility to create a 3D reconstruction of the device undergoing testing. Its sensitivity was compared to three standard characterization techniques Peak Force QNM, LFM and Raman Confocal microscopy. Our study shows that MSAFM offers the best sensitivity and spatial resolution in presence of low-density variations. In addition, different parameters such as frequencies and scan rate have been found to play a significant role in the quality of the acoustic picture. The ability to image complex systems with low-density B. H., Shekhawat, G., & Thundat, T. Imaging nanoparticles in cells by nanomechanical holography. Nature nanotechnology, 2008, 3(8), 501-505. [7] Ewald, M., Tetard, L., Elie-Caille, C., Nicod, L., Passian, A., Bourillot, E., & Lesniewska, E. From surface to intracellular non-invasive nanoscale study of living cells impairments. Nanotechnology, 2014, 25(29), 295101. [8] Burnham, N. A., Kulik, A. J., Gremaud, G., Gallo, P. J., & Oulevey, F. Scanning local‐acceleration microscopy. Journal of Vacuum Science & Technology B, 1996, 14(2), 794-799. | www.editorialmanager.com/nare/default.asp 7 Nano Res. [9] Fukuma, T., Kobayashi, K., Matsushige, K., & Yamada, Physica E: Low-dimensional Systems and Nanostructures, H. True atomic resolution in liquid by frequency-modulation 2008, 40(7), 2419-2424. atomic force microscopy. Applied Physics Letters, 2005, [18] Crozier, K. B., Yaralioglu, G. G., Degertekin, F. L., 87(3), 034101. Adams, J. D., Minne, S. C., & Quate, C. F. Thin film [10] Burnham, N. A., Kulik, A. J., Gremaud, G., Gallo, P. J., characterization by atomic force microscopy at ultrasonic & Oulevey, F. Scanning local‐acceleration microscopy. frequencies. Applied Physics Letters, 2000, 76(14), Journal of Vacuum Science & Technology B, 1996, 14(2), 1950-1952. 794-799. [19] Rose, J.L. Journal of pressure vessel technology, 2002, [11] Rabe, U., & Arnold, W. Acoustic microscopy by atomic 124(3), 273-282. force microscopy. Applied Physics Letters, 1994, 64(12), [20] Tsuji, T., & Yamanaka, K. Observation by ultrasonic 1493-1495. atomic force microscopy of reversible displacement of [12] Verbiest, G. J., Simon, J. N., Oosterkamp, T. H., & Rost, subsurface dislocations in highly oriented pyrolytic graphite. M. J. Subsurface atomic force microscopy: towards a Nanotechnology, 2001, 12(3), 301. quantitative understanding. Nanotechnology, 2012, 23(14), [21] Yamanaka, K., Ogiso, H., & Kolosov, O. Ultrasonic 145704. force microscopy for nanometer resolution subsurface [13] Kolosov, O. V., Castell, M. R., Marsh, C. D., Briggs, G. imaging. Applied Physics Letters, 1994, 64(2), 178-180. A. D., Kamins, T. I., & Williams, R. S. Imaging the elastic [22] Derjaguin, B. V., Muller, V. M., & Toporov, Y. P. Effect nanostructure of Ge islands by ultrasonic force microscopy. of contact deformations on the adhesion of particles. Journal Physical review letters, 1998, 81(5), 1046. of Colloid and interface science, 1975, 53(2), 314-326. [14] A. Passian, T. Thundat and L.Tetard, U.S. Patent [23] Vitry, P., Bourillot, E., Plassard, C., Lacroute, Y., Tetard, Application 12/726,083. L., & Lesniewska, E. Advances in quantitative nanoscale [15] Tetard, L., Passian, A., Lynch, R. M., Voy, B. H., subsurface imaging by mode-synthesizing atomic force Shekhawat, G., Dravid, V., & Thundat, T. Elastic phase microscopy. Applied Physics Letters, 2014, 105(5), 053110. response of silica nanoparticles buried in soft matter. Applied Physics Letters, 2008, 93(13), 133113. [16] Ngwa, W., Luo, W., Kamanyi, A., Fomba, K. W., & Grill, W. Characterization of polymer thin films by phase‐ sensitive acoustic microscopy and atomic force microscopy: a comparative review. Journal of microscopy, 2005, 218(3), 208-218. [17] Passeri, D., Rossi, M., Alippi, A., Bettucci, A., Terranova, M. L., Tamburri, E., & Toschi, F. Characterization of epoxy/single-walled carbon nanotubes composite samples via atomic force acoustic microscopy. www.theNanoResearch.com∣www.Springer.com/journal/12274 | Nano Research Nano Res. www.theNanoResearch.com∣www.Springer.com/journal/12274 | Nano Research


© Copyright 2026