
ES Estonia
OECD Economic Surveys
ESTONIA
January 2015
OVERVIEW
This document and any map included herein are without prejudice to the status of or sovereignty over any
territory, to the delimitation of international frontiers and boundaries and to the name of any territory, city
or area.
The statistical data for Israel are supplied by and under the responsibility of the relevant Israeli authorities.
The use of such data by the OECD is without prejudice to the status of the Golan Heights, East Jerusalem
and Israeli settlements in the West Bank under the terms of international law.
2
OECD Economic Surveys: Estonia
© OECD 2015
Executive summary
●
Main findings
●
Key recommendations
The statistical data for Israel are supplied by and under the responsibility of the relevant Israeli
authorities. The use of such data by the OECD is without prejudice to the status of the Golan Heights,
East Jerusalem and Israeli settlements in the West Bank under the terms of international law.
9
© OECD 2015
1
EXECUTIVE SUMMARY
Main findings
Estonia experienced strong growth of loan-financed domestic demand after EU accession
in 2004, followed by the burst of the real estate bubble and the international financial crisis.
The economy recovered quickly. Regulatory settings are generally favourable to sustain
growth and the government is initiating further substantial structural reforms. The fiscal
position is strong and macroprudential policies have been strengthened. However, in
recent years economic growth has slowed, in part due to weak external demand. Real GDP
per capita is still lower than in the boom peak of 2007. The productivity gap with respect to
high-income countries is currently diminishing only slowly. Skill mismatches contribute to
structural unemployment and emigration is reducing labour supply. At unchanged policies
higher income growth will tend to raise greenhouse gas emissions, which are among the
highest in the OECD in relation to GDP. Key challenges for Estonia are therefore to raise
productivity growth, including by making the most of human capital, while containing
greenhouse gas emissions.
Policies to raise productivity growth sustainably. Estonia boasts an innovative ICT
services sector and strong business creation. Nonetheless, exports are concentrated in low
and medium technological goods and FDI inflows in high value added activities have been
small. While R&D spending has risen and reforms have improved the effectiveness of
innovation policy, too few firms collaborate with research institutions. Transport
infrastructure has been upgraded, but bottlenecks are still holding back private sector
development. Corporate bankruptcy procedures are long, raising exit costs on
entrepreneurs and uncertainty for creditors.
Reducing CO2 emissions and energy consumption. Low energy efficiency contributes to
high CO2 emissions. Ambitious emission reduction targets are expected beyond 2020 in the
context of targets set by the European Union and the economy is vulnerable to rising
carbon prices in the European Union’s emission trading system. Implicit tax rates per
tonne of CO2 are low on average and vary across energy sources and uses.
Making the most of human capital. Despite measures to lower income taxes and social
security contributions, high labour taxation is holding back domestic labour utilisation.
Important examples are the high contribution rates in the compulsory private pension
scheme and generous special occupational early retirement schemes which have to be
paid for with high taxes. While substantial reforms have improved the quality of vocational
education, workplace-based upper secondary education is underdeveloped.
Using fiscal policy to raise sustained productivity growth. Government debt is very low
and the government budget has been close to balance structurally in recent years. The
government plans structurally balanced budgets or surpluses which will lead to the
accumulation of financial assets. In a small and volatile economy like Estonia’s a strong
fiscal position is prudent. At the same time a catching-up economy like Estonia has high
public spending needs to sustain productivity growth and ensure equity. There are gaps in
the provision of active labour market policies and in infrastructure as well as in continued
education and access to vocational education.
10
© OECD 2015
OECD ECONOMIC SURVEYS: ESTONIA © OECD 2015
2
EXECUTIVE SUMMARY
Key recommendations
Policies to raise productivity growth sustainably
●
To strengthen knowledge transfers to domestic firms, promote applied research and
improve collaboration with domestic and foreign institutions conducting applied
research.
●
Implement plans to expand access to European transport networks and energy supply
facilities. Improve inter-modal transport connections.
●
Shorten corporate insolvency procedures and improve their efficiency, for example by
strengthening the use of expertise.
Reducing CO2 emissions and energy consumption
●
Gradually align and raise tax rates on energy sources according to their CO2 emission
content.
●
Strengthen incentives for operators of heating networks to improve efficiency.
Strengthen incentives to invest in energy efficiency of buildings.
Making the most of human capital
●
Further reduce the taxation of labour earnings, in particular of low earnings. Raise more
revenues from the taxation of real estate by removing exemptions and by evaluating
property according to market values.
●
In the compulsory private pension system, reduce costs born by workers, in particular
marketing expenses. In the public pension system, phase out special occupational and
sectoral pension regimes.
●
Introduce a tax-free lower minimum wage for apprenticeships, improve financial
support for students in vocational education and strengthen collaboration of businesses
and schools at the local level.
Using fiscal policy to improve long-term growth prospects
●
Create budgetary room to raise spending on active labour market policies, infrastructure
and education, as well as to lower labour taxes. To this end, improve spending efficiency
and prioritisation and phase out tax exemptions, notably the deductibility of mortgage
interest payments. In the longer-term consider allowing a small deficit in the
government budget rule.
11
OECD ECONOMIC SURVEYS: ESTONIA © OECD 2015
© OECD 2015
3
© OECD 2015
4
OECD Economic Surveys: Estonia
© OECD 2015
Assessment and recommendations
●
Domestic framework conditions are favourable but reforms are needed
to accelerate convergence
●
Weakening exports have detracted from economic growth
●
Domestic financial risks are low
●
The fiscal position is strong
●
Raising productivity and benefitting more from openness
●
Reducing CO2 emissions and energy consumption
●
Making the most of human capital
13
© OECD 2015
5
ASSESSMENT AND RECOMMENDATIONS
Domestic framework conditions are favourable but reforms are needed
to accelerate convergence
The Estonian economy experienced a sharp contraction of output in the context of the
global financial crisis in 2008 and 2009, deepened by a domestic credit-based boom-bust
cycle in the construction sector and reinforced by procyclical fiscal policy (Economic
Surveys of Estonia 2011, 2012). Real GDP per capita and household incomes fell markedly
(Figure 1). In the following years, the economy recovered quickly, led by exports. The banks,
mostly owned by Scandinavian financial groups little affected by the global financial crisis,
cleaned up their balance sheets rapidly which helped restore access to credit. Private sector
indebtedness fell to sustainable levels. A very strong fiscal position also helped restore
financial market confidence. However, economic growth started slowing in 2012 mainly
due to weaker exports. Real per capita GDP and household incomes remain below the peak
of the preceding boom. Moreover, poor households have barely benefited from the postcrisis recovery since 2010.
Figure 1. GDP per capita and real household income1 by income quintile
Constant 2010 Euros
15000
Real GDP per capita
Highest quintile of income¹
Second quintile of income
Lowest quintile of income
12000
9000
6000
3000
0
2003
2004
2005
2006
2007
2008
2009
2010
2011
2012
2013
1. Equalised disposable income. Deflated with harmonised consumer price index.
Source: Statistics Estonia, Eurostat and OECD MEI Database.
1 2 http://dx.doi.org/10.1787/888933180001
The gap in labour productivity compared with the top OECD economies is large and
has narrowed only slowly (Figure 2), despite the downsizing of low-productivity
construction activity. Energy efficiency of production is among the lowest and CO 2
emissions per capita among the highest in the OECD, which calls the sustainability of GDP
growth into question. Unemployment has fallen, but skill mismatches keep structural
unemployment high. Net emigration and cross-border work have reduced labour supply.
According to OECD wellbeing indicators, Estonia lags behind with respect to subjective
life satisfaction as well as household disposable income and health indicators (Figure 3).
14
© OECD 2015
OECD ECONOMIC SURVEYS: ESTONIA © OECD 2015
6
ASSESSMENT AND RECOMMENDATIONS
Figure 2. Convergence in GDP per capita and productivity
Gap to the upper half of OECD countries¹
Per cent
-45
GDP per capita
GDP per hour worked
-50
-55
-60
-65
-70
2000
2001
2002
2003
2004
2005
2006
2007
2008
2009
2010
2011
2012
2013
1. Percentage gap with respect to the simple average of the highest 17 OECD countries in terms of GDP per capita,
GDP per hour worked (in constant 2005 PPPs).
Source: OECD National Accounts Database and OECD Productivity Databases.
1 2 http://dx.doi.org/10.1787/888933180018
Figure 3. Average well-being outcomes1, 2014
Estonia
Housing
Total OECD
1.0
Work-Life balance
Income
0.8
0.6
0.4
Safety
Jobs
0.2
0.0
-0.2
Community
Life satisfaction
Health
Education
Civic engagement
Environment
1. Each well-being dimension is measured by one to three indicators from the OECD Better life Indicator set.
Indicators are normalised to range between 1 (best) and 0 according to the following formula: (indicator valueminimum value)/(maximum value/minimum value).
Source: OECD Better Life Index Database.
1 2 http://dx.doi.org/10.1787/888933180022
15
OECD ECONOMIC SURVEYS: ESTONIA © OECD 2015
© OECD 2015
7
ASSESSMENT AND RECOMMENDATIONS
Despite improvement in recent years, life expectancy remains lower than in most OECD
countries and health spending is modest. Unhealthy life styles, in part reflecting high
alcohol and tobacco consumption, contribute to low life expectancy (Economic Survey of
Estonia 2012, OECD, 2012).
As pointed out in the 2012 Economic Survey of Estonia (OECD, 2012), framework
conditions are in many ways conducive to sustained economic expansion. Product and
labour market regulation are business-friendly and are backed up by an effective public
administration, transparent governance and efficient law enforcement. Low and simple
corporate taxation supports entrepreneurship; a solid banking sector and the strong fiscal
position support growth. According to PISA results, literacy, numeracy and science
competences among Estonian youth are among the strongest in the OECD. Numeracy and
literacy skills of the adult population are also above average (OECD, 2013d).
Further reforms are needed to improve medium-term economic growth prospects,
making the most of Estonia’s position as a small, highly open economy:
●
To raise productivity, innovation policies need to improve the transfer of knowledge to
Estonian firms. Remaining barriers to entry in some services should be removed.
Infrastructure gaps need to be closed and energy efficiency improved.
●
To raise labour utilisation, the tax and contribution system needs to become more
employment friendly. Further reforms of vocational education can help match skills
better to labour market needs.
In most of these policy areas, the Estonian government has taken substantial steps in
the right direction. These issues are discussed below.
Weakening exports have detracted from economic growth
Real GDP growth slowed to 1.6% in 2013 as exports decelerated (Figure 4). Declining
activity in Finland and Russia as well as the slow recovery in the euro area have contributed
to weaker export demand. Public infrastructure investment also declined. However, private
consumption growth was strong, fuelled by real wage gains, even though unemployment
remained above 8% in 2013. GDP growth strengthened in the first half of 2014, and
unemployment fell further, although export growth recovered little.
Skill shortages contribute to wage pressure, especially in skill-intensive sectors (Eesti
Pank, 2014a, b). More than 10% of firms report skill shortages as the most relevant factor
constraining output (Eesti Pank, 2014a). The most skilled workers have by far the lowest
unemployment rates (Figure 5). Wage growth has been particularly strong in the innovative
ICT services sector (Eesti Pank, 2014b), where vacancy rates are high and where Estonia has
developed a marked comparative advantage. Emigration mostly of young, employed
workers, has contributed substantially to falling labour supply (Figure 6), thereby also
contributing to wage pressure.
Export market performance has evolved satisfactorily over the past 10 years (Figure 7).
Market shares of Estonian gross exports appear to have grown broadly in line in central
eastern European economies (Figure 7, Panel A). Moreover, the domestic value-added
content of exports rose markedly between 2005 and 2009 (Figure 7, Panel B). However,
strong wage and subdued productivity growth have pushed up unit labour costs markedly
since 2011, weakening export competitiveness (Figure 7, Panel C). The share of firms
reporting worsening competitiveness in business surveys has also been growing
16
© OECD 2015
OECD ECONOMIC SURVEYS: ESTONIA © OECD 2015
8
ASSESSMENT AND RECOMMENDATIONS
Figure 4. Output, labour costs and consumer prices
A. Real GDP growth
Y-o-y % changes
15
EST
FIN
LVA
Euro area³
10
5
0
-5
-10
-15
-20
2007
2008
2009
2010
2011
2012
2013
2012
2013
B. Inflation and compensation growth
Y-o-y % changes
25
Hourly compensation¹
HCPI²
Core HCPI²
20
15
10
5
0
-5
-10
2007
2008
2009
2010
2011
1. Working-days adjusted nominal labour costs for the industry, construction and services except activities of
households as employers and extra-territorial organisations and bodies.
2. Harmonised consumer price index (2005=100). Core HCPI excludes energy, food, alcohol and tobacco.
3. OECD euro area of fifteen.
Source: OECD Economic Outlook Database and Eurostat.
1 2 http://dx.doi.org/10.1787/888933180039
Figure 5. Unemployment rates by educational level
%
40
30
Below upper secondary
Upper secondary and post-secondary
Tertiary
Total
20
10
0
2007
2008
2009
2010
2011
2012
2013
Source: Eurostat.
1 2 http://dx.doi.org/10.1787/888933180046
17
OECD ECONOMIC SURVEYS: ESTONIA © OECD 2015
© OECD 2015
9
ASSESSMENT AND RECOMMENDATIONS
Figure 6. Migration and population trends
A. Migration
% of total population
0.6
Out-migration
In-migration
0.5
0.4
0.3
0.2
0.1
0.0
2001
2002
2003
2004
2005
2006
2007
2008
2009
2010
2011
2012
2013
2009
2010
2011
2012
2013
B. Population
Y-o-y % changes
-0.0
Total population
Working-age population
-0.2
-0.4
-0.6
-0.8
-1.0
-1.2
2001
2002
2003
2004
2005
2006
2007
2008
Source: Statistics Estonia.
1 2 http://dx.doi.org/10.1787/888933180051
substantially recently, although a majority of firms still report improving competitiveness
(Eesti Pank, 2014a).
Wage growth is expected to continue boosting private household consumption.
Exports will be held back by continued weaknesses of some of Estonia’s main trading
partners, notably Finland and Russia, which, respectively, account for 16% and 11% of
Estonia’s exports. The current account balance is therefore expected to deteriorate slightly.
Unemployment will continue to fall but employment gains are expected to be modest, as
the population of working age is expected to continue declining.
Downward risks to the outlook remain. Economic activity may be weaker than
projected in some of Estonia’s main trading partners, with particular uncertainty attached
to events in Ukraine. While the weight of exports to Russia seems to be modest in valueadded terms, the economic slowdown in Russia and the geopolitical crisis could have
marked effects on investor confidence. Weak growth in the euro area and other parts of the
world would also affect the Estonian economy negatively. An ongoing decline of
competitiveness of the Estonian economy could harm growth prospects. Outmigration of
young Estonians risks undermining the supply side of the labour market, which could
reduce the potential growth rate.
18
© OECD 2015
OECD ECONOMIC SURVEYS: ESTONIA © OECD 2015
10
ASSESSMENT AND RECOMMENDATIONS
Figure 7. Export performance and competitiveness
A. Evolution of market shares of gross exports
Index 2000 = 100
200
175
EST
CZE
HUN
POL
FIN
SVK
150
125
100
75
50
2005
2006
2007
2008
2009
2010
2011
2012
2013
B. Domestic value-added content of exports
% of gross exports
90
EST
CZE
HUN
POL
FIN
SVK
80
70
60
50
40
2000
2005
2009
C. Unit labour costs
Index 2007Q1 = 100
140
EST
FIN
Euro area
130
120
110
100
90
2007
2008
2009
2010
2011
2012
2013
2014
Source: OECD Economic Outlook Database, OECD-WTO Trade in Value Added (TiVA) Database (May 2013) and OECD
Unit Labour Costs Database.
1 2 http://dx.doi.org/10.1787/888933180061
Domestic financial risks are low
The non-performing loan ratio has fallen to 1.5% and exposure of financial
intermediaries to Russia and Ukraine is low (Eesti Pank, 2014c). High profitability has
allowed banks, mostly branches and subsidiaries of Nordic banking groups, to build up
strong capital buffers with tier I capital of 16% of total assets on average.
Despite low interest rates, lending to the private non-financial sector has been
moderate. At the same time indebtedness of the corporate and household sectors have
fallen to moderate levels (Figure 8). Lending to manufacturing and to the primary sector
has expanded, but lending for commercial real estate, which is typically particularly riskprone, has declined. Mortgage lending growth for housing purposes is low. Real house
prices have recovered somewhat but are well below the pre-crisis peak and are now rising
only modestly.
While no financial risks result from the housing market at present, persistently low
long-term interest rates could result in the re-emergence of risks in the domestic housing
market. In convergence economies within the euro area, like Estonia, higher inflation is
19
OECD ECONOMIC SURVEYS: ESTONIA © OECD 2015
© OECD 2015
11
ASSESSMENT AND RECOMMENDATIONS
Table 1. Macroeconomic indicators and projections
Annual percentage change, volume (2010 prices)
Gross domestic product (GDP)
2011
Current prices
(EUR billion)
2012
2013
2014
2015
2016
16
4.7
1.6
2.0
2.4
3.4
Private consumption
8
5.1
3.8
3.7
3.8
4.2
Government consumption
3
3.3
2.8
0.4
1.2
1.7
Gross fixed capital formation
4
10.4
2.5
2.1
2.2
4.8
0.5
15.2
6.9
7.1
2.3
4.8
Final domestic demand
16
6.2
3.2
2.6
2.9
3.9
Stockbuilding1
0.2
-1.4
-2.3
1.5
0.2
0.0
Total domestic demand
16
5.2
1.3
4.1
3.1
3.9
Exports of goods and services
14
8.3
2.6
2.7
3.3
4.5
Imports of goods and services
14
12.2
3.1
1.8
3.4
5.1
1
-2.9
-0.5
0.8
0.0
-0.4
Housing
Net exports1
Other indicators (growth rates, unless specified)
Potential GDP
..
2.3
2.4
2.5
2.7
3.1
Output gap2
..
-1.0
-1.8
-2.2
-2.5
-2.1
Employment
..
2.0
0.8
0.8
0.5
0.3
Unemployment rate3
..
10.0
8.6
7.4
7.0
6.6
GDP deflator
..
2.7
4.5
1.7
1.6
2.0
Harmonised index of consumer prices
..
4.2
3.2
0.5
0.9
1.7
Core harmonised index of consumer prices
..
2.8
1.9
1.4
1.4
2.0
Household saving ratio, net4
..
-1.1
-3.6
0.7
2.8
2.4
Current account balance5
..
-2.1
-1.4
0.1
0.0
-0.2
General government financial balance5
..
-0.3
-0.5
-0.3
-0.3
-0.2
Underlying government financial balance2
..
0.9
0.0
0.3
0.3
0.4
Underlying government primary balance2
..
0.8
0.0
0.2
0.2
0.3
Government gross debt (Maastricht)5
1
9.7
10.1
9.5
8.8
8.0
Government gross debt5
2
13.2
13.5
12.9
12.2
11.4
Government net assets5
6
32.7
32.2
30.7
29.2
27.5
Three-month money market rate, average
..
0.6
0.2
0.2
0.1
0.1
1. Contribution to changes in real GDP.
2. As a percentage of potential GDP.
3. As a percentage of the labour force.
4. As a percentage of household disposable income.
5. As a percentage of GDP.
Source: OECD Economic Outlook Database; OECD calculations; and secretariat projections.
likely to push real interest rates to particularly low levels when economic growth
strengthens, which might contribute to a propitious environment for bubbles to develop.
Since Estonia allows mortgage equity withdrawal for the purposes of private consumption,
it is particularly important that the government end the favourable tax treatment of
household borrowing for the acquisition of housing (see below).
A new macroprudential policy framework, established in 2014, is timely. It allows the
Estonian central bank to take action, for example, if low interest rates result in excessive
lending. The designation of the central bank as the macroprudential authority is
appropriate, because it possesses both macroeconomic and financial competence
(Goodhart, 2011). Eesti Pank has powers to impose additional macroprudential capital
requirements, including time-variant capital buffers or limits to loan-to-income or loan-tovalue ratios (IMF, 2014). It has already decided to limit housing loan values to 85% of the
value of the collateral at the beginning of 2015. It has also decided to impose a systemic risk
common equity capital buffer of 2% of risk-weighted assets on the large banks which
20
© OECD 2015
OECD ECONOMIC SURVEYS: ESTONIA © OECD 2015
12
ASSESSMENT AND RECOMMENDATIONS
Figure 8. Financial indicators
B. Loans to households² and non-financial corporations
A. Composite cost of borrowing indicator¹
Households² and non-financial corporations
Percentages per annum
7
% of GDP
120
Estonia
Germany
Euro area
6
100
5
80
4
60
3
40
2
EST: Households
EST: Non-financial corporations
EA: Households
EA: Non-financial corporations
1
0
2007
2008
2009
2010
2011
2012
2013
2014
2004 2005 2006 2007 2008 2009 2010 2011 2012
20
0
1. Compiled using four categories of bank lending rates: short- and long-term lending rates to non-financial
corporations and to households for house purchase, respectively.
2. Non-profit institutions serving households are included in the households sector.
Source: ECB and Eurostat.
1 2 http://dx.doi.org/10.1787/888933180073
operate most of the lending business in Estonia. Larger capital buffers can help damp
shocks, to which Estonia’s small economy has been particularly vulnerable. Cross-border
cooperation in banking supervision has also been strengthened, in part as a result of the
introduction of common rules for the regulation of banks in the European Union as well as
the euro area single supervisory mechanism.
The fiscal position is strong
The general government balance was in a small deficit in 2013. Government
investment spending fell by 1% of GDP, reflecting the decline in spending of one-off
revenues from the sale of Estonian CO 2 emission permits abroad, which have been
earmarked to energy-saving public investment projects. This resulted in a procyclical
impact. The fiscal policy stance is broadly neutral in 2014 and 2015. Tax cuts as well as
higher spending on child and means-tested family cash benefits and on free school meals
in 2015 are offset by some broadening of the VAT tax base as well as higher tobacco and
alcohol taxes.
The sustainability of the government’s financial position is strong. Its gross debt
amounts to 13% of GDP and its net financial asset position to about 30% of GDP. The catchup potential of the economy is likely to result in substantial nominal GDP growth in years
to come, despite demographic ageing, further limiting the burden of outstanding
government debt in the future. The impact of demographic ageing on projected social
spending will be manageable as public spending on pensions is projected to remain stable
at around 8% of GDP.
A new rule requires the central government to maintain a balanced budget in structural
terms. It could help reduce the marked procyclical fiscal stance observed in the past, when
governments targeted budget surpluses in headline terms, as noted in past Economic
Surveys of Estonia (OECD, 2011b, 2012). The government aims to go beyond the rule and
targets a structural surplus in order to create some margin with respect to the rule for the
medium term. Local governments and public enterprises may run a deficit of at most 30% of
their operating revenues, but only if they have liquid financial assets to finance such a deficit.
21
OECD ECONOMIC SURVEYS: ESTONIA © OECD 2015
© OECD 2015
13
ASSESSMENT AND RECOMMENDATIONS
Maintaining budget surpluses would eventually result in the elimination of all government
debt and a continuous increase in government assets. This could be costly, in that so far the
central government’s financial assets have earned little real return (National Audit Office of
Estonia, 2013a). For instance, according to OECD long-term economic projections,
maintaining a budget surplus of 0.5% of GDP would result in all government debt
disappearing by 2030. The government asset position would converge to about 10% of GDP
and continue growing in line with nominal GDP. Viewing the same issue differently, a budget
deficit of 0.5% a year would free up funds for needed spending and result in the debt
converging to only 12.5% of GDP, assuming trend nominal GDP growth of 4% a year.
Several medium-term spending priorities need to be met, a task that will be made
more difficult as EU transfers, now 4% of GDP, diminish as expected after 2020. Increasing
spending on well-targeted active labour market policies, which is low in international
comparison, was a key recommendation of the 2012 Economic Survey of Estonia (OECD,
2012). The Survey also concluded that public funding is needed to improve financial
incentives of employers to invest in lifelong learning, especially among low-educated and
older workers and employees in small businesses. Improving life-long learning also is a
priority for the government, which has taken steps to improve framework conditions.
There are also spending needs to support students in vocational education as well as to
address remaining bottlenecks in infrastructure (see below). The World Health
Organisation (2008) noted a lack of human resources in health care. The government has
already taken steps to improve the supply of ambulatory care and has stepped up efforts to
promote prevention of health risks. Child poverty could be alleviated more effectively.
Families need to apply for income-tested child benefits every three months and only 19%
of entitled families did so before the recent increase, reflecting cumbersome application
procedures. Government funding is also needed to encourage steps to move to a low
carbon-emission economy. Lowering the labour tax wedge would also help boost economic
growth (see below).
Improving spending efficiency and prioritisation as well as eliminating exemptions in
personal income taxation would create some room for raising priority spending and for
lowering the labour tax wedge. The deductibility of mortgage payments from personal
income tax, in particular, lowers revenues, harms economic efficiency and mostly benefits
high-income households. It has a budgetary cost of 0.1% of GDP. In the longer term
budgetary rules could make room for a somewhat easier medium-term fiscal stance. It
should be used to finance spending which has a higher rate of return than the interest rate
the central government earns on its financial assets or the interest rate it pays on
government debt. This is likely to be the case for the spending priorities noted above. A
somewhat less stringent target for the budget balance would also be consistent with fiscal
policy requirements in the European Union.
Recommendations on fiscal policy
●
Create budgetary room to raise spending on active labour market policies, infrastructure
and education, as well as to lower labour taxes. To this end, improve spending efficiency
and prioritisation and phase out tax exemptions, notably the deductibility of mortgage
interest payments. In the longer-term consider allowing a small deficit in the
government budget rule.
22
© OECD 2015
OECD ECONOMIC SURVEYS: ESTONIA © OECD 2015
14
ASSESSMENT AND RECOMMENDATIONS
Raising productivity and benefitting more from openness
Estonia is more open than most other countries, with exports and imports each
amounting to roughly 90% of GDP. Estonia can do more to revitalise productivity growth
and reap more benefits from its openness. A considerable potential for transfer of
knowledge lies in foreign direct investment (OECD, 2008), especially for a small economy
with a large productivity gap, such as Estonia. Inward foreign direct investment in
manufacturing has been low in the last ten years. Manufacturing is concentrated on lowvalue added production (OECD, 2012; Masso et al., 2010). Collaboration between domestic
and foreign firms seems to produce limited effects in terms of transfer of knowledge to
Estonia and economic growth (European Research Area Committee, 2012; National Audit
Office of Estonia, 2013a). Collaboration of firms with research institutions is low, further
limiting transfer of knowledge (European Commission, 2014; European Commission, 2013a;
European Research Area Committee, 2012). Continued reform efforts are needed to make
innovation policies more effective; remove remaining barriers to entrepreneurship; and
upgrade infrastructure, as discussed below.
Reaping more benefits from innovation
R&D spending in Estonia has increased considerably in recent years, reaching 2.2% of
GDP in 2012. This increase may well result in improved productivity and competitiveness
in the future (Andrews and Westmore, 2014). However, the economic impact of the
Estonian R&D system has so far been limited (European Commission, 2013a; National
Audit Office of Estonia, 2013a), which has prompted reforms by the government. For
example, exports of medium and high-tech products; license and patent revenues from
selling technologies; and sales of new products are still low (European Commission, 2014).
Important steps have been recently taken to improve the effectiveness of public
innovation support. Estonia has developed a smart specialisation strategy which can be a
useful policy framework for innovation-driven growth. It combines industrial, educational
and innovation policies and rests on an interactive bottom-up approach involving all
stakeholders (MER/MEAC, 2014). Moreover, responsibilities for R&D policies have been
clarified and coordination across ministries has been strengthened. Considerable efforts
have been made in recent years to improve evaluation of innovation policies (OECD, 2013a).
Their effective design and implementation requires constant experimentation, monitoring
and adaptation (OECD/WB, 2014). Therefore, evaluation should already be incorporated
at the design stage. Pilot projects have proven particularly useful (Andrews and
Criscuolo, 2013).
The number of firms collaborating with research institutions is low, especially among
SMEs (OECD, 2013b; European Commission, 2014). There is scope to focus university
research more on applied research and strengthen the collaboration of universities with
domestic firms. Keeping a balance between basic and applied research is crucial for
innovation and for new growth areas to emerge in the future. Further efforts are also
needed to promote collaboration of firms and universities with applied research institutes,
including from abroad.
Improving product market regulation
Competition-friendly product market regulation stimulates innovation, trade and
investment, speeding up convergence and growth (Johansson and Olaberria, 2014).
23
OECD ECONOMIC SURVEYS: ESTONIA © OECD 2015
© OECD 2015
15
ASSESSMENT AND RECOMMENDATIONS
Regulation in Estonia overall appears more competition-friendly than in many OECD
countries (Figure 9). However, there is scope to further reduce entry barriers in some
services. Identifying and removing these barriers would strengthen productivity growth
throughout the economy because of these services’ role as intermediate inputs
(Bourlès et al., 2013; Barone and Cingano, 2011). Professional services in Estonia benefit
from a number of exclusive rights, according to the OECD PMR indicator 2013. This is true
for engineers, architects, accountants and lawyers. For instance, engineers have exclusive
rights to conduct environmental assessments and monitoring of engineering projects.
Unlike in many other countries, a range of audits can only be conducted by accountants.
Also, some entry barriers for foreign service providers continue to exist. For instance, entry
barriers are comparatively high in maritime transport services: nationality and residency
conditions are imposed on registering ships and on equity and members of the board of
directors for firms registered in Estonia (OECD, 2014a). Continued efforts are needed to
identify and remove entry barriers that hold back competition and growth in services.
Figure 9. Product market regulation
Scale 0 (least) to 6 (most restrictive), 2013
Index
2.2
2.0
1.8
1.6
1.4
1.2
ISR
SVN
KOR
GRC
JPN
SWE
CHE
CHL
NOR
ISL
IRL
ESP
FRA
OECD
BEL
CZE
EST
CAN
SVK
HUN
FIN
PRT
ITA
NZL
AUS
DNK
AUT
DEU
NLD
0.8
GBR
1.0
Note: OECD refers to the simple average.
Source: OECD (2013), Product Market Regulation Indicators.
1 2 http://dx.doi.org/10.1787/888933180084
Continuing to review corporate bankruptcy procedures
Corporate bankruptcy laws which impose excessively high exit costs on
entrepreneurs, including through long procedures, hold back efficient reallocation of
resources, entrepreneurship and innovation. At the same time, insufficient safeguards for
creditors may reduce the supply of credit (Andrews and Criscuolo, 2013; OECD, 2014b). In
Estonia, corporate insolvency cases are not always resolved in a manner that contributes
to an efficient allocation of resources (Economic Survey of Estonia, 2011). Insolvency
procedures are long and recovery of creditor claims is relatively weak (Figure 10), despite
progress made in the reform of bankruptcy legislation in 2011. Also, out-of-court expertise
is almost never used because insolvent debtors must pay for experts but rarely have the
funds to do so. Judges may not be able to draw on the necessary expertise to deal with
complex cases (European Commission, 2013b; European Research Area Committee, 2012).
Courts should be given the power to require the creditor to pay for experts, particularly in
24
© OECD 2015
OECD ECONOMIC SURVEYS: ESTONIA © OECD 2015
16
ASSESSMENT AND RECOMMENDATIONS
Figure 10. Bankruptcy procedures: recovery rates and duration
100
Recovery rate (cents on the dollar)
JPN
IRL
80
BEL
FIN GBR NLD
NOR
DNK
ISL AUT
DEU
KOR
USA
ESP
PRT
SWE
ITA
60
POL
SVN
FRA
GRC
LUX
RUS
CHN
HUN
40
CZE
SVK
CHE
ISR
EST
TUR
20
BRA
0
0
1
2
3
4
5
Time (years)
Source: OECD (2013), Entrepreneurship at a Glance.
1 2 http://dx.doi.org/10.1787/888933180091
more intricate corporate cases. A specialised bankruptcy court could improve judicial
expertise, as suggested in previous Surveys.
Closing infrastructure gaps
Tr a n s p o r t , c o m m u n i c a t i o n a n d e n e rg y n e t w o r k s a r e k ey f a c t o r s f o r
internationalisation and economic growth. Estonia has made considerable progress in
upgrading its infrastructure (World Economic Forum, 2013). EU transfers are high,
amounting to 4% of GDP in 2012, and have mostly been spent on infrastructure projects
(Eesti Pank, 2013).
There is scope to further develop infrastructure connections across borders. For
instance, considerable benefits would result from implementing the planned connection to
the European high-speed railway network without further delays (AECOM, 2011). The
integration in European gas and, to some extent, electricity networks is still weak (IEA,
2013). Two electricity transmission links with Finland already operate. The government has
developed further plans to expand connections to Nordic and Central European gas and
electricity transmission infrastructure, which requires cooperation with EU countries in
the region. Better integration of electricity and gas networks with the EU will enhance the
diversity and security of supply, which is of increasing importance as the share of
renewable energies rises and use of domestic oil shale in electricity generation needs to be
scaled down in order to reduce CO2 emissions (see below).
Some domestic infrastructure bottlenecks also remain, holding back private sector
development and constraining mobility (National Audit Office of Estonia, 2013b). Funding
has been primarily directed to large infrastructure projects, which can be financed with EU
funds, leaving fewer funds for smaller rural projects (European Commission, 2012). There
is evidence that some EU-funded projects have been designed too large (National Audit
Office of Estonia, 2013a). This suggests that monitoring and decision making on how
infrastructure projects are selected can be improved. There is also scope to improve
intermodal connections, which would facilitate trade (European Commission, 2012).
25
OECD ECONOMIC SURVEYS: ESTONIA © OECD 2015
© OECD 2015
17
ASSESSMENT AND RECOMMENDATIONS
Recommendations to raise productivity
●
To strengthen knowledge transfers to domestic firms, promote applied research and
improve collaboration with domestic and foreign institutions conducting applied
research.
●
Implement plans to expand access to European transport networks and energy supply
facilities. Improve inter-modal connections.
●
Shorten corporate insolvency procedures and improve their efficiency, for example by
strengthening the use of expertise.
Reducing CO2 emissions and energy consumption
Estonia has a target for greenhouse gas emissions in sectors outside the European
emissions trading system (ETS) for 2020, which limits their growth to 11% from the level in
2005. While the government expects to meet this target on current policies, considerably
more ambitious emission targets are expected beyond 2020 in the context of targets set by
the European Union. Moreover, the economy is vulnerable to rising carbon prices in the
European Union’s emission trading system, as these prices are likely to rise when
economic activity strengthens in Europe and stricter CO2 emissions targets are applied.
The efficient use of energy can help to raise competitiveness by reducing the economic
costs of environmental damage and bolstering innovation (OECD, 2011a). Greenhouse gas
emissions per unit of GDP are less than half the 1990 level but remain among the highest
in the OECD (Figure 11). High emissions are largely due to the use of oil shale, which covers
70% of Estonian energy demand. Exploiting these reserves has contributed to meeting
energy security objectives. However, the CO2 intensity of oil shale combustion and energy
consumption are high.
Taxation of the various energy sources should be harmonised according to their
CO2 emission content to provide effective price signals. Implicit tax rates per tonne of CO2
are low on average in Estonia, and vary considerably across energy sources and uses. While
taxes on natural gas and fuel oil have been raised, tax rates on fossil fuel use in heat and
electricity generation, which are mostly based on oil shale, are much lower than on
transport and this difference is larger than in many other OECD countries (OECD, 2013c).
Moreover, oil shale used for heat production and electricity generation is taxed at lower
rates than other fossil fuels (IEA, 2013; OECD, 2014c). The harmonisation of tax rates can be
a gradual process, provided a firm commitment to future increases is made. Income
support for low income households should take into account the impact of higher energy
costs on poverty risks.
Processing oil shale into lighter oil products would reduce CO2 emissions by two-thirds
(IEA, 2013). Continued R&D investment is required to lower the carbon intensity of the
Estonian economy, including by the private sector. Moreover, all environmental costs of oil
shale use need to be internalised, in particular those due to the considerable waste
amounts. It is welcome that the government is planning to revise taxes on oil-shale related
activities which damage the local environment.
Estonia can reduce emissions by improving energy efficiency in district heating
(European Commission, 2013b). Losses in heat networks, to which 70% of the population
are connected, amount to 22% (IEA, 2013). Moreover, regulation of heat networks could
26
© OECD 2015
OECD ECONOMIC SURVEYS: ESTONIA © OECD 2015
18
ASSESSMENT AND RECOMMENDATIONS
Figure 11. Greenhouse gas emissions and energy consumption
A. Greenhouse gas emissions¹ relative to GDP
Tonnes of CO2 equivalent per 1000 USD
4
2010
1990
3
2
FIN
EST
ISL
FIN
CAN
EST
NZL
AUS
KOR
POL
AUS
CZE
CZE
CAN
NZL
USA
BEL
USA
TUR
KOR
SVK
SWE
IRL
MEX
SVK
CHL
SVN
GRC
ISR
HUN
BEL
LUX
DNK
NLD
JPN
DEU
AUT
ITA
GBR
PRT
ESP
FRA
NOR
CHE
0
SWE
1
B. Energy consumption² relative to GDP
Tonnes of oil equivalent per 1000 USD
0.35
2012
0.30
2000
0.25
0.20
0.15
SVN
POL
HUN
OECD
FRA
NLD
MEX
CHL
NOR
LUX
JPN
TUR
ISR
DEU
GRC
AUT
ESP
ITA
PRT
DNK
GBR
IRL
0.05
CHE
0.10
1. Data refer to gross direct emissions including emissions from land-use, land-use change and forestry (LULUCF).
Removals/sequestration of greenhouse gas through LULUCF are deducted.
2. It refers to total primary energy supply and equals production plus net trade minus international bunkers plus or
minus stock changes.
Source: OECD/IEA (2013), Emissions of CO2, CH4, N2O, HFCs, PFCs and SF6, IEA CO2 Emissions from Fuel Combustion
Statistics Database and OECD Economic Outlook; and IEA (2013), Energy Balances of OECD Countries.
1 2 http://dx.doi.org/10.1787/888933180105
provide stronger incentives to improve efficiency, for example by penalizing operators
which fail to attain ambitious efficiency benchmarks. The government is planning to
introduce regulation which will provide networks with incentives to reduce losses to 15%
by 2017, which is welcome. The government has also proposed draft regulation that
encourages the use of renewable biomass in district heating. However, customers with
obligatory connections to district heating systems continue to be prevented from investing
in economically justified high-efficiency alternatives. There is scope to raise incentives of
households and building owners to invest in energy efficiency of buildings. For example,
many district heating systems have inadequate or no metering. More steps need to be
taken to improve energy efficiency in housing of low income households.
Recommendations to lower CO2 emissions and energy consumption
●
Gradually align and raise tax rates on energy sources according to their CO2 emission
content.
●
Strengthen incentives for operators of heating networks to improve efficiency.
Strengthen incentives to invest in energy efficiency of buildings.
27
OECD ECONOMIC SURVEYS: ESTONIA © OECD 2015
© OECD 2015
19
ASSESSMENT AND RECOMMENDATIONS
Making the most of human capital
Estonia can strengthen labour utilisation by shifting the tax burden away from labour
and by reducing the burden on workers in the pension system. Lowering the tax burden
can raise labour utilisation and boost competitiveness, especially in the Estonian economy,
where it can also influence decisions of emigrants and cross-border workers where to
supply labour. Recent reductions in the labour tax wedge are welcome. However, the tax
wedge on labour remains high in international comparison, especially for workers on low
earnings (Figure 12), and is expected to remain so after the planned reductions in income
tax and social security contributions and the increase of child benefits in 2015. The
earnings gap between Estonia and Finland, where many Estonian emigrants and crossborder workers work, remains large. In 2013 take-home pay of a worker on average
earnings in Estonia was less than a third of take-home pay in Finland.
Figure 12. Labour tax wedges
Income tax plus employee and employer contributions less cash benefits, 2013
% of labour costs
45
40
Estonia
Finland
OECD
35
30
25
20
15
10
5
0
Single no children at 67% of average worker¹’s wage
Married with 2 children at 100-67 % of average worker¹’s wage
1. Working at full-time and receiving the average gross earnings.
Source: OECD (2014), Taxing Wages 2014.
1 2 http://dx.doi.org/10.1787/888933180119
Measures to make the supply of skills more relevant for the labour market and make
better use of workers’ skills would also help raise labour utilisation, reducing skill
mismatch and improving competitiveness. Moreover, better opportunities for young
people to obtain qualifications demanded in the labour market could also make Estonia
more attractive as a place to work for young people. Indeed, workers with good
professional qualifications are less likely to seek employment abroad (Pungas et al., 2012)
and are in high demand in Estonia. The number of vacant jobs for highly skilled workers
and for skilled non-manual workers has risen well above pre-crisis levels (Figure 13).
Women face barriers to make full use of their potential to contribute to output and wellbeing as they earn on average 30% less per hour than men.
Making the tax system more employment-friendly
While the contribution of personal income taxation to government revenues is low,
reflecting the flat tax rate of 21%, social security contributions make up a large share
(Table 2). Unlike personal income taxes, the burden of these contributions falls fully on
labour income. By contrast, the taxation of real estate contributes relatively little to revenues,
as only land (but not buildings) is taxed and the valuation of land does not reflect market
28
© OECD 2015
OECD ECONOMIC SURVEYS: ESTONIA © OECD 2015
20
ASSESSMENT AND RECOMMENDATIONS
Figure 13. Vacancies by skill level
9000
High skilled
Skilled non-manual
Skilled manual
Elementary
8000
7000
6000
5000
4000
3000
2000
1000
0
2005
2006
2007
2008
2009
2010
2011
2012
2013
2014
Source: Estonian Unemployment Insurance Fund (Eesti Töötukassa).
1 2 http://dx.doi.org/10.1787/888933180129
Table 2. Tax revenue composition, 2011
Per cent
Taxes on corporate
income
Taxes on personal
income
Social security and
payroll
Property
Goods and services
Austria1
5.2
22.4
41.3
1.2
27.8
Belgium
6.6
28.3
32.2
7.3
24.7
Czech Republic
9.7
10.7
44.1
1.5
33.4
Denmark1
5.8
50.7
2.6
4.1
32.0
Estonia
3.8
16.2
37.0
1.0
41.5
Finland
6.3
29.3
28.9
2.6
32.6
France1
5.7
17.0
41.0
8.5
24.8
Germany
4.7
24.8
38.5
2.4
29.1
Ireland
8.9
32.1
17.4
6.8
34.3
Korea
15.5
14.8
23.8
11.4
31.4
Luxembourg
13.6
22.4
29.6
7.1
27.0
Netherlands
5.4
21.4
38.4
3.3
30.0
Norway
25.2
23.2
22.3
2.9
26.5
Poland
6.4
13.8
36.1
3.7
39.2
Portugal
9.8
18.6
28.2
3.2
39.2
Slovak Republic
8.4
8.8
42.7
1.4
37.2
Slovenia
4.6
15.4
40.6
1.6
37.4
Sweden
7.3
27.7
32.9
2.4
29.3
United Kingdom
8.6
28.2
18.7
11.6
32.3
United States
9.4
37.1
22.8
12.4
18.3
OECD-Total
8.7
24.1
27.3
5.4
32.9
1. The total tax revenue has been reduced by the amount of any capital transfer that represents uncollected taxes.
The capital transfer has been allocated between tax headings in proportion to the reported tax revenue, except for
Austria where it has been allocated to the social security contributions heading.
Source: OECD Tax Revenue Statistics.
values (OECD, 2012). Shifting some of the tax burden on labour to real estate tends to be
supportive of GDP growth (Johansson et al., 2008). It could also help broaden the
government’s revenue base. Indeed, cross-border workers pay labour tax in Finland but
mostly use public services in Estonia. The most effective way to reduce the labour tax wedge
on low wage earners is to reduce their social security contributions, as these account for
most of their tax wedge. Steps need to be taken to protect low-income owner occupiers, such
29
OECD ECONOMIC SURVEYS: ESTONIA © OECD 2015
© OECD 2015
21
ASSESSMENT AND RECOMMENDATIONS
as pensioner households, who would not benefit from lower labour taxes. A basic allowance
in residential real estate tax or means-tested income support would provide relief.
Employers generally have to pay a minimum lump-sum social security contribution
for their workers’ public pension and health insurance, although many exemptions apply.
It is binding for workers on low earnings, discouraging part-time work. Indeed, Estonia has
one of the lowest shares of part time work in the OECD, although this also reflects lower
income levels. Evidence across OECD countries shows that removing barriers to part-time
employment improves wellbeing, as part-timers benefit from better health and safety
outcomes because of the improved control over working hours. Part-time work can also be
a viable alternative to unemployment or inactivity (OECD, 2010). To avoid disincentives for
part-time work, it would be preferable to eliminate the minimum lump-sum social security
contribution.
Low returns in the second pillar pension system reduce the attractiveness
of employment in Estonia
High fund managers’ operating costs reduce returns in the compulsory private funded
defined-contribution pension system. Costs in the pension funds born by workers are high
in international comparison (Figure 14), which significantly reduces the capital workers
accumulate in the fund. Since 2002, all young workers taking up employment in Estonia
have been enrolled in the compulsory, private second pillar pension system, which
complements the public defined-benefit system. Six per cent of workers’ salaries flow into
a fund chosen by each worker, of which 4 percentage points via employers’ social security
contributions. With lower costs, workers could pay lower contributions to attain the same
pension level.
Figure 14. Pension funds’ operating expenses as a share
of assets under management
2012
% of total assets
2.5
2.0
1.5
1.0
LVA
EST
ESP
HUN
SVN
MEX
CZE
AUS
SVK
GRC
NZL
POL
FIN
BEL
CAN
ISR
ITA
NOR
CHE
ISL
DEU
LUX
PRT
NLD
0.0
DNK
0.5
Source: OECD Global Pension Statistics and Finance Ministry of Estonia.
1 2 http://dx.doi.org/10.1787/888933180137
To reduce costs and fees the government has taken regulatory action in recent years.
To increase competition among funds, it has allowed workers to switch fund more often
and has abolished issuance fees, although redemption fees, which are also paid when
switching funds, are still allowed. To help workers make more informed choices, it has
required the comprehensive disclosure of profits and costs and has introduced a
30
© OECD 2015
OECD ECONOMIC SURVEYS: ESTONIA © OECD 2015
22
ASSESSMENT AND RECOMMENDATIONS
programme promoting financial literacy. However, there still is a need to ensure that
information is disclosed in a standardized manner. The government intends to take the
necessary steps. The government also plans to tighten caps on fees in the largest pension
funds. It expects that these measures will lower the management fees paid by contributors
to below 1% of assets by 2019.
Marketing expenditure accounts for half of pension funds’ operating costs in Estonia.
The government is concerned that marketing expenses cross-subsidise other activities of
financial groups supplying pension funds. Empirical evidence suggests that marketing
activities of fund managers with the purpose of attracting contributors to their funds has
no benefit for workers. Such activities raise costs as well as suppliers’ market power
because they attach workers to pension funds for reasons unrelated to performance,
especially low-wage contributors (Hastings et al., 2013). Contributors are likely to bear
marketing costs even if such costs are not directly included in fees they pay, as market
demand is perfectly inelastic.
Australia and Sweden have introduced a low-cost default-choice fund, in which
contributors invest unless they take a deliberate decision to invest elsewhere. Costs in these
funds can be kept low with passive investment strategies, which follow the composition of
security indices, as well as by avoiding marketing expenses. Such a fund could also serve as
a benchmark, helping to drive down costs in other funds. In Chile, all labour market entrants
contribute to a low cost fund in their first five years. This fund is attributed in a tendering
process to the supplier offering the lowest costs. The introduction of a centralised clearing
house for purchases and sales of pension funds, such as in Sweden, also appears to have
helped reduce costs. The Swedish authorities allow all pension fund suppliers operating
outside the compulsory system to supply their funds in the compulsory system as well,
provided they accept substantial rebates on the fees they charge within the compulsory
system (Tapia and Yermo, 2008). This has allowed the compulsory private pension system to
lower marketing costs as well as to operate without redemption fees, raising net returns to
contributors substantially. If the government’s efforts do not lower costs close to the levels
observed in best-performing countries over the next few years, it should undertake a more
fundamental reform of the compulsory private pension system, for example, along the lines
of the Swedish system, including the introduction of a low-cost default fund.
In view of the evidence suggesting that competition among pension funds in
compulsory systems is not effective enough, corporate governance practices in pension
fund management should also have a role to play in ensuring they act in contributors’
interests. Board members must represent the interest of their shareholders which can be
to the detriment of contributors. There is scope to improve representation of contributors’
interests in pension funds’ corporate governance. Estonia has required by law that the
pension fund management companies must act in the interest of contributors. In addition,
introducing a position for a board member who is independent of owners’ interests could
strengthen representation of contributors’ interests. It is welcome that the Estonian
government is considering steps in this regard. Some countries, such as Australia, have
gone further and have required all board members to represent contributors’ interests and
to be independent of shareholders.
Containing spending in public pensions can help limit social security contributions
The public pension system, which is mostly funded from social security contributions,
includes early pension schemes. About 40% of men and 30% of women receive public
31
OECD ECONOMIC SURVEYS: ESTONIA © OECD 2015
© OECD 2015
23
ASSESSMENT AND RECOMMENDATIONS
pensions before they attain the legal retirement age (Praxis Center for Policy Studies, 2011).
The bulk are disability pensions as well as special early pension schemes for workers in
specific occupations or sectors. The government plans to reform these early pension
schemes. In some of the occupational and sectoral early pension schemes workers are
deemed to be subject to higher health risks. However, in most cases, health risks appear
not to be higher (National Audit Office, 2014). The impact on labour market participation of
these early pension schemes has been limited because pension receipt is compatible with
work. However, disability pensions and early occupational pensions account for about a
quarter of public pension spending, which is mostly funded by social security
contributions (National Audit Office of Estonia, 2014). Moreover, as the 2012 Economic Survey
(OECD, 2012) has pointed out, disability benefit recipients do not have access to activation
measures, lowering their employability when they can return to work.
Parliament is considering a reform of disability benefits to increase access to
activation measures and strengthen the assessment of the capacity to work (National
Audit Office, 2014). The planned reform is welcome and should be implemented. The
disability pension regime has, despite its shortcomings, provided substantial poverty relief
in the past. It is therefore also important that reforms limiting access to disability pensions
are accompanied by steps to raise means-tested minimum income support for the
unemployed, as pointed out in the 2012 Economic Survey. In addition, phasing out the
occupational and sectoral early pension regimes would lower pension spending, allowing
social security contributions to be reduced.
Another welcome development, the government is considering introducing work
accident and occupational sickness insurance. Such insurance, coupled with experiencerated employer contributions, is key for employers to have adequate incentives to prevent
deterioration of health outcomes at work. As the 2012 Economic Survey (OECD, 2012) has
pointed out, work-related accidents and diseases constitute an important health risk,
particularly for those in low-skill occupations.
Strengthening the supply of marketable skills
The pay gap between men and women is unusually large in comparison to other
European economies. The difference does not diminish if wages of men and women with a
similar level of education, field of study and experience are compared (Anspal and Rõõm,
2007). Differences in gender-specific choice of occupation and sector of activity explain one
third of the gap. Women’s career prospects compare particularly unfavourably in
managerial posts. Low availability of childcare facilities for children aged up to 1½ years,
and in some municipalities for children aged up to 3 years, as well as low participation of
men in providing childcare within the family contribute to inequality. Parental leave
entitlements are generous in Estonia, to the point of creating risks for labour market
prospects for the parent taking the leave. It is almost only taken up by women. To reduce
the gender pay gap, the Estonian Government launched an action plan 2012-2015. The
action plan includes steps to improve the implementation of gender equality legislation;
improve reconciliation of work, family and private life; encourage gender mainstreaming,
especially in education; reduce gender segregation in the labour market; and to review the
organizational practices and pay systems in the public sector.
The share of youth leaving the education system without an upper secondary degree
has declined from 14% in 2009 to 10% in 2013. Youth who have not been in education and
employment for 4 months receive an education, training or employment offer from the
32
© OECD 2015
OECD ECONOMIC SURVEYS: ESTONIA © OECD 2015
24
ASSESSMENT AND RECOMMENDATIONS
government. Nonetheless, many young people do not have qualifications which prepare
for labour market entry. This includes youth who obtain academic upper secondary
degrees but do not proceed to tertiary academic education (Figure 15). Indeed, evidence
across European economies shows that youth leaving the labour market at the level of
upper secondary education obtain better labour market outcomes if they follow vocational
education courses (ECDVT, 2013) in terms of employment rates, stability of employment,
initial salaries and an improved match of the supply and demand of skills.
Figure 15. Highest educational attainment of young adults
25-34 year olds
% of total
140
Below upper secondary attainment
General upper secondary or post-secondary non-tertiary
Vocational upper secondary or post-secondary attainment
Tertiary attainment
120
100
80
60
40
20
0
SVK
EU21
OECD
EST
FIN
SWE
NOR
Source: OECD (2013), Education at a Glance 2013.
1 2 http://dx.doi.org/10.1787/888933180148
Labour market outcomes of vocational graduates compare less favourably than
elsewhere in Europe (ECDVT, 2013). Hence, overall, employment rates of youth who have
graduated from upper secondary degrees are relatively weak whereas they are strong for
tertiary graduates (Table 3). This indicates that the labour market relevance of vocational
education needs to improve. Evidence across European OECD economies shows that labour
market outcomes of vocational graduates improve if substantial work-based training is
built into programmes (ECDVT, 2013). The Estonian government has taken substantial
measures to make vocational education more relevant for the labour market. It has set up
a task force to anticipate future skills demand. The task force is also required to propose
institutional reforms to improve cooperation of stakeholders for the monitoring of
employment needs. The government has supported upgrading the technical equipment of
vocational schools. It has also adopted a life-long learning strategy. However, workplacebased education remains modest. Most students in vocational education only complete a
4-6 months internship. Only 2% enrol in an apprenticeship. Apprenticeships help reduce
skill mismatch (OECD, 2014d).
A constraint to the development of apprenticeships appears to be the small size of
many firms. To overcome this, Norway has developed a system in which firms share
apprenticeship places and which helps to inform schools and their pupils about local
firms’ training needs (Kuczera et al., 2008). Local links between firms and schools can also
be fostered by allowing practitioners to teach part-time in schools. Indeed, local
partnerships between training providers and employers encourage training provision
which is sensitive to labour market needs (OECD, 2014d and references therein). Local
33
OECD ECONOMIC SURVEYS: ESTONIA © OECD 2015
© OECD 2015
25
ASSESSMENT AND RECOMMENDATIONS
Table 3. Employment rates of young people up to 3 years after graduation
by educational attainment level
Per cent, 15-34 year olds, 2013
Upper secondary and post-secondary non-tertiary
education (levels 3 and 4)
First and second stage of tertiary education
(levels 5 and 6)
Euro area (13 countries)
66.7
79.0
Czech Republic
73.9
85.6
Denmark
78.6
84.3
Estonia
65.8
85.4
Latvia
70.1
84.1
Poland
61.7
81.3
Slovenia
62.0
79.3
Slovakia
61.4
76.7
Finland
75.2
85.7
Sweden
78.1
89.8
United Kingdom
72.3
87.6
Source: Eurostat.
flexibility in curricula provides a powerful support for local provider-employer
partnerships. For example, in Germany each individual vocational school has some
flexibility in its curriculum to adapt it to local needs.
A barrier to the development of apprenticeships is the requirement to pay the national
minimum wage to trainees. At 40% of the median wage, the minimum wage is likely to be
too high for training purposes in many cases. However, since trainees may not be able to
cover living expenses if they are paid substantially less than the minimum wage,
government financial support is needed. However, as the previous Economic Survey of
Estonia has pointed out, there also is a need to monitor the quality of work practice
schemes and to develop quality assurance for apprenticeships as well as to ensure time for
school-based instruction of apprentices is sufficient (OECD, 2012).
Recommendations to make the most of human capital
●
Further reduce the taxation of labour earnings, in particular of low earnings. Raise more
revenues from the taxation of real estate by removing exemptions and by evaluating
property according to market values.
●
In the compulsory private pension system, reduce costs born by workers, in particular
marketing expenses. Improve representation of contributors’ interests in pension fund
governance.
●
In the public pension system, phase out special occupational and sectoral pension
regimes. Reform disability pensions as planned, while expanding the safety net for
unemployed workers.
●
Encourage equal pay between women and men. Require both parents to take up
parental leave in order for parents to qualify for the full leave entitlement. Identify and
address barriers to female entrepreneurship. Consider requiring firms to identify and
address pay inequalities between men and women.
●
Introduce a tax-free lower minimum wage for apprenticeships, improve financial
support for students in vocational education and strengthen collaboration of businesses
and schools at the local level.
34
© OECD 2015
OECD ECONOMIC SURVEYS: ESTONIA © OECD 2015
26
ASSESSMENT AND RECOMMENDATIONS
Bibliography
AECOM (2011), Rail Baltica Final Report – Executive Summary, May 2011, Co-financed by the European
Union Tran-European Transport Network (TEN-T).
Andrews, D. and C. Criscuolo (2013), “Knowledge-Based Capital, Innovation and Resource Allocation”,
OECD Economics Department Working Papers, No. 1046, OECD Publishing.
Andrews, D. and B. Westmore (2014), “Managerial Capital and Business R&D as Enablers of Productivity
Convergence”, OECD Economics Department Working Papers, No. 1137, OECD Publishing.
Barone, G. and F. Cingano (2011), “Service Regulation and Growth: Evidence from OECD Countries”, The
Economic Journal, 121:931-957.
Bourlès, R. et al. (2013), “Do Product Market Regulations in Upstream Sectors Curb Productivity
Growth? Panel Data Evidence for OECD Countries”, Review of Economics and Statistics, No. 95(5),
1750–1768.
Eesti Pank (2013), Estonian Economy and Monetary Policy, No. 2/2013, December 2013, Tallinn.
Eesti Pank (2014a), Estonian Economy and Monetary Policy 1/2014.
Eesti Pank (2014b), Labour Market Review 1/2014.
Eesti Pank (2014c), Financial Stability Review 1/2014.
European Commission (2012), Position of the Commission Services on the Development of Partnership
Agreement and Programmes in ESTONIA for the Period 2014-2020.
European Commission (2013a), “Erawatch Country Reports 2012: Estonia”, IRC Scientific and Policy
Reports.
European Commission (2013b), Industrial Performance Scoreboard – Member States’ Competitiveness
Performance and Implementation of EU Industrial Policy.
European Commission (2014), Innovation Union Scoreboard 2014, Brussels.
European Centre for the Development of Vocational Training (ECDVT, 2013), Labour market outcomes of
vocational education in Europe. Evidence from the European Union labour force survey. Research paper
No. 32.
European Research Area Committee (2012), “Peer-Review of the Estonian Research and Innovation
System – Steady Progress Towards Knowledge Society”, Innovation Studies, No. 19/2012.
Goodhart, Charles A.E. (2011), The Macro-Prudential Authority: Powers, Scope and Accountability, OECD
Journal: Financial Market Trends Vol. 2011 – Issue 2
Hastings, J. S., A. Hortaçsu, C. Syverson (2013), Advertising and Competition in Privatized Social
Security: The Case of Mexico. NBER Working Paper No. 18881.
International Energy Agency (IEA, 2013), Energy Policies Beyond IEA Countries: Estonia, Paris.
International Monetary Fund (IMF, 2014), Republic of Estonia: 2014 Article IV Consultation-Staff Report.
Washington, D.C.
Johansson, Å., et al. (2008), “Taxation and Economic Growth”, OECD Economics Department Working
Papers, No. 620, OECD Publishing.
Johansson, Å. and E. Olaberria (2014), “New Evidence on the Determinants of Industrial
Specialisation”, OECD Economics Department Working Papers, No. 1112, OECD Publishing.
Kuczera, M., G. Brunello, S. Field and N. Hoffman (2008), “A Learning for Jobs Review of Norway”, OECD
Publishing.
Masso, J., T. Roolaht and U. Varblane (2010), “Foreign Direct Investment and Innovation in central and Eastern
Europe: Evidence from Estonia”, Working Paper of Eesti Pank, No. 5.
Ministry of Education and Research/Ministry of Economic Affairs and Communications (MER/MEAC,
2014), Estonian Research and Development and Innovation Strategy 2014-2020 “Knowledge-based Estonia”,
21.01.2014, Tallinn.
National Audit Office of Estonia (2013a), Overview of the use and preservation of state assets in 2012–2013Summary of Problems in the Development and Economy of Estonia by the National Audit Office, Tallinn
National Audit Office of Estonia (2013b), Quality of Renovation of Main Roads of State, Tallinn.
35
OECD ECONOMIC SURVEYS: ESTONIA © OECD 2015
© OECD 2015
27
ASSESSMENT AND RECOMMENDATIONS
National Audit Office of Estonia (2014), Sustainability of the state’s pension system. Does the state guarantee
the effective functioning of pension pillars? Report of the National Audit Office to the Riigikogu, Tallinn.
OECD (2008), “Trade and Innovation: A Synthesis Paper, Trade and Agriculture Directorate”, TAD/TC/
WP(2008)6/PART1/REV1.
OECD (2010), Employment Outlook 2010, OECD Publishing.
OECD (2011a), OECD Green Growth Studies: Energy, OECD Publishing.
OECD (2011b), OECD Economic Surveys: Estonia 2011, OECD Publishing.
OECD (2012), OECD Economic Surveys: Estonia 2012, OECD Publishing.
OECD (2013a), Innovation-driven Growth in Regions: The Role of Smart Specialisation, preliminary version,
OECD Publishing.
OECD (2013b), OECD Science, Technology and Industry Scoreboard 2013, OECD Publishing.
OECD (2013c), Taxing Energy Use: A Graphical Analysis, OECD Publishing.
OECD (2013d), OECD Skills Outlook 2013: First Results from the Survey of Adult Skills, OECD Publishing.
OECD, (2014a), OECD Services Trade Restrictiveness Index (STRI): Estonia, OECD Publishing.
OECD (2014b), Entrepreneurship at a Glance 2013, OECD Publishing.
OECD (2014c), Climate Change Mitigation in Estonia, Technical background paper: OECD Publishing,
forthcoming.
OECD (2014d), Society at a Glance 2014: OECD Social Indicators, OECD Publishing.
OECD/WB (2014), Making Innovation Policy Work – Learning from Experimentation, OECD Publishing.
Praxis Centre for Policy Studies (2011), Opportunities of Sustainable Financing of the Estonian Social
Insurance System.
Pungas, E., O. Toomet, T. Tammaru, K. Anniste, (2012), “Are Better Educated Migrants Returning?
Evidence from Multi-Dimensional Education Data”, NORFACE Working Papers No.2012-18.
Tapia, W. and J. Yermo (2008), “Fees in Individual Account Pension Systems: A Cross-Country
Comparison”, OECD Working Papers on Insurance and Private Pensions, No. 27, OECD publishing.
World Economic Forum (2013), The Global Competitiveness Report 2013-2014.
World Health Organisation (WHO) 2008, “Estonia Health System Review”, Health Systems in Transition
Vol. 10, No. 1.
36
© OECD 2015
OECD ECONOMIC SURVEYS: ESTONIA © OECD 2015
28
ASSESSMENT AND RECOMMENDATIONS
ANNEX
Progress in main structural reforms
This annex reviews action taken on recommendations from previous Surveys. They
cover the following areas: fiscal policy, labour market policies, education policies,
health policies, public sector efficiency, globalisation, financial sector and green
growth. Each recommendation is followed by a note of actions taken since the
October 2012 Survey. Recommendations that are new in this Survey are listed in the
relevant chapters.
37
OECD ECONOMIC SURVEYS: ESTONIA © OECD 2015
© OECD 2015
29
ASSESSMENT AND RECOMMENDATIONS
Improve the fiscal framework
Recommendations from previous surveys
Action taken since October 2012 survey
Avoid procyclical fiscal policy. Introduce multi-year expenditure
ceilings, covering also tax expenditure and local level spending. Be
prepared to implement discretionary fiscal policy measures to address
long-lasting booms associated with accumulation of imbalances that
threaten macroeconomic stability. Ensure sufficient independence of
the newly established fiscal institution, while leveraging the analytical
capacity of existing institutions.
The new budget law requires the general government budget to be in
structural balance or in surplus. The rule is consistent with EU rules,
including the fiscal compact of the Treaty on Stability, Coordination and
Governance in the Economic and Monetary Union.
Augment the work on estimates of the structural balance. Publish more No action taken.
detailed information about the business cycle and the underlying fiscal
position, reflecting associated uncertainties.
Task the new independent fiscal institution with assessing the cyclical An independent fiscal council was implemented in 2014.
indicators; monitoring the budget outcomes, and, when appropriate,
recommending discretionary policy measures.
The high labour tax wedge should be reduced by increasing the share
of less distortionary taxes, such as property and environmental taxes
and excise duties and reducing tax expenditures. Reductions in direct
taxes should be tilted towards low-earners.
The government increased the income tax-free allowance from EUR
145 to EUR 154 in 2014 and plans to lower the income tax rate from
21% to 20% in 2015. The unemployment insurance contribution rate
will be lowered from 3.2% to 2.4% in 2015. However, taxation of the
land underneath detached houses was abolished in 2013.
Phase out exemptions and preferential rates and further strengthen VAT Measures are planned to reduce VAT fraud.
administration. Apply the standard rate to all goods and services.
Consider introducing a tax on the use and the registration of motor No action taken.
vehicles differentiated by air pollution and energy consumption
characteristics.
Align the tax assessment of land value more closely with the market No action taken.
value by regularly updating assessments and enlarging the tax base to
include buildings.
Consider phasing out the tax deductibility of mortgages in the medium No action taken.
term to avoid further amplifying the cycles in the housing markets.
Consider phasing out the loan guarantee programme to reduce
distortions in housing investment.
Refocus the social protection system on activation and return to work,
underpinned with stronger inter-agency co-operation. Swiftly conclude
the analysis phase of preparing internet-based e-services. All workingage people with some capacity to work should become clients of local
unemployment insurance fund offices and be encouraged to participate
in job search and activation activities.
The parliament is considering a reform of disability benefits to increase
access to activation measures and strengthen the assessment of the
capacity to work. The planned reform also foresees to tie the receipt of
benefits to the obligation to use activation services.
Continue the reform of the disability pension system by giving The planned reform of disability benefits foresees provision of
employers a stronger role in prevention and rehabilitation.
rehabilitation services as early as possible.
The role of subsistence benefits should be reduced and municipalities No action taken.
should focus on addressing other problems such as social exclusion.
Unemployment assistance should become the main source of basic
income support and be subject to tight job search and training
conditionality.
Family support should be more oriented towards better reconciling the The government is planning to address local gaps in the provision of
obligations from parenthood and labour force participation, including formal childcare with structural funds from the European Union.
through better provision of childcare services.
38
© OECD 2015
OECD ECONOMIC SURVEYS: ESTONIA © OECD 2015
30
ASSESSMENT AND RECOMMENDATIONS
Improve labour market performance
Recommendations from previous surveys
Action taken since October 2012 survey
Continue to increase spending on active labour market policy, and
better target spending. Ensure stronger co-operation among local
governments, education institutions and the Unemployment Insurance
Fund.
Spending on ALMPs has increased significantly in recent years. New
measures targeted at long-term unemployed have been introduced,
including for job counselling and training. The government is planning
to raise spending in the public employment service further until 2020,
introducing new measures co-funded by the European Union. Support
targeted at youth will include wage-subsidies and training
Increase the effectiveness of activation programmes by allowing public
procurement to take greater account of the quality of training courses,
encouraging greater involvement of employers, and by targeting hiring
subsidies to firms committed to net hiring.
The programmes are monitored and qualification criteria set for service
providers. Qualification criteria are defined for each public procurement
process individually. Information and training events as well as
meetings with employers are regularly organised.
Develop electronic registration of the initial action plan in the first Online application (for registration, benefit claims and making
month of unemployment. Delay the face-to-face part of the Individual appointments with employment advisors) has been available since
Action Plan to after 3 months for most newly unemployed. Meanwhile June 2014.
devote more resources to at-risk groups from the first month.
Monitor the quality of work practice (internship) schemes and increase The quality of work practice is reviewed in regular meetings with
employers’ compensation for the cost of the supervision and employers. Cooperation agreements have been initiated with larger
instruction. Measures to promote workplace training, such as employers covering also on-the job-training offers for PES clients.
subsidies, should be more targeted.
Ensure that the PES internet portal is used by employers to regularly Individual employers are contacted and meetings are organised with
notify current vacancies and skills shortages. To this end, provide PES employers at regional and local level by the European Union Integration
consultant assistance to employers.
Fund (EUIF). The EUIF has also identified priority areas for training in
economic sectors with growth potential. Task forces have been created
to determine training needs, diagnose quality issues and identify other
training policy issues.
Prioritise training funds for language training for ethnic non-Estonians. Funds from the European Union are used to improve opportunities to
learn and practice Estonian.
Make the education system more efficient
Recommendations from previous surveys
Action taken since October 2012 survey
Ensure that the new means-tested support to tertiary education The new support scheme, launched in 2013, will be regularly evaluated.
students is sufficient, and expand the student loan scheme so that Tuition fees for higher education have been abolished between 2013
students with weaker socio-economic background can stop working and 2014.
during study.
Strengthen student counselling by providing high quality information The government’s Life-Long Learning Strategy 2014-2020 envisages
about labour market needs on every educational level.
improving information and counselling services especially for students
in the final stage of basic education.
Consider establishing an obligation to offer learning opportunities The EU youth guarantee scheme has been implemented. Youth who
through formal education, workplace training or apprenticeships until have not been in education and employment for 4 months receive an
the age of 18 for youth neither in education, employment or training. education, training or employment offer from the government.
Further strengthen co-operation with employers and consider giving The government plans to substantially increase funding of
subsidies for offering apprenticeship places for youth in vocational apprenticeships.
education. Increase the permeability between different educational
levels.
Develop quality assurance for apprenticeship places and ensure that No action taken.
the time for instruction is sufficient relative to productive work.
Increase the financial incentives of employers to invest in lifelong No action taken.
learning. Target public co-financing toward low educated and older
workers, as well as toward employees in SMEs.
Make lifelong learning more attractive for adults by ensuring that No action taken.
training leads to the acquisition of qualification and by providing
information about the return from different programmes.
39
OECD ECONOMIC SURVEYS: ESTONIA © OECD 2015
© OECD 2015
31
ASSESSMENT AND RECOMMENDATIONS
Make health care more efficient
Recommendations from previous surveys
Action taken since October 2012 survey
An update of the hospital network plan for active treatment should The government approved the National Health Plan until 2020 in 2014.
reflect changing healthcare consumption patterns of the population.
It strengthens collaboration between regional and county hospitals.
Ensure quality of care and consider developing a wider system of The National Health Plan until 2020 focuses on results and quality of
quality indicators, also through international collaboration on health care institutions. Indicators for comparing the results of different
establishing benchmarks and specialised care.
hospitals and doctors will be established. 97% of general practitioners
have joined the general practitioners quality system.
Increase the role and importance of primary care by boosting the The National Health Plan until 2020 will provide additional financing for
responsibilities of family doctors.
family doctors who have two nurses in their team. This will strengthen
the gate-keeping role of family doctors. The plan also envisages a
quality bonus system.
Improve health outcomes and reduce health outcome gaps by The National Health Plan until 2020 sets targets for raising the average
strengthening health spending efficiency, promoting healthy lifestyles age to which citizens are living in good health as well as average life
and improving access for disadvantaged groups.
expectancy.
Introduce a means tested cap on out-of-pocket payments to improve
the situation of low income households and protect the chronically ill.
Alternatively, this issue could be addressed through existing benefits
such as the subsistence minimum. Ensure adequate accessibility of
healthcare, in particular dental care, for financially distressed
households.
From January 2015 onwards, the Estonian Health Insurance Fund
reimburses 50% of patients’ expenditure on reimbursable medicines
exceeding 300 euros per year, and 90% for patients whose expenditure
exceeds 500 euros per year.
Continue with the promotion of generics and least expensive drugs
both among patients as well as doctors: monitor prescribing and
dispensing patterns and investigate and sanction those that deviate
excessively from norms.
Doctors are obliged to prescribe, in general, medicines by generic
name and pharmacists are obliged to offer patients the cheapest option.
Doctors and pharmacists compliance is controlled by an electronic
prescription database.
Enhance public sector efficiency
Recommendations from previous surveys
Action taken since October 2012 survey
Reform local governments either by merging or requiring greater co- The government initiated a local government reform in 2014, including
operation, also over a broad territorial area. Consider imposing funding and the assignment of responsibilities. An evaluation of the
minimum population requirements.
funding and implementation of spending responsibilities (through
inter-municipal cooperation, municipal associations, State government
offices) is underway. Local governments have established formal
cooperation in public transport, waste management, water and sewage
for example. These initiatives have generally been supported with
central government funding.
Develop further indicators and monitor quality standards of public The planned government reform will facilitate the establishment of
service provision to help to build up an argument for consolidation of joint-authorities for implementing local government tasks.
local government, especially for those municipalities that would be
underperforming.
Strengthen the revenue raising possibilities of local municipalities by No action taken.
giving them more autonomy over setting the land tax. One possibility
for enlarging revenues from this tax is to enlarge the tax base to include
buildings.
Consider tightening the equalisation scheme, for example by looking at Ministry of Finance is measuring the local governments` real costs of
real and normative costs set uniformly by the central government. providing public services. The results will be used to further develop
Consider reviewing the existing earmarking and block grants to evade the equalisation scheme.
overlaps.
40
© OECD 2015
OECD ECONOMIC SURVEYS: ESTONIA © OECD 2015
32
ASSESSMENT AND RECOMMENDATIONS
Make the most of globalisation
Recommendations from previous surveys
Action taken since October 2012 survey
Contain the threats to competition emanating from public monopolies No action taken.
and local authority sectors.
Do not adhere to numerical targets for R&D spending; projects should A set of qualitative and quantitative indicators has been developed to
be pursued according to their intrinsic worth.
measure the effectiveness of policies aimed at R&D, including
measuring behavioural changes of actors.
Consider introducing tax incentives for R&D.
No action taken.
Rebalance public resources for innovation support to prepare Estonian Increasing exports is one of the main pillars of the new “Entrepreneurial
firms to export and make sure the necessary services for small Growth Strategy 2020”. Export advice is offered by Enterprise Estonia
exporting firms are available at reasonable costs.
at a reasonable price.
Switch resources to the promotion of non-high tech areas which can The “Entrepreneurial Growth Strategy 2020” places a strong focus on
benefit from high-tech inputs.
increasing the added-value of non-high tech areas through a new policy
instrument – “tailor-made support for enterprises”. The policy
instrument aims at companies with significant growth potential. One of
the smart specialisation growth areas is “ICT supporting other
sectors”, which targets growth in non-high tech sectors with the help
of ICT.
Stability of the financial sector
Recommendations from previous surveys
Action taken since October 2012 survey
Mitigate credit cycles. Calibrate and prepare to implement
macroprudential tools, starting from countercyclical capital buffers. In
regard with cross-border co-operation increase efforts to effectively
implement a wider set of tools.
The amendments to the credit institutions act that transposed CRD IV
requirements into the Estonian legislation came into force in May 2014.
A systemic risk common equity capital buffer of 2% of risk-weighted
assets on large banks is effective as of August 2014. Eesti Pank also
started to develop an analytical framework to assess countercyclical
capital buffer requirements. It also plans to introduce in 2015 three new
macro-prudential instruments targeted to borrowers of housing loans:
Caps on loan-to-value and debt service-to-income ratios as well as a
maximum maturity for loans.
Further enhance cross-border supervisory co-operation, notably by
developing joint stress tests and crisis management exercises in the
Nordic-Baltic Stability Group. Widen the scope for the role of out-ofcourt restructuring. Actively promote financial literacy, including
awareness about risks of variable interest borrowing.
The Debt Restructuring and Debt Protection Act has been amended in
January 2014. The Financial Supervision Authority Act was amended in
July 2013. The aim was to promote the population's awareness of the
financial services and financial products. Several multilateral meetings
between the representatives of Scandinavian and Baltic supervisory
authorities were held in 2013 and 2014.
Introduce a specialist bankruptcy court to improve the expertise applied No action taken.
to debt restructuring and bankruptcy proceedings; ensure that the
court has the capacity to determine whether company directors have
met their obligations to petition for bankruptcy. Develop as a stop-gap
measure quantitative indicators to determine whether these obligations
have been met.
Give the existing court the power to require the creditor to pay for No action taken.
experts, particularly in more intricate corporate cases.
Develop a more detailed set of economic and financial principles for No action taken.
judges to take account of when deciding whether a debt restructuring
plan for individuals should be approved or not.
41
OECD ECONOMIC SURVEYS: ESTONIA © OECD 2015
© OECD 2015
33
ASSESSMENT AND RECOMMENDATIONS
Climate change mitigation and green growth
Recommendations from previous surveys
Action taken since October 2012 survey
Strengthen policies to reduce energy and resource intensiveness A New Energy Sector Development Plan as well as an Oil Shale
through appropriate pricing and setting better incentives for energy Development Plan are currently being developed. The government is
saving programmes.
also planning to introduce regulation in district heating, which will
provide networks with incentives to reduce losses from 22% currently
to 15% by 2017.
Continue with ecological tax reform pursuing both environmental and A stepwise increase in the excise duty payable on oil shale used for the
revenue-raising objectives.
production of heat is envisaged over the next five years.
42
© OECD 2015
OECD ECONOMIC SURVEYS: ESTONIA © OECD 2015
34
Chapter summaries
Chapter 1. Raising productivity and benefitting more from openness
Estonia can revitalise productivity growth and reap more benefits from its
openness. Productivity is relatively low in manufacturing and in large firms, as the
manufacturing sector focuses on low-technology goods exports to only a small number
of destinations. The economic impact of the Estonian R&D system still appears to be
limited, also because of a lack of knowledge transfer. Building on Estonia’s favourable
business environment, productivity growth could be raised by promoting smart
specialisation and innovation; removing remaining barriers to entrepreneurship and
competition; ensuring access to finance for SMEs; upgrading infrastructure; and
improving energy efficiency.
Chapter 2. Making the most of human capital
Labour input in Estonia remains lower than before the crisis. Skill mismatches
between workers and jobs contribute to structural unemployment. Emigration, notably
among young, employed workers, has reduced labour supply. Although the
government has lowered labour taxes and further reductions are planned, government
revenues still rely heavily on taxing employment. Shifting some of the tax burden on
labour to real estate would make the tax system more employment friendly. High costs
reduce the returns workers earn on the assets in the compulsory private pension
system, effectively raising the tax burden on labour. There is scope to reduce costs. In
the public pension system, phasing out early retirement schemes for workers in
specific sectors or professions would make room for lower social security
contributions. They pay gap between men and women is substantial and further steps
could be envisaged to reduce it. Reforms to improve the skills of Estonian workers have
a high pay-off in view of increased demand for skilled workers. The recent initiatives of
the government to foster life-long learning and improve financial support for students
from low-income families in tertiary education are welcome. There is scope to promote
apprenticeships, for example by fostering cooperation between local firms and local
schools. This would help reduce skill mismatch. More financial support is needed for
students, especially to ensure youth have access to upper secondary vocational
education.
© OECD 2015
35
This Survey is published on the responsibility of the Economic and Development
Review Committee of the OECD, which is charged with the examination of the
economic situation of member countries.
The economic situation and policies of Estonia were reviewed by the Committee on
5 November 2014. The draft report was then revised in the light of the discussions and
given final approval as the agreed report of the whole Committee on 15 December 2014.
The Secretariat’s draft report was prepared for the Committee by Andrés Fuentes
Hutfilter and Andreas Kappeler, under the supervision of Andreas Wörgötter. Research
and editorial assistance was provided by Seung-Hee Koh and Eun Jung Kim.
Heloise Wickramanayake formatted and produced the layout of the document.
The previous Survey of Estonia was issued in October 2012.
Further information
For further information regarding this overview, please contact:
Andreas Wörgötter, e-mail: [email protected];
tel.: +33 1 45 24 87 20;
Andrés Fuentes Hutfilter, e-mail: [email protected];
tel.: +33 1 45 24 89 29 or
Andreas Kappeler, e-mail: [email protected];
tel.: +33 1 45 24 74 69.
See also http://www.oecd.org/eco/surveys/Estonia.
How to obtain this book
This survey can be purchased from our online bookshop:
www.oecd.org/bookshop.
OECD publications and statistical databases are also available
via our online library: www.oecdilibrary.org.
Related reading
OECD Economic Surveys: OECD Economic Surveys review the
economies of member countries and, from time to time,
selected non-members. Approximately 18 Surveys are
published each year. They are available individually or by
subscription. For more information, consult the Periodicals
section of the OECD online Bookshop at
www.oecd.org/bookshop.
OECD Economic Outlook: More information about this
publication can be found on the OECD’s website at
www.oecd.org/eco/Economic_Outlook.
Economic Policy Reforms: Going for Growth: More information
about this publication can be found on the OECD’s website at
www.oecd.org/economics/goingforgrowth.
Additional Information: More information about the work of
the OECD Economics Department, including information about
other publications, data products and Working Papers available
for downloading, can be found on the Department’s website at
www.oecd.org/eco.
Economics Department Working Papers:
www.oecd.org/eco/workingpapers
OECD work on Estonia: www.oecd.org/Estonia
1
2
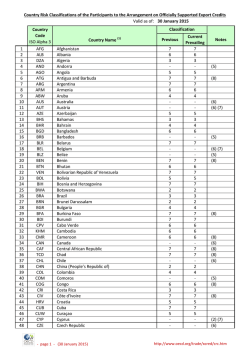


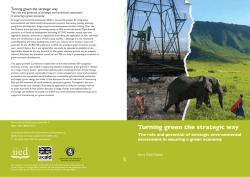
© Copyright 2026