
Status of Geodetically Controlled High
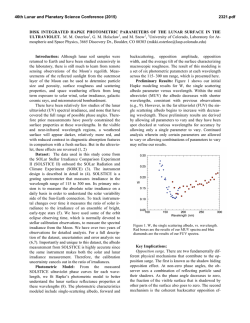
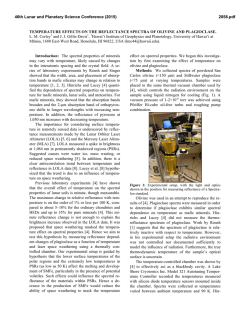
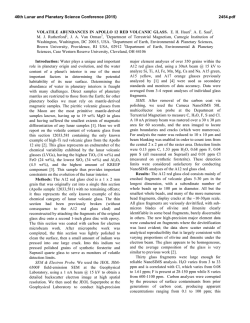
46th Lunar and Planetary Science Conference (2015)
1571.pdf
STATUS OF GEODETICALLY CONTROLLED HIGH-RESOLUTION LROC POLAR MOSAICS. Brent
Archinal1, Ella Lee1,2, Lynn Weller1, Janet Richie1, Ken Edmundson1, Mark Robinson3, Emerson Speyerer3, Aaron
Boyd3, Ernest Bowman-Cisneros3, Robert Wagner3, Ara Nefian4, 1USGS Astrogeology Science Center. (2255 N.
Gemini Drive, Flagstaff, AZ 86004; [email protected]); 2Retired; 3School of Earth and Space Exploration, Arizona State University, Tempe, AZ 85287; 4NASA Ames Research Center, Moffett Field, CA 94035.
Introduction: Our goal is to create geodetically
controlled high-resolution (1 m/pixel) Lunar Reconnaissance Orbiter (LRO) [1] narrow angle camera
(NAC) [2] polar mosaics of the lunar north and south
polar caps, poleward from 85° latitude. The final products of this effort will include controlled mosaics of all
useful and useable images and “illumination” controlled mosaics made at every 10° of solar longitude.
Similar mosaics were previously made under the
Lunar Mapping and Modeling Project (LMMP) [3].
However, they [4] were only from 85.5° poleward (going to 85° increases the area by 23%), using a smaller
number of images. They were also not optimized to
allow the creation of separate mosaics showing solar
illumination changes. Further, we have corrected some
problems in the control network used for the previous
mosaics and have improved our image tie-pointing
methods and network solution parameterization.
Illumination Mosaics: There will be 36 mosaics
for the north and south poles, at every 10° of solar longitude. We are evaluating whether to make one or two
types of mosaics in each case, including averaged mosaics and mosaics with the best illuminated images
shown in front of other images. Note that doing such
averaged mosaics (see Figure) is only possible when
the images are controlled to the sub-pixel level, thus
allowing images to be co-added, increasing the SNR in
low light conditions and showing all areas ever illuminated (at least while the images were collected).
With 148 possible mosaics at 1 m/pixel, 32
bits/pixel, each mosaic is ~86 GB in size for a total
volume of ~13 TB. The final mosaics and updated geometry information (SPICE [5]) will be archived to the
Planetary Data System (PDS).
These mosaics will provide many benefits for science, engineering, exploration, and for supporting future mapping and global lunar reference frame improvement efforts. The high resolution and accurate
registration properties will be useful for identifying
small scale permanently shadowed regions (lunar cold
traps) or areas of lengthy solar illumination (ideal sites
for future exploration [6]), targeting observations by
future missions (e.g. [7]), detailed surface characterization and landing site assessment [8], geological and
resource mapping, and change detection.
Other Benefits: This work also helps improve capabilities for the development of further large controlled mosaics, as well as provide information on what
critical tools will need to be developed in advance of
such work [9]. These products can also be used to
characterize the precision and accuracy of a priori
LRO SPICE data and possibly to provide further geometric calibration of the LROC and LOLA instruments. The updated SPICE (orientation, or C kernel)
data could also be used to improve the LRO Lunar
Orbiter Laser Altimeter (LOLA) [10] results. For example, improved orientation data would allow for a
new type of “crossover” adjustment of LOLA data
with controlled simultaneous NAC images.
Figure: Area (at 85.°588N, 123.°159E) in north polar
cap showing 7 images (top) in an uncontrolled averaged mosaic vs. (bottom) a controlled averaged mosaic. Note blurring and doubling of some features in the
top image with offsets up to 165 m. The scale is 3
m/pixel.
Current Solution Statistics: Control solutions are
being performed with the USGS ISIS software package
[11] and in particular the jigsaw application [12]. We
have completed preliminary control network solutions
for both poles, but are making further improvements
by checking and updating tie-pointing measurements,
and evaluating the usefulness of either problem images
or images unlikely to contribute much to the illumination mosaics (e.g., those with solar latitude on the opposite side of the equator or with very small areas of
46th Lunar and Planetary Science Conference (2015)
illumination). Images not used are tracked for future
use, or for possible manual work to update an area of
interest. These networks have not yet been constrained
(controlled to ground in absolute coordinates). The
following table shows the current network results:
Current Solution
North Pole South Pole
Images
7,295
18,972
Points
374,025
1,648,933
Measures
2,414,102
13,900,384
Std. Dev. (pix.)
0.37
3.9 (prelim.)
Max. resid. (pix.)
3.29
~700 (prelim.)
Technical Problems Encountered: Numerous
problems have been encountered but they have been
largely addressed for the current purposes. Problems
include a) manual checking of high residual tie points;
b) manual measures needed to be added for some “island” images (i.e. with few areas of illuminated overlap with other images) including 26 images in the
north; and c) some images have not been successfully
controlled because they are blank (532 in the north), or
they are part of an island and the images do not overlap. We are also still assessing the best way to winnow
out bad data near the edges of images and in shadows
when the mosaics are generated. This caused black line
artifacts in the previous LMMP best-resolution image
on top mosaics, and is still causing similar artifacts for
such mosaics as well as for averaged mosaics.
Comparison to Other Networks: Due to the significant increase in the number of images used, these
networks are substantially larger than the original
LMMP networks, and in terms of the total number of
control points and measures, comprise the largest solar
system control networks ever done, possibly including
terrestrial networks. Only a final global THEMIS IR
controlled mosaic [13] is likely to exceed these networks in size in the next several years. Current large
planetary networks are listed in the table here:
Body
Moon
Moon
Moon
Mercury
Mars
Moon
Moon
Name/reference
ULCN 2005 [14]
LMMP North Pole
USGS [4]
LMMP South Pole
USGS [4]
USGS Messenger (Pers.
Comm.)
USGS Themis IR [13]
North Pole (this work)
South Pole (this work)
Images
43866
3682
Points
272931
340142
Measures
546126
2102373
3827
527756
3363623
60281
555120
6599703
13496
7295
18972
1578113
374025
1648933
6069647
2414102
13900384
Ground Control: We are considering several possibilities for providing absolute horizontal and vertical
control of these networks. For example, we have tried
to illuminate LOLA gridded digital terrain models
(DTMs) and do image matching to LROC images (at
20 m/pixel). Such matching failed due to the lower
resolution of the illuminated DTMs, although this
1571.pdf
could be attempted again with improved LOLA models
that incorporate more data. We now plan to use NASA
Ames Stereo Pipeline [15] routines that are to be available soon. Algorithms have been successfully developed for matching between LOLA track data and
Apollo Metric camera images and are being adapted to
do matching to NAC images. We plan to install this
software at USGS and create tools to use the matching
information for comparison with or in our network
solutions, in the latter case redoing our solutions with
the LOLA tie information constrained appropriately to
the accuracy of the LOLA track data.
Plans: This year we plan to finish the initial full
north and south pole solutions, create preliminary averaged mosaics and test 10° illumination mosaics, and
derive LOLA-based control points for comparison. In
2016, we will complete final solutions tied to LOLA
points, make final mosaics, archive products to the
PDS, and document the work with a journal article.
Future Needs: This work serves as a reminder of
the need for developing cartographic processing tools
for even larger mosaics. Examples are the global
THEMIS IR work or the likely global coverage of the
Moon at 2 m/pixel with LROC images – with a need to
possibly control well over 1 million NAC images – as
opposed to the ~26,000 images being worked here.
Previous recommendations [9] regarding the need for
doing NASA cartography planning and developing
such tools still stand.
Acknowledgements: This effort is funded by the
NASA Lunar Advanced Science and Exploration Research program, and builds on early funded efforts by
the LRO Participating Scientist Program and LMMP.
We also acknowledge the tremendous work and effort
by LRO mission and the LROC and LOLA personnel,
without which this work would not be possible.
References: [1] Vondrak et al. (2010) Space Sci.
Rev. 150, 7. [2] Robinson et al. (2010) Space Sci. Rev.
150, 81. [3] Noble et al. (2009) LEAG, #2014. [4] Lee
et al. (2012) LPS XLIII, #2507. [5] Acton (1996). PSS,
44(1), 65; http://naif.jpl.nasa.gov/naif/. [6] Speyerer
and Robinson (2012) Icarus, 222, 122. [7] Jolliff et al.
(2009) LPS XL, #2343. [8] Archinal et al. (2011) LPS
XLII, #2316. [9] Archinal et al. (2012) LPS XLIII,
#2394;
http://astrogeology.usgs.gov/groups/nasaplanetary-cartography-planning. [10] Archinal et al.
(2010) LPS XLI, #2609. [11] Keszthelyi et al. (2014)
LPS XL, #1686. [12] Edmundson et al. (2012) Int. Ann.
Photog., Rem. Sens. & Spatial Inf. Sci., I-4, 203. [13]
Fergason et al. (2012) LPS XLIV, #1642. [14] Archinal
et al. (2006) USGS Open-File Report 2006-1367,
http://pubs.usgs.gov/of/2006/1367/. [15] Moratto et al.
(2010) LPS XLI, #2364.

© Copyright 2026