
Device simulations of nanocrystalline silicon thin
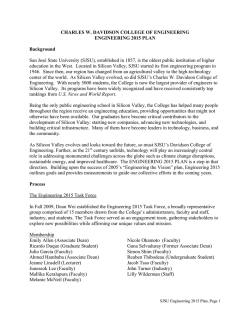
Solid-State Electronics 47 (2003) 1917–1920
www.elsevier.com/locate/sse
Device simulations of nanocrystalline silicon
thin-film transistors
D. Dosev
a,*
, B. I~
nıguez a, L.F. Marsal a, J. Pallares a, T. Ytterdal
b
a
b
Department of Electronics, Electrics and Automatics Engineering, ETSE, Universitat Rovira i Virgili,
Av. Pa€ısos Catalans 26, Campus Sescelades, 43007 Tarragona, Spain
Department of Physical Electronics, Norwegian University of Science and Technology, Trondheim, N-7491, Norway
Received 1 September 2002; received in revised form 1 March 2003; accepted 1 April 2003
Abstract
In this paper, we present the results of numerical simulations of inverted-staggered thin-film transistors (TFTs) with
nanocrystalline silicon channel, using the semiconductor device simulator ATLAS from Silvaco. We study the influence
of the density of the acceptor-like defect states concentration on the transistorsÕ transconductance. Analysis of the free
and the trapped carriersÕ concentrations at different gate voltages shows that the value of density of defect states determines the behaviour of nanocrystalline silicon TFTs between amorphous and polycrystalline silicon TFTs.
2003 Elsevier Ltd. All rights reserved.
Keywords: TFT; Nanocrystalline silicon; Density of states
1. Introduction
Thin-film transistors (TFTs) are utilized as switching elements in large-area electronics. Amorphous and
polycrystalline hydrogenated silicon (a-Si:H and polySi:H) are commonly used materials for the fabrication of
TFTs. The a-Si:H is easily deposited over large areas at
low deposition temperatures (below 450 C) but it suffers
degradation under bias stress and under illumination [1].
To avoid this problem, a-Si:H is converted to poly-Si:H
using high-temperature thermal annealing [2]. Poly-Si:H
is more stable but its fabrication requires expensive
substrates due to the high-temperature processes. Newly
proposed materials are nanocrystalline and microcrystalline hydrogenated silicon (nc-Si:H and lc-Si:H). A
variety of low-temperature techniques have been proposed for their deposition at very low temperatures
(below 150 C) [3–5]. TFTs made by nc-Si:H have on/off
*
Corresponding author. Tel.: +34-977-55-8521; fax: +34977-55-9605.
E-mail address: [email protected] (D. Dosev).
ratio and field-effect mobility similar to the a-Si:H TFTs.
On the other hand, nc-Si:H TFTs do not suffer degradation under bias stress or illumination [4,6–8], similarly
to poly-Si:H TFTs. Other significant difference between
nc-Si:H TFTs and a-Si:H TFTs have been noted in the
shape of the transconductance gm ¼ dIDS =dVGS which
tends to constant value at high gate voltage for a-Si:H
TFTs but increases in the case of nc-Si:H TFTs [7,9].
In our recent paper, we studied how the experimentally measured characteristics of nc-Si:H TFTs fit to the
existing TFT models and we proposed a new DC spice
model for nc-Si:H and lc-Si:H TFTs based on some
physical assumptions [9].
Our aim in this work is to justify the assumptions used in [9] and to obtain deeper understanding of
the physical parameters and processes responsible for
the behaviour of nc-Si:H TFTs. We performed twodimensional numerical simulations of nc-Si:H TFTs,
using the semiconductor device simulator Silvaco Atlas
[10], and compared our numerical simulations with
experimental data of inverted-staggered nc-Si:H TFT
deposited by hot-wire chemical vapour deposition at
120 C which is described in detail in [3,7].
0038-1101/$ - see front matter 2003 Elsevier Ltd. All rights reserved.
doi:10.1016/S0038-1101(03)00167-9
1918
D. Dosev et al. / Solid-State Electronics 47 (2003) 1917–1920
2. Experiment and simulation
In Fig. 1, is shown the experimentally measured gm of
a nc-Si:H TFT. After initial increasing for small gate
voltages (VGS ¼ 0–5 V), there is a short saturation interval of the gm curve for VGS ¼ 10–17 V, followed by
linear increase at higher VGS . For a-Si:H TFTs a saturation of gm is expected as the device enters the linear
region. This can be observed simulating the examples of
a-Si TFTs proposed in ATLAS. On the other hand, a
sharp increase at low gate voltages and a higher saturation value of gm are expected for poly-Si:H TFTs.
Our purpose in this work is to find out the physical
parameters responsible for the increasing of the transconductance gm at positive gate voltage.
In our numerical simulations, we used twodimensional inverted-staggered structure shown in Fig.
2. This structure corresponds to the cross section of the
experimentally studied sample [7,11]. The total structure
Fig. 1. Experimentally measured transfer characteristic [3,7]
and transconductance of nc-Si:H TFT with W =L ¼ 2.5.
Drain and Source metal contacts
n+ nc-Si:H
nc-Si:H
Gate metal contact
Gate SiO 2
Fig. 2. Structure used in the numerical simulations of nc-Si:H
TFT in Atlas.
length is 90 lm; the drain and source contacts lengths
are 20 lm each, and the distance between them (the
channel length) is 50 lm. The gate SiO2 thickness is 200
nm, the thickness of the undoped nc-Si:H layer is 200
nm and the thickness of the n+ doped contact nc-Si:H
layer is 50 nm.
In ATLAS, the material parameter which defines
properties of amorphous or polycrystalline silicon is the
density of defect states (DOS) in the silicon material [10].
It is assumed that the total density of states is composed
of four bands: Two tail bands (a donor-like valence
band and an acceptor-like conduction band) and two
deep level bands (one acceptor-like and one donor-like),
which are modelled using a Gaussian distribution. For
an exponential tail distribution, the DOS is described by
its conduction and valence band edge intercept densities (NTA and NTD), and by its characteristic decay
energy (WTA and WTD). For Gaussian distributions,
the DOS is described by its total density of states (NGA
and NGD), its characteristic decay energy (WGA and
WGD), and its peak energy/peak distribution (EGA and
EGD) [10]. We studied the influence of the DOS parameters on the transconductance, in order to understand
the physical processes responsible for the behaviour illustrated in Fig. 1.
The acceptor-like states determine the properties
of n-channel TFTs. In order to study the influence of
the acceptor-like states on gm , we performed various
simulations with different values of WTA: 0.017, 0.020,
0.025, 0.030, 0.035, 0.040 and 0.045 eV. Higher value of
WTA corresponds to wider acceptor-like exponential
tail and defines amorphous silicon properties, while
lower value of WTA corresponds to narrow acceptorlike tail and defines polycrystalline silicon properties.
For the rest of the material parameters, we used continuous defect-states distribution with default values for
amorphous silicon as follows: NTA ¼ 1 · 1021 , NTD ¼
1 · 1021 , NGA ¼ 1.5 · 1015 , NGD ¼ 1.5 · 1015 cm3 eV1
and WTD ¼ 0.049, WGA ¼ 0.15, WGD ¼ 0.15 eV.
In Fig. 3 we show the DOS shape for the different
simulations that we performed. We kept the same profile of the donor-like states for all simulations. The
higher WTA value, the higher is the simulated density of
acceptor-like states.
In Fig. 4 is presented the simulated transconductance at different values of WTA. Lower transconductance corresponds to higher values of WTA. For WTA ¼
0.040 and 0.045 eV the transconductance has shape
typical a-Si:H TFT, without significant increasing at
high gate voltages. For WTA ¼ 0.035, gm begins to increase linearly at VGS ¼ 22–25 V. When WTA ¼ 0.030,
the simulated transconductance shows a short saturation interval between 8 and 15 V, then increases at
higher VGS . This shape is very similar to the experimentally measured transconductance. For values of
WTA higher than 0.030 eV, the saturation of gm at low
D. Dosev et al. / Solid-State Electronics 47 (2003) 1917–1920
Fig. 3. Numerically simulated density of states, using different
WTA values.
Fig. 4. Numerically simulated transconductance, using different WTA values.
VGS becomes shorter and disappears completely for
WTA ¼ 0.017 eV. At the same time the final saturation
of gm occurs at higher values and begins at lower VGS .
The simulated transconductance shape for WTA ¼ 0.017
eV is typical for poly-Si TFTs.
These results are in agreement with the theory of the
a-Si based TFTs. Acceptor-like states with lower density
are easily filled by electrons when positive gate voltage is
applied. This leads to higher drain current and transconductance at low gate voltages. Materials with higher
density of acceptor-like states require higher gate voltage in order the acceptor states to be filled. Therefore,
higher gate voltage is needed in order to produce higher
drain current and transconductance. We conclude that
in nc-Si:H the density of acceptor-like states is higher
than in poly-Si:H and at the same time is lower than in
a-Si:H.
According to Shur [12], the ratio between trapped
and free carriers in the channel determines the working
regime of the a-Si:H TFT. In a-Si:H TFTs the acceptorlike states are supposed to be filled at gate voltages be-
1919
Fig. 5. Numerically extracted carriers concentrations vs. gate
voltage.
tween 50 and 100 V. For lower VGS , free carrierÕs concentration is always lower than the trapped carrierÕs
concentration [12]. As a consequence the acceptor-like
states are never completely filled at conventionally used
VGS values (0–40 V). On the contrary, for poly-Si there is
much lower defects concentration and the acceptor-like
states are filled by electrons at much lower VGS .
We performed a detailed study of the trapped and
the free induced carriers for WTA ¼ 0.030 at each gate
bias point. In Fig. 5 with closed circles is presented the
concentration of the trapped electrons (ntrapped ) and with
open circles is presented the concentration of the free
electrons (nfree ). For VGS below 10 V, ntrapped is much
higher than nfree .
At gate voltage above 30 V, the induced electrons fill
almost all the traps and ntrapped is almost independent by
VGS . On the other hand, increasing of VGS induces more
electrons and nfree exceeds ntrapped . In these conditions the
device behaves as poly-Si TFT and the transconductance
achieves values typical for poly-Si TFTs (Fig. 4).
In Fig. 5, at gate voltages between 10 and 30 V change
in the dominant concentration occurs from ntrapped nfree
to ntrapped < nfree and the transconductance increases
from values typical for a-SI TFTs to values typical for
poly-Si TFTs.
Due to lower density of states in nc-Si:H we observe
this effect at much lower VGS than is expected for a-Si:H
[10]. Improved stability of the nc-Si:H TFTs compared
to a-Si:H TFTs could be also attributed to the lower
DOS. On the other hand the density of states in nc-Si:H
is higher than in poly-Si. That is why nc-Si:H TFTs
exhibit many of the properties between a-Si:H and polySi:H TFTs.
3. Conclusions
Numerical simulations show that the acceptor-like
defect states in nanocrystalline are filled at much lower
1920
D. Dosev et al. / Solid-State Electronics 47 (2003) 1917–1920
gate voltages than in amorphous TFTs having similar
threshold voltages. The transconductance of nanocrystalline TFTs has a shape typical for amorphous TFTs
before the acceptor-like states are filled. When electrons
fill the acceptor-like states, the transconductance of
nanocrystalline TFTs becomes typical for poly-silicon
TFTs. The reason for this behaviour is the density of
acceptor-like states, which situates the nanocrystalline
TFTs properties between the amorphous and the polycrystalline transistors.
Acknowledgements
This work was supported by the CICYT of the
Spanish Government under programme TIC99-0842C03. D. Dosev would like to acknowledge the financial
support from the Departament d’Universitats, Recerca i
Societat de la Informacio de la Generalitat de Catalunya,
Spain. The authors would like to thank R. Alcubilla and
J. Puigdollers from Universitat Politecnica de Catalunya,
J. Andreu and D. Peiro from Universitat de Barcelona
for their support in the TFTs fabrication.
References
[1] Powell MJ, van Berkel C, Franklin AR, Deane SC, Milne
WI. Defect pool in amorphous-silicon thin-film transistors.
Phys Rev B 1992;45:4160–70.
[2] Stoemenos J, Economou NA, Haji L, Bonnel M, Duhamel
N, Loisel B. Microstructure of poly-Si obtained by rapid
thermal annealing of amorphous silicon films. Diffus
Defect Data, Part B 1994;37:287–92.
[3] Puigdollers J, Orpella A, Dosev D, Voz C, Peiro D,
Pallares J, et al. Thin film transistors obtained by hot wire
CVD. J Non-Cryst Solids 2000;266:1304–9.
[4] Cabarrocas PR, Brenot R, Bulkin P, Vanderhaghen R,
Drevillon BA, French I. Stable microcrystalline silicon
thin-film transistors produced by the layer-by-layer technique. J Appl Phys 1999;86:7079–82.
[5] Wehrspohn RB, Powell MJ, Deane SC, French ID, Roca i
Cabarrocas P. Dangling-bond defect state creation in
microcrystalline silicon thin-film transistors. Appl Phys
Lett 2000;77:750–2.
[6] Dosev DK, Puigdollers J, Orpella A, Voz C, Fonrodona
M, Soler D, et al. Analysis of bias stress on thin-film
transistors obtained by hot-wire chemical vapour deposition. Thin solid films 2001;383:307–9.
[7] Dosev D. Fabrication, characterization and modeling of
microcrystalline nanocrystalline silicon thin film transistors
obtained by hot-wire chemical vapour deposition. PhD
thesis, Universitat Politecnica de Catalunya, Barcelona,
2003. http://www.tdx.cesca.es/TDX-0409103-100135/.
[8] Schropp REI, Feenstra KF, Molenbroek EC, Meiling H,
Rath JK. Device-quality polycrystalline and amorphous
silicon films by hot-wire chemical vapour deposition.
Philos Mag B 1997;76:309–21.
[9] Dosev D, Ytterdal T, Pallares J, Marsal LF, I~
nıguez B. DC
SPICE model for nanocrystalline and microcrystalline
silicon thin film transistors. IEEE Trans Electron Dev
2002;49(11):1979–84.
[10] SILVACO_Inc., Atlas UserÕs Manual, vol. 1. Santa Clara,
CA, 2000.
[11] Puigdollers J, Dosev D, Orpella A, Voz C, Peiro D,
Bertomeu J, et al. Microcrystalline silicon thin film transistors obtained by hot-wire CVD. Mater Sci Eng B 2000;70:
526–9.
[12] Shur M. Physics of semiconductor devices. New Jersey:
Prentice Hall Inc.; 1990.


© Copyright 2026