
Estimation of Transient Temperature Distribution
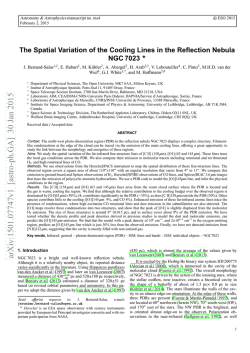
Strojniški vestnik - Journal of Mechanical Engineering 61(2015)2, 107-114 © 2015 Journal of Mechanical Engineering. All rights reserved. DOI:10.5545/sv-jme.2014.1997 Original Scientific Paper Received for review: 2014-06-06 Received revised form: 2014-11-26 Accepted for publication: 2014-12-15 Estimation of Transient Temperature Distribution during Quenching, via a Parabolic Model Lozano, D.E. – Martinez-Cazares, G. – Mercado-Solis, R.D. – Colás, R. – Totten, G.E. Diego E. Lozano1,* – Gabriela Martinez-Cazares2 – Rafael D. Mercado-Solis2 – Rafael Colás2 – George E. Totten3 1 FRISA, México 2 Autonomous University of Nuevo Leon, México 3Portland State University, USA A material-independent model to estimate the transient temperature distribution in a test probe quenched by immersion is presented in this study. This model is based on the assumption that, under one-dimensional unsteady heat conduction, the radial temperature distribution at the end of an interval belongs to the equation of a parabola. The model was validated using AISI 304 stainless steel test probes (Φ8×40 mm and Φ12×60 mm) quenched from 850 to 900 °C in water and in water-based NaNO2 solutions at 25 °C and in canola oil at 50 °C. Additionally, square test probes (20×20×100 mm) were quenched from 550 °C in water. The test probes were equipped with embedded thermocouples for temperature-versus-time data logging at the core, one-quarter thickness and 1 mm below the surface. In each experiment, the data recordings from the core and near-surface thermocouples were employed for the temperature calculations while the data from the one-quarter thickness thermocouple were employed for model validity verifications. In all cases, the calculated temperature distributions showed good correlations with the experimentally obtained values. Based on the results of this work, it is concluded that this approach constitutes a simple, quick and efficient tool for estimating transient surface and radial temperature distributions and represents a useful resource for quenchant cooling rate calculations and heat transfer characterizations. Keywords: temperature distribution, quenching, parabola, heat transfer coefficient, cooling rate, cooling curve analysis Highlights • Parabolic model to calculate transient temperatures during the quenching. • Only the temperature histories of two points in the radial direction are needed. • The direct usage of simple algebraic equations minimizes calculation times with good accuracy. • The solutions are independent of material thermo-physical properties. • Heat transfer coefficient is directly solved via Fourier’s law of heat conduction. • The model is an alternative to the Inverse Heat Conduction Problem (IHCP). 0 INTRODUCTION In heat treatment technology, quenchants with improved heat transfer properties and enhanced hardening capacities are under continuous development. In order to test such attributes, a common practice is to equip test probes with one or more thermocouples for temperature-versus-time data logging during a quenching cycle. By doing so, the speed at which heat is extracted from within the test probe (i.e. the cooling rate) can be calculated by means of cooling curve analyses, as per ISO 9950 [1], ASTM D6200 [2], ASTM D6482 [3] and ASTM D6549 [4], etc. From the metallurgical point of view, the knowledge of the cooling kinematics at the various heat transfer stages during the quenching of steel is an aspect of key practical importance. In this sense, a martensitic as-quenched microstructure would result from a sufficiently high cooling rate in order to avoid the pearlitic and bainitic transformations in the higher temperature range while cracking and distortion could be minimized by slower cooling kinematics in the martensitic transformation range at lower temperatures [5]. The cooling curves extracted from instrumented test probes may also be employed in the estimation of the surface temperature during quenching [6] and [7]. This may be further extended to calculate the heat transfer coefficient (HTC) and the heat flux densities (HFD) [8] to [11]. These two parameters adequately describe the overall heat transfer characteristics of a quenching system. The most popular technique for performing these calculations is the so-called inverse heat conduction problem (IHCP). In principle, the IHCP relies on the numerical solution of Fourier’s well-known partial differential equation [12]. To solve the IHCP, the local temperature history (cooling curve) of one point inside the test probe should be known. Based on an initial “guess” of the HTC, an iterative calculation process is started to match the calculated temperature history with the measured one. In this way, the surface temperature may be estimated from the HTC values and from the thermo-physical properties of the test probe material (i.e. density, *Corr. Author’s Address: FRISA S.A. de C.V., Santa Catarina, Nuevo Leon, Mexico, [email protected] 107 Strojniški vestnik - Journal of Mechanical Engineering 61(2015)2, 107-114 thermal conductivity and specific heat capacity, etc.) within the quenching temperature range. Although the effectiveness of the IHCP has been extensively verified [13], the correct solution to the problem always remains largely dependent upon inputting the right thermo-physical properties, which are not easily measured. This is perhaps the main downside of the IHCP. In this paper, a relatively simple and straightforward approach for estimating transient temperature distributions and the surface temperature of a quenched part is presented. This model is based on the assumption that the temperature distribution inside the body follows a parabolic-type behaviour [14]. Thus, it may be regarded as an alternative to the IHCP, with the advantage that no thermo-physical properties are needed in the calculations, and that the direct usage of simple algebraic equations minimizes calculation times with acceptable accuracy. In summary, the implications of Eq. (4) are such that, during the cooling of a cylinder, the temperature of any point along the radial direction may be calculated if the temperatures of another two points along the same direction (T2 and Tc) are simultaneously known. 1 DESCRIPTION OF THE PARABOLIC MODEL During the cooling of symmetric bodies under onedimensional heat conduction, the assumption is made that the radial temperature distribution at the end of an interval belongs to an upside down parabola that is symmetric about the y axis defined as y = –ax2 + c and whose origin is at the center of the body at an arbitrary temperature [14]. Thus, by making the y axis the temperature and the x axis the radial distance from the center, the temperature Tc at the core of the bar (xc = 0) then corresponds to the vertex of the parabola, i.e. y = c = Tc (Fig. 1). Similarly, the temperature T2 at a radial distance from the centre x2 also belongs to the aforementioned parabola, and is, therefore, defined as: T2 = −ax2 2 + Tc . (1) Therefore, by solving Eq. (1) for a, we obtain: T −T a = c 2 2 . (2) x2 Based on the model assumptions, the temperature Trth at any given radial distance from the center xrth at the end of an interval shall also belong to the parabola, and is defined in the most general form as: Trth = −axrth 2 + Tc . (3) By substituting Eq. (2) in (3), we obtain: 2 108 x Trth = (T2 − Tc ) rth + Tc . (4) x2 Fig. 1. Parabolic temperature as a function of radial distance at the end of a quenching interval 2 EXPERIMENTAL VALIDATIONS In order to validate the parabolic model, a series of quenching experiments were performed using instrumented AISI 304 stainless steel test probes. In accordance with the minimum diameter-to-length ratio (1:4) practicable for one-dimensional heat conduction [15], two sizes of round cross-sectional test probes were fabricated: f8×40 mm and f12×60 mm. Additionally, square cross-sectional test probes 20×20×100 mm were also quenched for comparison. Three f1 mm blind holes were drilled in each test probe up to their mid-length at the core, one-quarter thickness and 1 mm below the quenched surface, as shown in Fig. 2. K-type thermocouples were tightly embedded in the holes for temperature-versus-time data logging during quenching. In order to prevent water from entering the thermocouple holes, zirconium oxide paint was used as a sealant. The thermocouples were differentially connected to a data acquisition card (NI USB-6211) using a 75 kW resistor between the negative of the thermocouple and the ground for a high electrical reference. Data was acquired at a rate of 100 samples per second and then smoothed through a cubic spline interpolation algorithm. This is an adequate method to Lozano, D.E. – Martinez-Cazares, G. – Mercado-Solis, R.D. – Colás, R. – Totten, G.E. Strojniški vestnik - Journal of Mechanical Engineering 61(2015)2, 107-114 obtain an accurate global approximation over the time range [15]. The quenching experiments are summarized in Table 1. Quenchings were carried out inside a glass reservoir that contained 12 litres of quenchant. Tap water and sodium nitrite (NaNO2) aqueous solutions at concentrations of 1 and 9 % wt. were employed as quenchants. The initial temperature of the water and the water-based quenchants was 25 °C, while that of the oil was 50 °C. During the quenching experiments, a localized quenchant temperature increase (up to ~45 °C) was recorded with a thermocouple placed 50 mm away from the probe surface, but this increase was only limited to the regions adjacent to the test probe, while the overall temperature of the quenchant remained almost unchanged. After each experiment, the quenchant was stirred and left to cool down to 25 °C before the next experiment. The round test probes were quenched from temperatures of 850 and 900 °C, while the square test probes were quenched from 550 °C. 2 x Ts = (Tns − Tc ) s + Tc . (6) xns The one-quarter thickness temperature readings were employed for model self-validations by comparing the experimentally obtained values (Tq) with the calculated ones (T’q) through Eq. (5). The temperature difference Tdiff between T’q and Tq and their percent error were calculated for each quenching experiment as: Tdiff = Tq′ − Tq , (7) % error = Tdiff Tq ×100. (8) Table 1. Summary of quenching experiments Experiment 1 2 3 4 5 Type Size [mm] Round ø8×40 Round ø8×40 Round ø8×40 Round ø12×60 Square 20×20×100 Temp. [°C] 850 850 900 900 550 Quenchant Water 9 % NaNO2 Canola oil 1 % NaNO2 Water 3 RESULTS AND DISCUSSION Fig. 2. Drawings of the test probes and thermocouple positions; a) ø12 mm round test probe; b) square test probe For each quenching experiment, the logged temperatures at the core (Tc) and at the near-surface (Tns) were input into the parabolic equation along with their radial distances. Therefore, the onequarter thickness temperature (T’q) and the surface temperature (Ts) were calculated. Thus, for the new experimental notation, Eq. 4 may be suitably rewritten as: 2 x T 'q = (Tns − Tc ) q + Tc , (5) xns The cooling curves obtained experimentally, and the calculated temperatures at the surface and one-quarter thickness are shown in the top charts of Figs. 3 to 7. The temperature difference and the percentage of error between the experimental and the calculated values at the one-quarter thickness are presented in the bottom part of the same figures. Fig. 3 shows the results of Experiment 1, in which, although the calculated curve does not generally overlap the experimentally measured one, they do follow the same trend. The maximum temperature difference occurred at the start of cooling where its influence upon the percentage of error is less due to the higher temperature values. The average error during the first 3 seconds was 4 %, while the average temperature difference was 17 °C. This is the interval where the curves overlapped less. Thereafter, the curves showed a good fit, and the highest temperature difference between the two remained within 6 °C and the error below 6 %. Notice that the calculated surface temperature curve drops to 100 °C (boiling point of water) and, except for the small reheating obtained due to the internal heat source, the temperature remained near the Estimation of Transient Temperature Distribution during Quenching, via a Parabolic Model 109 Strojniški vestnik - Journal of Mechanical Engineering 61(2015)2, 107-114 Fig. 3. Cooling curves of Experiment 1; a) temperature versus time, b) error % and temperature difference versus time Fig. 5. Cooling curves of Experiment 3; a) temperature versus time, b) error % and temperature difference versus time Fig. 4. Cooling curves of Experiment 2; a) temperature versus time, b) error % and temperature difference versus time Fig. 6. Cooling curves of Experiment 4; a) temperature versus time, b) error % and temperature difference versus time 110 Lozano, D.E. – Martinez-Cazares, G. – Mercado-Solis, R.D. – Colás, R. – Totten, G.E. Strojniški vestnik - Journal of Mechanical Engineering 61(2015)2, 107-114 boiling point. This phenomenon is a self-regulating thermal process, in which the surface temperature does not cool below this point until sufficient heat has been extracted from the bulk of the probe [16]. Furthermore, since no agitation was used during quenching, localized heating of the quenchant up to its boiling point occurs. Thus, the surface becomes locally surrounded by the quenchant at the same temperature of the surface until the free convection of the fluid mixes it with the quenchant mass from more distant areas. In Experiment 2 (Fig. 4), a similar quenching was performed, except that sodium nitrite (NaNO2) was added in the water at 9 % wt concentration to promote a more severe cooling. Here, the film boiling (vapour) stage at the start of quenching is effectively suppressed. The boiling point of water is increased by salt additions and, thus, the surface temperature is expected to remain above 100 °C. From Fig. 4, it can be observed that, during the first three seconds, the error between the measured and the calculated temperatures reached a maximum of 4 % and the maximum temperature difference was 16 °C. The average error and temperature difference for the first three seconds were 2.15 % and 8 °C, respectively. At quenching intervals between 3 and 5 seconds, the average values were as low as 0.7 % error and 0.7 °C temperature difference. The calculated surface temperature decreased to 133 °C due to the higher boiling temperature of the salt solution. The cooling curves of Experiment 3 corresponding to the 8 mm diameter bar quenched in canola oil are shown in Fig. 5. The heat extraction capacity of the vegetable oil is considerably lower than that of water and water-based salt solutions. Therefore, lower thermal gradients between the surface and the core of the test probe were measured. Since the temperature difference between the thermocouples was small, the error when calculating the temperature distribution was also small. The average error was only 1.8 %, and the average temperature difference was 0.8 °C throughout the full quenching interval. For most of the time range, the error between the experimental and the calculated temperatures was less than 5 °C. Increasing the size of the sample did not produce any changes in the parabolic temperature distribution, as shown in the results of Experiment 4 (Fig. 6). Here, a 12 mm diameter bar was quenched in 1 %wt NaNO2 aqueous solution. The calculated temperature using the parabola equation overlapped the experimental curve. The temperature difference always remained below 16 °C. On average, the error was 6.6 % and the temperature difference 9 °C. In addition to the round bars, a bar of square crosssection was instrumented and quenched. The long square bar exhibits one-dimensional heat conduction at mid-thickness as would a slab. For Experiment 5 (Fig. 7), the square bar was heated to 550 °C followed by quenching in water at 25 °C. At the start of cooling, a stable vapour blanket formed around the probe. The calculated T’q temperature does not match the experimental data initially. This may be due to the inefficient heat transfer conditions established during this quenching stage and geometric effects. After the first 3 seconds, at which point the error reached 10 % and the temperature difference reached a high value of 50 °C, the calculated data overlapped the experimental curve with a small difference of 4.5 °C and progressed to an almost exact fit thereafter. Fig. 7. Cooling curves of Experiment 5; a) temperature versus time, b) error % and temperature difference versus time 4 COOLING RATE CALCULATION EXAMPLE The rate at which cooling of the probes proceeds at any instant during quenching is determined by Newton’s Law of Cooling. Here, a practical example of the use of cooling curve analyses for cooling rate calculations is presented for Experiments 2 and 3. The procedure involves the adjustment of the best-fit mathematical expression to each temperature-versus- Estimation of Transient Temperature Distribution during Quenching, via a Parabolic Model 111 Strojniški vestnik - Journal of Mechanical Engineering 61(2015)2, 107-114 time data set and its subsequant derivation; thus, dT/ dt is the cooling rate, which can be conveniently plotted against temperature and/or time. Fig. 8 shows the cooling rates obtained from Experiment 2 and the corresponding (calculated) surface temperature. It can be observed that the vapour phase is entirely suppressed; hence, very high cooling rates are achieved in the early stages of quenching at high temperatures. The addition of NaNO2 to the water result in high cooling rates reaching a maximum value of 1,300 °C/s as the surface temperature lowered to 700 °C. It is noteworthy that the maximum cooling rate is around 40 % higher at the surface that just 1 mm below it and 60 % higher than the core. Fig. 8. Cooling rates of Experiment 2 throughout the quenching cycle. Thus, the maximum cooling rate was 185 °C/s at a surface temperature of 700 °C. 5 HEAT TRANSFER COEFFICIENT CALCULATION EXAMPLE An example is presented for the calculation of the interfacial heat transfer coefficient from the surface temperature profile obtained through the parabolic model (appendix I). In references [15] and [17], Liščić and Filetin produced the experimental cooling data of the Liščić-Petrofer probe (ϕ50×200 mm) quenched in low viscosity accelerated quenching oil at 50 °C. These data have been reproduced in Fig. 10 and the surface temperature was calculated using the parabolic model. Fig. 10. Experimental cooling data from references [15] and [17] and surface temperature calculation via the parabolic model Fig. 9. Cooling rates of Experiment 3 Fig. 11. Comparison of heat transfer coefficient calculation between the IHCP [15] and [17] and the parabolic model Similarly, the calculated cooling rates from Experiment 3 are shown in Fig. 9, where the film boiling phase was noticed at the start of quenching. After the vapour blanket was destabilized, the nucleate boiling phase is present until 350 °C was reached, followed by the convection stage. Due to the absence of large thermal gradients, the rate of cooling is nearly the same inside the test probe and on its surface Fig. 11 shows the comparison of the HTC results reported by Liščić and Filetin [15] and Liščić et al. [17] by solving the IHCP (solid line) and by the calculated surface temperature profile via the parabolic method in this study (dashed line). The maximum value of HTC calculated by the two methods matched 3,200 W/m²K. Moreover, a good agreement in the trend of the two curves was found. However, the surface 112 Lozano, D.E. – Martinez-Cazares, G. – Mercado-Solis, R.D. – Colás, R. – Totten, G.E. Strojniški vestnik - Journal of Mechanical Engineering 61(2015)2, 107-114 temperature at which the maximum HTC occurs in each method differs by approximately 100 °C, i.e. the parabolic HTC curve is shifted towards the lower temperature range. In Liščić’s method, the maximum value of HTC takes place when the maximum cooling rate of the surface occurs, whereas in the parabolic method, the maximum value of HTC takes place when the largest thermal gradient is set in the test probe. 6 CONCLUSIONS The parabolic model can correctly capture the radial temperature profile of test probes of various sizes and quenching media. For the analysis, only the temperature histories of two points in the radial direction are needed. Therefore, it provides the advantage that no thermo-physical properties are required, and the direct usage of simple algebraic equations minimizes calculation times with acceptable accuracy. Based on the results, it was concluded that this method is better suited for quenching in oil for which overly strong thermal gradients are not present, although entirely acceptable results were also obtained for water and aqueous solution quenchants. Once the surface temperature has been calculated, the procedure to determine the heat transfer coefficient and the heat flux density is highly simplified through the direct solution of the heat flux via Eq. (12) of Appendix. 7 ACKNOWLEDGEMENTS The authors wish to thank the following institutions for their support: Universidad Autonoma de Nuevo Leon, Facultad de Ingenieria Mecanica y Electrica and Consejo Nacional de Ciencia y Tecnologia (CONACYT-Mexico). 8 REFERENCES [1] ISO 9950:1995. Industrial Quenching Oils-- Determination of Cooling Characteristics—Nickel-Alloy Probe Test Method. International Organization for Standardization, Geneve [2] ASTM Standard D6200-01 (2012). Standard Test Method for Determination of Cooling Characteristics of Quench Oils by Cooling Curve Analysis. ASTM International, West Conshohocken. [3] ASTM Standard D6482-06 (2011). Standard Test Method for Determination of Cooling Characteristics of Aqueous Polymer Quenchants by Cooling Curve Analysis with Agitation (Tensi Method). ASTM International, West Conshohocken. [4] ASTM Standard D6549-06 (2011). Standard Test Method for Determination of Cooling Characteristics of Quenchants by Cooling Curve Analysis with Agitation (Drayton Unit). ASTM International, West Conshohocken. [5] Luty, W. (2010). Cooling media and their properties. Quenching Theory and Technology 2nd ed. Liscic, B., Tensi, H.M., Canale, L.C.F., Totten, G.E. (eds.). CRC Press, Boca Raton, DOI:10.1201/9781420009163-c12. [6] Meekisho, L., Hernandez-Morales, B., Tellez-Martinez, J.S., Chen, X. (2005). Computer-aided cooling curve analysis using WinProbe. International Journal of Materials and Product Technology, vol. 24, p. 155-169, DOI:10.1504/ IJMPT.2005.007946. [7] Hernandez-Morales, B., Lopez-Sosa, F., Cabrera-Herrera, L. (2012). A new methodology for estimating heat transfer boundary conditions during quenching of steel probes. Proceedings of 6th International Quenching and Control of Distortion Conference, p. 81-92. [8] Hasan, H.S. (2009). Evaluation of Heat Transfer Coefficients during Quenching of Steels. PhD. thesis, University of Cambridge, Cambridge. [9] Felde, I. (2012). Estimation of heat transfer coefficient obtained during immersion quenching. Proceedings of 6th International Quenching and Control of Distortion Conference, p. 447-456 [10] Lubben, T., Rath, J., Krause, F., Hoffman, F., Fritsching, U., Zoch, H. (2012). Determination of heat transfer coefficient during high-speed water quenching. International Journal of Microstructure and Materials Properties, vol. 7, no. 2-3, p. 106-124, DOI:10.1504/IJMMP.2012.047494. [11] Felde, I. (2012). Determination of thermal boundary conditions during immersion quenching by optimization algorithms. Materials Performance and Characterization, vol. 1, no. 1, p. 1-11, DOI:10.1520/MPC104417. [12] Beck, J.V. (1970). Nonlinear estimation applied to the nonlinear inverse heat conduction problem. International Journal of Heat and Mass Transfer, vol. 13, p. 703-716, DOI:10.1016/0017-9310(70)90044-X. [13] Landek, D., Župan, J., Filetin, T. (2014). A prediction of quenching parameters using inverse analysis. Materials Performance and Characterization, vol. 3, no. 2, p. 229-241, DOI:10.1520/MPC20130109. [14] Harding, R.A. (1976). Temperature and Structural Changes during Hot Rolling. PhD thesis, University of Sheffield, Sheffield. [15] Liščić, B., Filetin, T. (2012). Measurement of quenching intensity, calculation of heat transfer coefficient and global database of liquid quenchants. Materials Engineering Materiálové inžinierstvo, vol. 19, no. 2, p. 52-63. [16] Kobasko, N.I. (2012). Effect of accuracy of temperature measurements on determination of heat transfer coefficient during quenching in liquid media. Journal of the ASTM International, vol. 9, no. 2, p. 126-141 DOI:10.1520/ JAI104173. [17] Liščić, B., Filetin, T., Landek, D., Župan, J. (2014). Current investigations at quenching research centre. Materials Performance and Characterization, vol. 3, no.2, p. 3-18, DOI:10.1520/MPC20130102. [18] Holman, J.P., (1997). Heat Transfer. 8th ed. McGraw-Hill, New York. Estimation of Transient Temperature Distribution during Quenching, via a Parabolic Model 113 Strojniški vestnik - Journal of Mechanical Engineering 61(2015)2, 107-114 9 APPENDIX: HEAT TRANSFER COEFFICIENT CALCULATION If a semi-infinite hot cylinder is suddenly quenched, then the heat flux will occur in one dimension according to Fourier’s law of heat conduction. The energy balance for convection is therefore expressed as [18]: −kA ∂T ∂x ( ) = hA Tsurface − T∞ (9) surface 114 −k Tm+1 = Tm + ( h∆x k ) T∞ 1 + ( h∆x k ) , (11) where Tm+1 is the surface temperature, Tm is the near-surface temperature, Δx is the distance between the two positions, T∞ is the quenchant temperature, h is the heat transfer coefficient and k is the thermal conductivity. If the surface and near-surface temperatures are known, The finite-different numerical solution of unsteadystate conduction with convection boundary condition: or: ∆y (Tm+1 − Tm ) = h∆y (Tm+1 − T∞ ) , (10) ∆x then the heat transfer coefficient may be calculated as: h=− k (Tm+1 − Tm ) . (12) ∆x (Tm+1 − T∞ ) Lozano, D.E. – Martinez-Cazares, G. – Mercado-Solis, R.D. – Colás, R. – Totten, G.E.


© Copyright 2026