
9. SPAIN
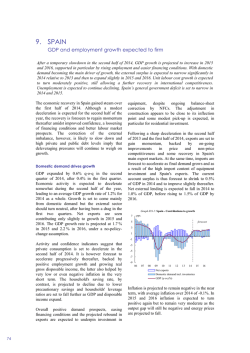
9. SPAIN
Growth expected to decelerate but remain robust
Economic growth has again exceeded expectations in recent quarters. It is still expected to ease but
remain robust throughout the forecast horizon. Although domestic demand is expected to remain the
main driver of growth, the contribution of the external sector is set to turn positive. Inflation is expected
to pick up in 2017 as oil prices increase and core inflation recovers. Unemployment is set to continue to
fall steadily to 16½% by 2018. The reduction of the general government deficit in 2017 and 2018 relies
to a large extent on the positive macroeconomic outlook.
Upward revision to growth in 2016
The pace of economic growth again exceeded
expectations in the first three quarters of 2016,
when GDP grew by 0.8% quarter-on-quarter in
both the first and second quarters and by 0.7% in
the third quarter. Accordingly, Spain’s economy is
forecast to grow by 3.2% in 2016 as a whole,
revised up from 2.6% in the spring forecast.
Although domestic demand is expected to remain
the main growth driver, the contribution of the
external sector to GDP growth is turning positive.
external lending is expected to remain at or above
2.4% of GDP over the forecast horizon.
4
Graph II.9.1: Spain - Real GDP growth and contributions
pps.
forecast
2
0
-2
-4
-6
Growth set to decelerate but remain robust
The rate of GDP growth is expected to ease over
the forecast horizon to a still relatively robust 2.3%
in 2017 and 2.1% in 2018. Private consumption is
expected to slow down as employment growth
decreases and the tailwinds that supported the
growth of disposable income in recent years (i.e.
the decline in oil prices and improving financial
conditions) gradually abate. Investment growth is
expected to ease somewhat in 2017 before
increasing again in 2018, driven by the gradual
recovery of construction investment, both
residential and non-residential. Equipment
investment growth, by contrast, is expected to
moderate in line with final demand.
Export growth is picking up this year compared to
2015, especially for services. It is expected to slow
down slightly in 2017 and 2018. However, despite
declining in yearly terms, exports are expected to
pick up again towards the end of the forecast
period as Spain's trading partners recover. At the
same time, imports are forecast to decelerate in
line with final demand and grow more slowly than
exports throughout the forecast horizon. As a
result, net exports are set to make a positive
contribution to growth also in 2017 and 2018.
However, after widening in 2016, Spain’s current
account surplus is forecast to marginally decrease
in 2017 and stabilise thereafter, under the impact
of the expected swings in terms of trade. Net
88
-8
09
10
11
12
13
14
15
16
17
Inventories
Net exports
Dom. demand excl. invent.
Real GDP (y-o-y%)
18
Inflation expected to pick up
The assumed oil price increases are set to continue
dominating inflation developments in the short
term. Hence, headline inflation is forecast to rise
from −0.4% in 2016 to 1.6% in 2017, before
decreasing slightly to 1.5% in 2018 as the effect of
energy price increases fades away. At the same
time, core inflation is expected to gradually
increase over the forecast horizon.
Employment growth expected to moderate
Job creation accelerated in the third quarter of
2016 compared to the second quarter, and although
it is set to ease over the forecast period, it is
projected to remain strong, allowing for further
reductions in unemployment. The unemployment
rate, which amounted to 18.9% of the labour force
in the third quarter of 2016, is expected to continue
falling to 16½% by 2018. Continued wage
moderation combined with still low productivity
gains is set to lead to moderate increases in
nominal unit labour costs over the forecast
horizon.
Member States, Spain
Deficit reduction driven by the recovery, while
remaining high
Despite strong economic growth, Spain’s general
government deficit barely changed in the first half
of 2016. Available monthly data for August and
September for some subsectors of general
government confirmed this picture. Whereas
expenditure has grown in line with expectations,
revenues have been weighed down by significant
shortfalls in income tax revenue. This is especially
the case for the corporate income tax following the
second leg of the tax reform and the abolition of
the minimum advance payments, which came into
effect in 2016. To limit the negative impact on the
budget balance of the latter, the parliament adopted
a Royal Decree Law in October reintroducing the
minimum advance payments, with an extended
coverage of firms and increased amounts. As a
result, the general government deficit is expected
to decrease from 5.1% in 2015 to 4.6% in 2016. It
is then expected to narrow to 3.8% of GDP in 2017
and is projected to reach 3.2% of GDP in 2018. In
the absence of a budget for 2017, the reduction of
the deficit in both years relies to a large extent on
the positive macroeconomic outlook, which should
continue supporting tax revenues and keeping
social transfers in check. In particular, while
pension expenditure is expected to continue rising,
falling unemployment should reduce the growth of
social transfers. Previous improvements in
financing conditions imply that interest
expenditure is set to continue decreasing.
After deteriorating significantly in 2015, Spain’s
structural deficit is expected to increase further by
some 1% of GDP in 2016 and stabilise thereafter.
Relatively strong nominal GDP growth largely
offsets the still large, though declining, deficit
expected over the forecast horizon, allowing the
general government debt ratio to remain broadly
stable around 100% of GDP. The forecast assumes
a planned debt-decreasing stock-flow adjustment
of 1.1% of GDP in 2016, as reported in the draft
budgetary plan.
Table II.9.1:
Main features of country forecast - SPAIN
2015
bn EUR
GDP
Private Consumption
Public Consumption
Gross fixed capital formation
of which: equipment
Exports (goods and services)
Imports (goods and services)
GNI (GDP deflator)
Contribution to GDP growth:
Annual percentage change
Curr. prices
% GDP
97-12
2013
2014
2015
2016
2017
2018
1075.6
100.0
2.2
-1.7
1.4
3.2
3.2
2.3
2.1
625.0
58.1
1.9
-3.1
1.6
2.9
3.2
2.1
1.6
208.5
19.4
3.5
-2.1
-0.3
2.0
0.9
0.8
0.8
212.1
19.7
1.8
-3.4
3.8
6.0
4.2
3.6
3.8
72.7
6.8
2.9
5.0
8.3
8.9
6.7
4.5
3.9
356.9
33.2
4.5
4.3
4.2
4.9
6.1
4.5
4.4
330.5
30.7
4.2
-0.5
6.5
5.6
5.8
4.3
4.1
1074.9
99.9
2.2
-1.5
1.6
3.5
3.2
2.2
2.1
2.3
-2.9
1.6
3.2
2.9
2.1
1.9
0.0
-0.2
0.3
0.1
0.1
0.0
0.0
0.0
1.5
-0.5
-0.1
0.2
0.2
0.2
1.3
-3.5
1.1
3.0
2.8
2.1
1.8
14.1
26.1
24.5
22.1
19.7
18.0
16.5
3.0
1.4
-0.1
0.4
1.2
1.2
1.4
2.1
-0.5
-0.4
0.2
0.8
1.1
1.1
-0.4
-0.8
-0.1
-0.3
0.1
-0.1
-0.4
Domestic demand
Inventories
Net exports
Employment
Unemployment rate (a)
Compensation of employees / f.t.e.
Unit labour costs whole economy
Real unit labour cost
Saving rate of households (b)
GDP deflator
Harmonised index of consumer prices
Terms of trade goods
Trade balance (goods) (c)
Current-account balance (c)
Net lending (+) or borrowing (-) vis-a-vis ROW (c)
General government balance (c)
Cyclically-adjusted budget balance (d)
Structural budget balance (d)
General government gross debt (c)
10.2
9.6
9.0
8.2
8.4
8.4
8.4
2.6
0.4
-0.3
0.5
0.7
1.2
1.5
2.7
1.5
-0.2
-0.6
-0.4
1.6
1.5
-0.2
0.6
-0.5
2.0
0.8
-0.9
-0.4
-5.5
-1.4
-2.2
-2.0
-1.9
-2.1
-2.2
-4.6
1.5
1.0
1.3
1.7
1.5
1.5
-3.9
2.1
1.5
2.0
2.6
2.4
2.4
-3.1
-7.0
-6.0
-5.1
-4.6
-3.8
-3.2
-3.2
-2.5
-2.3
-3.0 -
-3.8
-3.8
-3.8
-
-2.0
-1.9
-2.8 -
-3.8
-3.8
-3.8
54.3
95.4
100.4
99.8
99.5
99.9
100.0
(a) as % of total labour force. (b) gross saving divided by gross disposable income. (c) as a % of GDP. (d) as a % of potential GDP.
89


© Copyright 2026